Abstract
The pathogenic bacterium Pseudomonas syrinage pv. actinidiae causes bacterial canker disease, which is the most damaging disease afflicting kiwifruit (Actinidia chinensis). The most prevalent strain is biovar 3 (Psa3), which is highly pathogenic. Therefore, Psa3-resistant varieties of kiwifruit are urgently needed. A previous study reported that Actinidia rufa, a wild Japanese species related to kiwifruit, is highly resistant to Psa3. Genome-wide DNA markers may be useful to locate the loci that confer Psa3 resistance. Therefore, in the present study, we used published kiwifruit genome sequence information to design 1,101 simple sequence repeat (SSR) markers covering the entire kiwifruit genome in silico. We next examined DNA polymorphisms in more than 1,000 polymerase chain reaction products for potential use as SSR markers among A. rufa Fuchu and A. chinensis FCM1, a pollen-providing parent Fuchu A. chinensis male 1, and other kiwifruit cultivars in order to develop Psa3 resistant kiwifruit cultivars. We finally obtained 351 polymorphic markers, in the entire kiwifruit genome, which can be applied to produce next-generation kiwifruit cultivars, including Psa3-resistant cultivars.
Introduction
The genus Actinidia (Family Actinidiaceae) contains approximately 40 species. Among these, cultivated kiwifruit generally belong to one of two species, A. deliciosa or A. chinensis (Huang et al., 2013). Kiwifruit is a vigorous deciduous vine, which bears fruit rich in vitamin C (ascorbic acid) and vitamin E (alpha-tocophenol), and also with high contents of folic acid, potassium, dietary fiber, and other nutrients (Huang et al., 2013). To meet rising market demand, production of kiwifruit has been increasing, and the global harvest reached approximately 4 million tons in 2019 (FAOSTAT, <http://www.fao.org/faostat/en/#data/QCL/visualize>, Accessed: September 15, 2021). However, the domestication history is relatively short, and there are few known kiwifruit varieties for commercial cultivation. Kiwifruit is thought to have originated in China (Li et al., 2007). Commercial production began only in the early 20th century, when the first seeds were introduced from China to New Zealand (Linsley-Noakes, 1984). Because kiwifruit is highly sensitive to cold, heat, soil aridity, and humidity, the development of new cultivars tolerant to severe environmental conditions will be required to further increase production. For this purpose, extensive breeding of A. chinensis, utilizing wild relatives, is currently underway in Europe, the United States, and New Zealand (Tang et al., 2017). In Japan, the genetic variation, fruiting potential, fruit traits, and environmental adaptability have been intensively investigated in some native Actinidia species including A. rufa. Some kiwifruit accessions have shown tolerance to various types of stresses (Kataoka et al., 2014; Kim et al., 2007; Matsumoto et al., 2011). The persistent occurrence of bacterial canker caused by the pathogenic bacterium Pseudomonas syringae pv. actinidiae (Psa) is the most serious problem in kiwifruit production globally. To date, five biovars (biovar 1, 2, 3, 5, and 6) with different pathogenicity have been reported; among these, the Psa biovar 3 (Psa3) strain is prevalent in major production areas worldwide. Psa3 damage was reported in April 2014 for the first time in Japan. Because Psa3 is extremely virulent, and few chemicals are effective as control, the selection of new Psa3-resistant varieties is urgently needed.
Woody fruit trees typically have a generational cycle of 3–10 years, so the development of a new variety for selection takes a long time. Additionally, during the breeding process, a large area and extensive labor are required. Although the application of genomic information can shorten this process, application of genome analysis to the breeding program is limited for fruit trees compared with annual and herbaceous plants. Recent advances have led to the development of high-density linkage maps, DNA markers, and other molecular markers, which can identify genes linked to useful traits (Akagi et al., 2018, 2019; Guichoux et al., 2011; Li et al., 2016; Liu et al., 2015; Mertten et al., 2012; Qu and Liu, 2013; Sablok et al., 2015). For example, the genome of the A. chinensis cultivar Hong Yang was draft-sequenced using a heterozygous diploid (2n = 58) plant with next-generation sequencing (NGS). The kiwifruit genome was found to be 616.1 Mb in length, containing a possible 39,040 genes (Huang et al., 2013). The A. chinensis Hong Yang genome was later examined at high resolution using a hybrid assembly technique (Wu et al., 2019), and current research is focusing on database construction for this variety (Yue et al., 2020). The data obtained in such studies can be used to detect large numbers of DNA polymorphisms within the kiwifruit genome, which can then be further applied in linkage and quantitative trait locus (QTL) analyses to identify loci associated with agronomically important traits for DNA marker breeding (Yano and Matsuoka, 2004; Yonezawa et al., 1997).
In the present study, we used DNA sequence information from a public database to search for genome regions that could be used as simple sequence repeat (SSR) markers for future kiwifruit breeding studies. We used two Actinidia collection lines: A. rufa Fuchu, a wild species native to Japan, possessing a Psa3-resistant locus (Kisaki et al., 2018, 2019), and A. chinensis male accession (FCM1) selected at Fuchu Fruit Research Institute. We also used preserved germplasm at Kagawa University and the Fuchu Fruit Research Institute in Kagawa to search for DNA polymorphisms and loci associated with Psa3 resistance.
Materials and Methods
Plant materials
The experimental materials used in this study were young leaves from a total of 16 kiwifruit cultivars and collection lines including seven A. rufa collection lines (Fuchu, Kochi, Ishigaki, Okinawa, Awaji, Ashizuri B, and Nakamura B), three A. chinensis cultivars (FCM1, Rainbow Red, and Kohi), and four progeny lines of crosses between A. rufa and A. chinensis; Kagawa UP-Ki-3, Kagawa UP-Ki-5 (both are registered cultivars with trademarks of Sanuki Kiwicco), Ke-51, and Kosui, A. macrosperma and A. callosa. All plant materials were obtained from the Fruit Tree Laboratory of the Faculty of Agriculture, Kagawa University and the Fuchu Fruit Research Institute at the Kagawa Prefectural Agricultural Experiment Station (Table 1).
Database
We extracted candidate regions for SSR markers from genome information in the Kiwi Fruit Database derived from A. chinensis Hong Yang <http://kiwifruitgenome.org/organism/2> (Huang et al., 2013).
Extraction and filtering of SSR markers
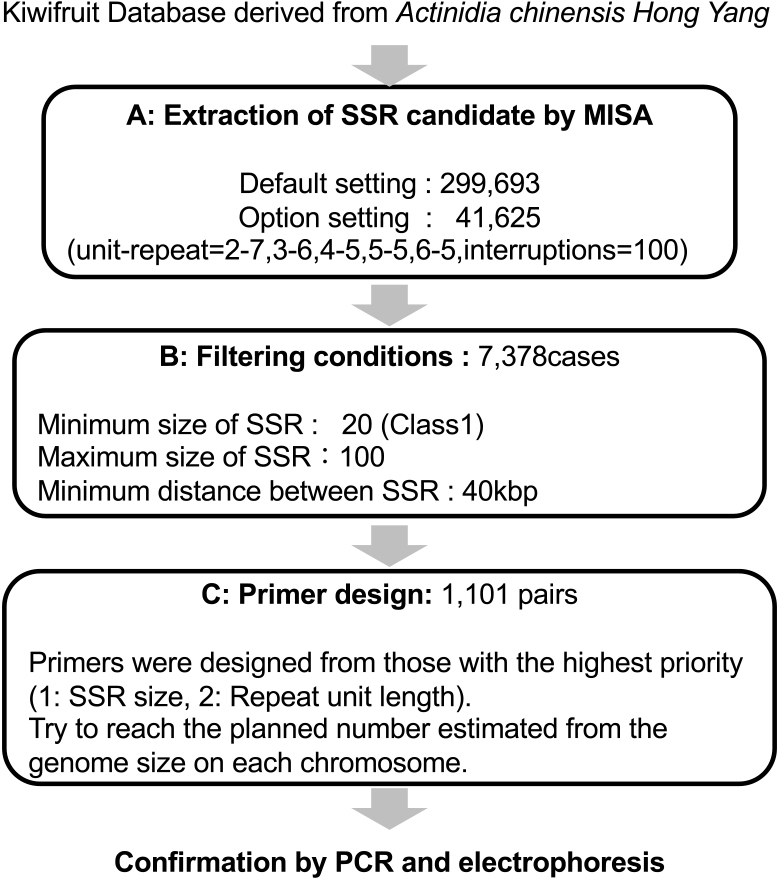
We applied a genome-wide approach to identify approximately 1,000 pairs of primers sandwiching possible SSR regions in a genome-wide polymorphism analysis (Fig. 1). We maintained as large a distance as possible between SSRs to ensure that the markers would not be concentrated within one region. We preferentially selected SSR candidate regions with an appropriate size to ensure that polymorphisms would be easily detected via agarose gel electrophoresis. We anticipated differences of ≥ 10 bp between varieties. We used the MIcroSAtellite (MISA) identification tool (Beier et al., 2017, <https://webblast.ipk-gatersleben.de/misa/>) to extract SSR candidates under the following conditions: unit repeat = 2–7, 3–6, 4–5, 5–5, 6–5; interruptions = 100; filter = SSR size; minimum value = 20 (class 1); maximum SSR size = 100; minimum SSR distance = 40 kbp.
Polymerase chain reaction (PCR) primer design for SSR markers
Primers were designed from large SSRs and those with short repeat unit lengths. SSRs located within 300 kbp upstream and downstream from designed SSRs were excluded from the design target. If a primer could not be designed with a certain SSR, then that SSR may be prevented from being excluded from the target, regardless of whether a strong candidate was in the vicinity (± 40 kbp). Primer specificity was verified using a database for non-unique region masking. We checked whether the filtered SSR candidates overlapped in the coding sequence area. The primer size was approximately 20 bp and the PCR product size was 100–300 bp; larger products were treated as exceptions. As far as possible, we maintained a constant annealing temperature. This process was continued until the expected number estimated from the genome size of each chromosome was reached. Following an extensive homology search, we used only unique sequences as primers for SSR markers; candidate primers were selected using the Primer 3 software. The proportion of non-specific regions in the primer was set to 85% or less. The designed primers were obtained as a single product using the MFE Primer PCR simulation program.
DNA extraction from young kiwifruit leaves
Genomic DNA was extracted from 2 g of young kiwifruit leaves for each variety using a modified cetyl trimethylammonium bromide (CTAB) method (Yamamoto and Hayashi, 2001). After freeze crushing, approximately 20 mL of washing buffer was added to a 50-mL tube containing crushed leaves. Centrifugation at 4°C was performed twice, with the supernatant discarded each time. Viscous substances on the surface of the precipitated crushed leaves were removed to the extent possible. CTAB extraction solution was added, and the temperature was maintained at 60°C for 1 h. Then, 1.5 mL of a chloroform solution was added, and the mixture was shaken for 5 min (operation I). After centrifuging at 20°C and 7,000 rpm for 15 min, the supernatant was placed in a new 50-mL tube (operation II). We performed operations I and II twice, and then 1.5 mL of 10% CTAB solution and 30 mL of CTAB precipitation buffer were added to the product, and the mixture was maintained at room temperature for 30 min. Thereafter, the mixture was centrifuged at 8,000 rpm for 15 min at 4°C, the supernatant was discarded, 1.6 mL of 1 M NaCl containing RNase was added, and the mixture was warmed at 60°C for 1 h. After iso-propanol precipitation, the supernatant was discarded, and the remaining material was air-dried. Then, 0.5 mL of Tris EDTA was added, and the mixture was maintained at 4°C, at least overnight, to dissolve the DNA. Finally, the DNA concentration was measured before use in each experiment.
Detection of polymorphisms through electrophoresis of PCR products
We used the designed PCR primers to detect polymorphisms between the A. rufa Fuchu and A. chinensis FCM1. First, PCR was performed using Ex Taq (TaKaRa Bio Inc., Shiga, Japan) and a thermal cycler (SimpliAmp; Thermo Fisher Scientific, USA) under the following reaction conditions: heat denaturation at 94°C for 2 min, followed by 35 cycles of thermal denaturation at 94°C for 30 s, annealing at 50°C for 30 s, and extension reaction at 72°C for 30 s, and a final step of 72°C for 5 min, followed by cooling at 10°C (Supplemental Table S6). After the PCR reaction, electrophoresis was performed in 3% agarose gels at a voltage of 120 V using 0.5 × Tris/borate/EDTA buffer for approximately 1.5 h. Finally, imaging was performed using a gel imaging device (STAGE-2000; AMZ System Science, Osaka, Japan) to confirm the band pattern using a DNA size marker (Gene Ladder 100; Nippon Gene Co., Ltd., Tokyo, Japan).
PCA cluster analysis using kiwifruit SSR markers
Using the results of polymorphism analysis (Fig. 3; Supplemental Table S7) with the developed 98 kiwifruit SSR markers and 16 strains and varieties (Table 2), PCA cluster analysis was performed using free software R (version 4.1.2) (Fig. 4).
Results
Extraction of SSR marker candidates
The initial SSR search using MISA software was performed with the default settings. We extracted 299,693 SSRs from the kiwifruit genome database. Although the kiwifruit genome contains 29 chromosomes, we aimed to select approximately 1,000 pairs of PCR primers to sandwich the SSRs targeted for use in a genome-wide polymorphism analysis. Restricting the minimum distance between SSRs to 40 kbp yielded > 7,000 SSR regions (7,378 SSRs) (Table 2). Following the filtering procedures described above, 1,101 SSRs throughout the kiwifruit genome were selected to design the primers (Figs. 1 and 2; Table 2; Supplemental Table S1).
Polymorphism analysis using kiwifruit SSR markers
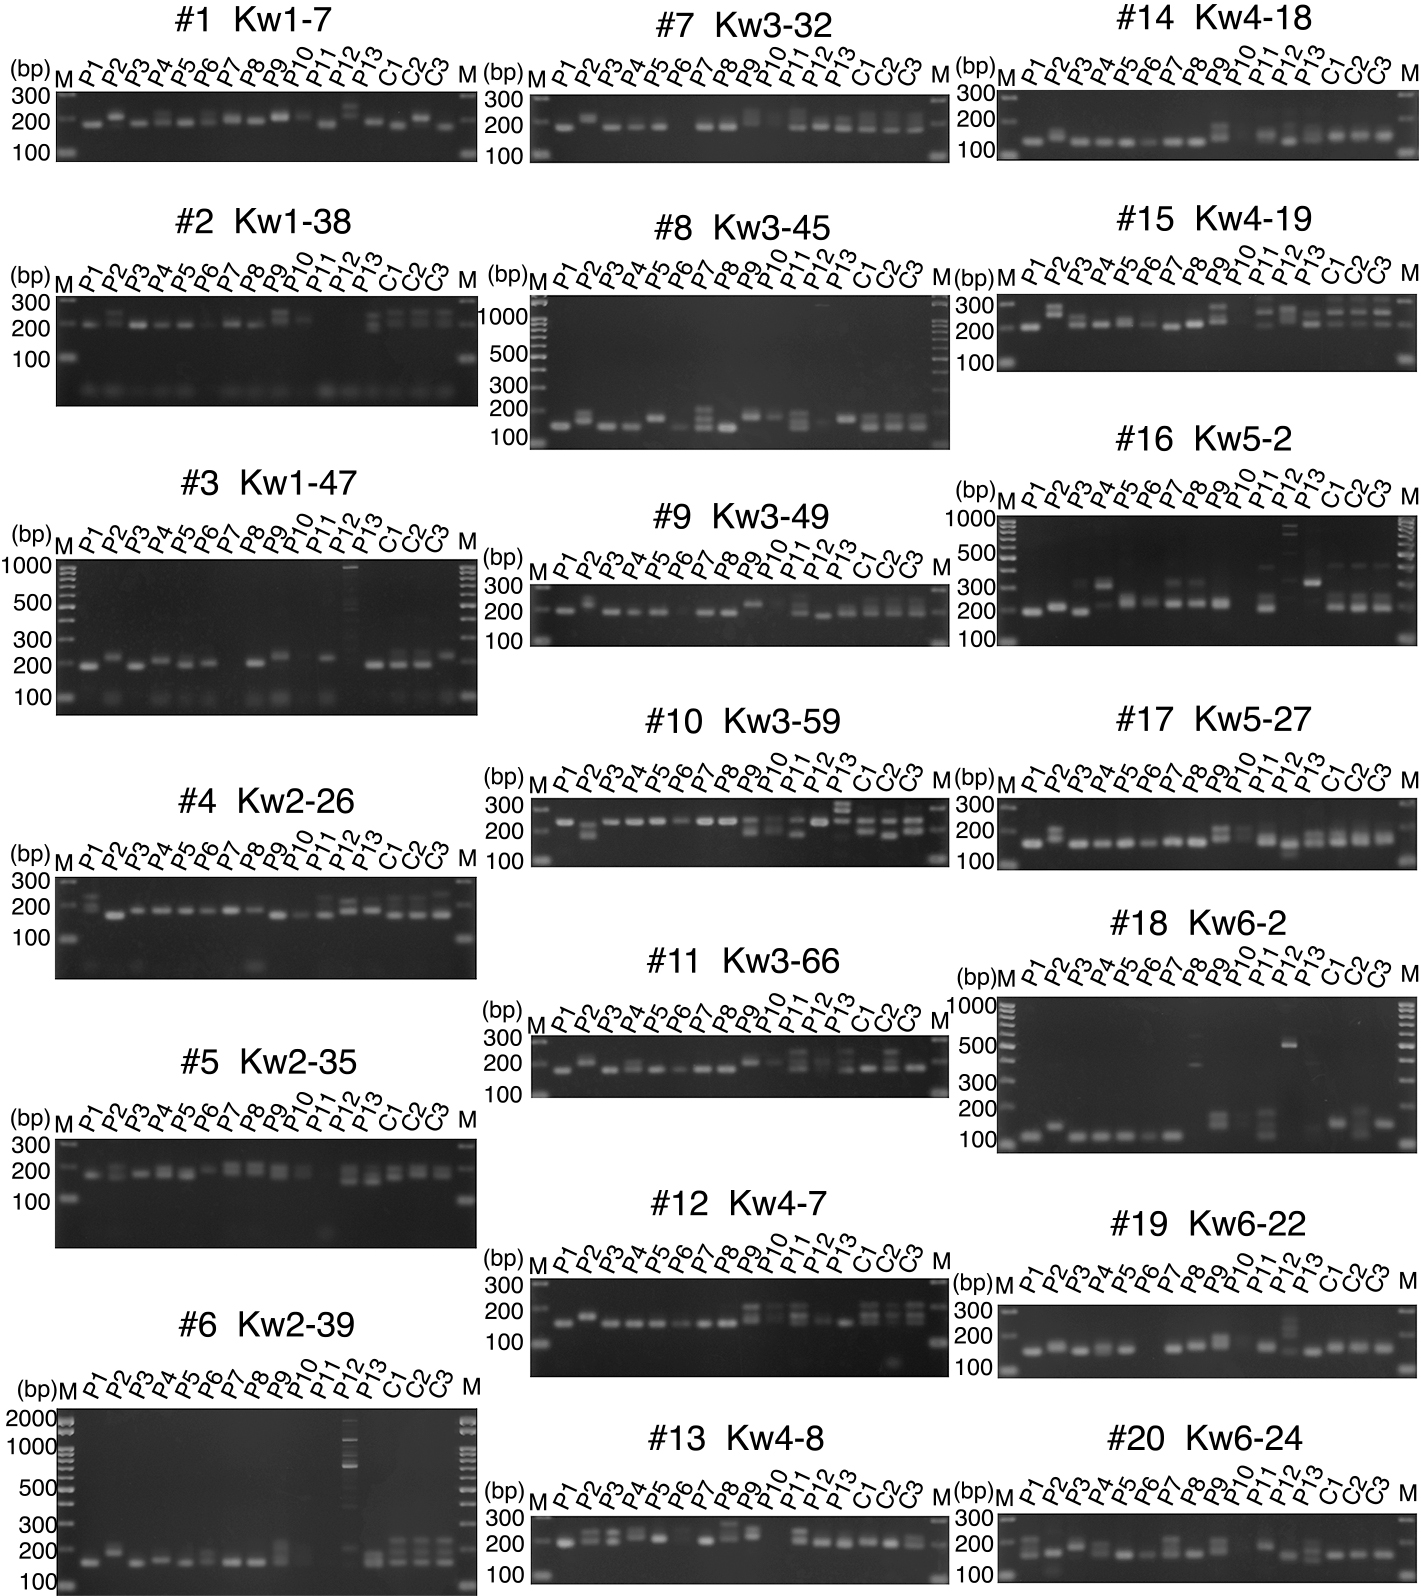
Following the design and synthesis of the PCR primers, we performed PCR amplification to examine DNA polymorphisms in A. rufa Fuchu and A. chinensis FCM1 for the 1,101 primer sets designed above. The presence of bands and polymorphisms among the tested lines was examined using electrophoresis (Supplemental Fig. S1; Supplemental Table S2). Among the 1,101 SSR regions, we found a total of 351 polymorphisms between A. rufa Fuchu and A. chinensis FCM1 (Fig. 2; Supplemental Fig. S1; Supplemental Table S1). We repeated the PCR analysis for these 351 regions to confirm the reproducibility of the results (Supplemental Fig. S2; Supplemental Table S2). As a result, SSR polymorphisms were found in 332 distinct regions genome-wide.
An average of 10 polymorphic sites were found per chromosome, which is sufficient for genetic analysis and DNA marker-assisted kiwifruit breeding. A total of 624 amplified SSR regions produced unique bands with no polymorphisms among the 1,101 tested PCR primer pairs. Only 40 markers produced multiple bands or no bands. Thus, 1,061 (96.3%) of the primers selected in this study were used to successfully design PCR markers in silico. These results indicate a relatively high polymorphism rate of 351/1101 (31.9%) for A. rufa and A. chinensis.
The methods used in this study can be applied to kiwifruit polymorphism analyses of other varieties. The kiwifruit genome contains 29 chromosomes; we designed approximately 30 SSR markers/chromosome for all 29 chromosomes, and they were further apart than 40 kb from each other (Table 2).
Next, we performed polymorphism analysis of 16 kiwifruit lines using 98 selected SSR markers with distinct polymorphic patterns between A. rufa Fuchu and A. chinensis FCM1 (Fig. 3; Supplemental Fig. S3; Supplemental Table S3). Among the 16 lines, seven A. rufa collection lines, P1 (Fuchu), P3 (Kochi), P4 (Ishigaki), P5 (Okinawa), P6 (Awaji), P7 (Ashizuri B), and P8 (Nakamura B), are closely related wild kiwifruit varieties from different areas of Japan (Table 1). P9 (Rainbow Red) and P10 (Kohi) are red-fleshed A. chinensis cultivars. P2, an A. chinensis FCM1, has been used as a pollen donor for several kiwifruit varieties. P12 (A. macrosperma) and P13 (A. callosa) are related species of genus Actinidia. We labeled the F1 progeny of A. rufa Fuchu and A. chinensis FCM1 as C-1, C-2, and C-3 (Table 1). Among the 98 selected markers, 45 could be used to distinguish between seven A. rufa collection lines: Fuchu, Kochi, Ishigaki, Okinawa, Awaji, Ashizuri B, and Nakamura B, with polymorphisms detected in 45.9% of the total (Table 1; Fig. 3; Supplemental Fig. S3; Supplemental Table S4).
We performed polymorphism analysis using the created 98 kiwifruit SSR markers and 16 strains and varieties (Fig. 3; Table 1; Supplemental Table S7). In addition, using the results of the polymorphism analysis, the affinity relationship was investigated by R in the free software (Fig. 4). The results suggested that A. rufa (Fuchu (P1), Kochi (P3), Ishigaki (P4), Okinawa (P5), Ashizuri B (P7), Nakamura B (P8)), a closely related wild species native to Japan, are diverse and widely distributed. The two A. chinensis (FCM1 (P2), Rainbow Red (P9)) used in the analysis were cultivars, but it was found that their genomic structures were different. C-1, C-2, C-3, P11 are the F1 progeny of A. rufa and A. chinensis. C-1, C-2, C-3, and P11 were well distributed between A. rufa and A. chinensis. P12 and P13 are Actinidia strains. These two strains were distributed at a distance from both A. rufa and A. chinesis. P6 and P10 were subjected to PCR and electrophoresis analysis in the same manner as the other samples, but were not included in the PCA analysis because many markers did not produce bands (Fig. 3).

A. rufa is a closely related species of kiwifruit that grows naturally in Japan, and could represent a useful genetic resource as it exhibits tolerance to several types of environmental stresses such as heat and excessive soil moisture (Kataoka et al., 2014). Because A. rufa has a cross-affinity with A. chinensis (Kataoka et al., 2014; Kim et al., 2007; Matsumoto et al., 2011), the development of genome-wide SSR markers in this study may be an important first step in breeding new kiwifruit varieties, with A. rufa as a parental line. Therefore, we next tried to locate Psa3-resistance loci using later generations of crosses between A. rufa Fuchu and A. chinensis FCM1; their progeny C-1, C-2, and C-3 were distinguished by 26 of the 98 selected markers (Fig. 3; Supplemental Fig. S3; Supplemental Table S3). These kiwifruit lines were tested for Psa3 resistance in previous studies, which found that A. rufa Fuchu, C-1, and C-3 were highly resistant to Psa3, whereas A. chinensis FCM1 and C-2 were not (Kisaki et al., 2018, 2019). The results of the present study revealed two SSR markers were associated with Psa3 disease-resistant phenotypes (Fig. 5). Graphical genotypes of these four markers were used to narrow the Psa-resistance candidate region to only four loci (Fig. 6; Supplemental Fig. S3).

Discussion
PCR amplification of SSR markers in silico
In this study, among 299,693 SSR regions detected in silico in a public kiwifruit genome database, we selected 1,101 SSR regions throughout the kiwifruit genome and designed corresponding PCR primers for experimental study. Using these 1,101 SSR regions, we successfully amplified a unique PCR band for each of 1,016 regions, which indicates the accuracy of the publicly available genome data and the applicability of the primer design software for precise extraction of SSR regions. Because the genetic relationships among these kiwifruit SSR regions have not yet been evaluated, it is important to verify the precise positions of the SSR region in each chromosome in the genome database. The average distance between tested SSR regions in this study was approximately 30 loci per chromosome, which is sufficient for genome-wide selection for DNA marker-assisted breeding of kiwifruit. Polymorphism analysis of A. rufa Fuchu, which is a wild species closely related to kiwifruit and which is native to Japan, and A. chinensis FCM1, showed that more than 330 SSR regions can be used for further genetic analysis (Supplemental Fig. S1; Supplemental Table S2), and these SSRs are present at sufficient density for DNA marker-assisted breeding. Excluding sites with no polymorphisms between A. rufa Fuchu and A. chinensis FCM1, 979 of the 1,101 SSR regions (88.9%) produced one to three bands after amplification for A. rufa Fuchu, whereas 998 (90.6%) produced one to three bands after amplification for A. chinensis FCM1. These results identified approximately 90% of the SSR markers generated in this study as potential PCR-ready SSR markers. This highly efficient PCR amplification result may have been obtained due to our adherence to the following steps during primer design: masking of non-unique areas, setting the allowable non-specific region ratio to ≤ 85%, and confirmation that a single product could be obtained by the PCR simulation program. These steps may be useful in future studies involving software-based in silico SSR marker creation using genome information for other crops and varieties.
Polymorphism rate of SSR markers in kiwifruit
Using the 1,101 SSR markers created in this study, we found that 332 PCR products exhibited SSR polymorphisms between A. rufa Fuchu and A. chinensis FCM1, for a polymorphism rate of 30.2% (Fig. 2; Supplemental Fig. S2; Supplemental Table S3). A. rufa, a close relative of Actinidia that grows wild in Japan, exhibits excellent heat and soil moisture resistance, and is attracting attention as a genetic resource for raising next-generation kiwifruit varieties (Kataoka et al., 2014).
We investigated polymorphisms among 16 Actinidia varieties, including A. rufa and A. chinensis and their progeny, using 98 selected markers. We found that 45 of the 98 markers (polymorphism rate: 45.9%) could distinguish between different varieties (Fig. 3; Supplemental Fig. S3; Supplemental Table S4). This high polymorphism rate despite the close relationship between A. rufa and A. chinensis is supported by their broad geographical distribution in Asia, which includes the Kinki, Shikoku, Ishigaki, and Okinawa islands, suggesting high genomic diversity (Kataoka et al., 2014; Kim et al., 2007; Matsumoto et al., 2011).
Kiwifruit PCA cluster analysis using SSR markers
We performed polymorphism analysis using the created 98 kiwifruit SSR markers and 16 strains and varieties (Fig. 3; Table 1; Supplemental Table S7). In addition, using the results of the polymorphism analysis, the affinity relationship was investigated by the R in the free software (Fig. 4). From these results, it was found that the A. rufa (Fuchu (P1), Kochi (P3), Ishigaki (P4), Okinawa (P5), Ashizuri B (P7), Nakamura B (P8)), A. chinensis (FCM1 (P2), Rainbow Red (P9)), hybrid progeny F1 (C-1, C-2, C-3, P11) and Actinidia (P12 and P13) strains can be correctly classified using the SSR markers of the kiwifruit created in this study. In addition, it was confirmed that each A. rufa, A. chinensis, and crossed progeny F1 group can be classified. It is expected that the SSR markers created in this study can be used for identifying kiwifruit varieties, selecting markers when growing varieties, and analyzing the classification of kiwifruit.
Comparison with NGS-based DNA markers
The kiwifruit SSR markers created in this study are simple DNA markers that require only PCR and electrophoresis analytical methods, without any need for expensive laboratory equipment. Due to recent advances in NGS and other data analysis technologies, genotyping-by-sequencing (GBS) analytical techniques such as restriction site-associated DNA sequencing (RAD-Seq) (Baird et al., 2008) and direct genotyping by random amplicon sequencing (GRAS-Di) (Miki et al., 2020) can be applied to obtain vast amounts of genomic and polymorphic information on various crop varieties quickly and easily. However, applying NGS analysis in DNA marker-assisted breeding at the test site level has several problems. First, when selecting progeny through crossing, it is necessary to discriminate the heterozygous conditions of certain loci, which cannot be performed easily using NGS data. To solve this problem, heterogeneous data can be inferred by examining raw data; however, this method is unreliable at genome decoding depths of approximately × 30, which is the current standard for NGS analysis. In contrast, SSR markers can be used to estimate heterozygous genotypes easily and correctly. Because the parent varieties of kiwifruit are not fixed and are unlikely to exhibit heterogeneity, phenotypes are separated in the progeny generation through crossing. We obtained a large number of polymorphic SSR markers that could be used to detect heterozygosity (26 of 98, polymorphism rate: 26.5%), which indicates the usefulness of SSR markers in the breeding selection of next-generation varieties. Second, it is difficult to apply NGS data directly for cultivar identification at the field level and for breeding selection. The SSR markers created in this study do not require the highly specialized equipment characteristic of NGS analysis. Third, NGS analysis provides vast amounts of genomic data but requires approximately 1 month for data delivery. Decoding the representative reference varieties is important as basic research, but it is difficult to perform NGS analysis for all progeny crosses due to the high cost. GBS technologies such as RAD-Seq and GRAS-Di are better suited to these tasks, and the SSR markers selected in this study do not require specialized techniques or equipment. Furthermore, by applying PCR and electrophoresis, as in this experiment, it is possible to easily identify varieties at a low cost. Finally, the SSR markers created in this project were not only designed by a database, but also confirmed by real PCR experiments, so users can expect reproducibility.
Future prospects
Normally, it would take more than a decade to develop disease-resistant kiwifruit varieties through cross-breeding and evaluating resistance to disease-causing pathogens in the progeny. However, Kagawa University and Kagawa Prefecture have collaborated to evaluate the natural resistance of existing varieties to diseases, such as that caused by Psa3, since their first appearance in Japan in 2014 (Kisaki et al., 2018, 2019). A preliminary study suggested that A. rufa, which has been used to breed Sanuki Kiwicco varieties, is resistant to the highly damaging pathogen Psa3 and that crosses with this variety may confer resistance to this pathogen in future generations (Kisaki et al., 2018, 2019). We propose two candidate loci for this purpose (Fig. 6; Supplemental Fig. S4; Supplemental Table S5). It is of note that there were as many loci considered heterozygous as expected. Loci linked to Psa3 resistance behave differently since genetic segregations of Psa3 resistance were observed among the progeny. Thus, using SSR markers, which can distinguish the heterozygous condition precisely, we have succeeded in narrowing down the candidate regions to two loci in this study. These results demonstrate the usefulness of the selected SSR markers for future breeding of new kiwifruit cultivars, as both parent cultivars may be heterozygous and the markers can distinguish these complex segregations. Future mapping of more resistant and susceptible lines will allow more precise localization of the Psa3-resistance locus.
Literature Cited
- Akagi, T., I. M. Henry, H. Ohtani, T. Morimoto, K. Beppu, I. Kataoka and R. Tao. 2018. A Y-encoded suppressor of feminization arose via lineage-specific duplication of cytokinin response regulator in kiwifruit. Plant Cell 30: 780–795.
- Akagi, T., S. M. Pilkington, E. Varkonyi-Gasic, I. M. Henry, S. S. Sugano, M. Sonoda, A. Firl, M. A. McNeilage, M. J. Douglas, T. Wang, R. Rebstock, C. Voogd, P. Datson, A. C. Allan, K. Beppu, I. Kataoka and R. Tao. 2019. Two Y-chromosome-encoded genes determine sex in kiwifruit. Nat. Plants 5: 801–809.
- Baird, N. A., P. D. Etter, T. S. Atwood, M. C. Currey, A. L. Shiver, Z. A. Lewis, E. U. Selker, W. A. Cresko and E. A. Johnson. 2008. Rapid SNP discovery and genetic mapping using sequenced RAD markers. PLoS ONE 3: e3376. DOI: 10.1371/journal.pone.0003376.
- Beier, S., T. Thiel, T. Münch, U. Scholz and M. Mascher. 2017. MISA-web: A web server for microsatellite prediction. Bioinformatics 33: 2583–2585.
- Guichoux, E., L. Lagache, S. Wagner, P. Chaumeil, P. Leger, O. Lepais, C. Lepoittevin, T. Malausa, E. Revardel, F. Salin and R. J. Petit. 2011. Current trends in microsatellite genotyping. Mol. Eco. Res. 11: 591–611.
- Huang, S., J. Ding, D. Deng, W. Tang, H. Sun, D. Liu, L. Zhang, X. Niu, X. Zhang, M. Meng, J. Yu, J. Liu, Y. Han, W. Shi, D. Zhang, S. Cao, Z. Wei, Y. Cui, Y. Xia, H. Zeng, K. Bao, L. Lin, Y. Min, H. Zhang, M. Miao, X. Tang, Y. Zhu, Y. Sui, G. Li, H. Sun, J. Yue, J. Sun, F. Liu, L. Zhou, L. Lei, X. Zheng, M. Liu, L. Huang, J. Song, C. Xu, J. Li, K. Ye, S. Zhong, BR. Lu, G. He, F. Xiao, H.-L. Wang, H. Zheng, Z. Fei and Y. Liu. 2013. Draft genome of the kiwifruit Actinidia chinensis. Nat. Commun. 4: 2640. DOI: 10.1038/ncomms3640.
- Kataoka, I., H. Matsumoto, A. Kawano, K. Beppu, M. Ohtani and K. Suezawa. 2014. Selection of low-chill kiwifruit adapting to warm climate by utilizing Actinidia rufa native to southwestern part of Japan. Acta Hortic. 1059: 85–88.
- Kim, J. G., T. Mizugami, K. Beppu, I. Kataoka and T. Fukuda. 2007. Fruit characteristics of shima sarunashi (Actinidia rufa Planch.), a unique resource of Actinidia native in Japan. Acta Hortic. 753: 73–78.
- Kisaki, G., T. Shimagami, K. Matsudaira, Y. Tsugi, K. Moriguchi, K. Nakashima, T. Morimoto, S. Sugita-Konishi, M. Tabuchi, K. Gomi, K. Ichimura, K. Hamano, K. Suezawa, M. Otani, T. Fukuda, T. Manabe, I. Kataoka and K. Akimitsu. 2019. A kiwifruit cultivar crossbred with Actinidia chinensis and Actinide rufa has practical tolerance to Pseudomonas syringae pv. actinidiae biovar 3. J. Plant Pathol. 101: 1211–1214.
- Kisaki, G., K. Suezawa, M. Otani, T. Fukuda, T. Manabe, K. Hamano, S. Tanaka, A. Ishihara, C. Igarashi, T. Morimoto, A. Endo, S. Sugita-Konishi, M. Tabuchi, K. Gomi, K. Ichimura, T. Fujimura, I. Kataoka and K. Akimitsu. 2018. Evaluation of various cultivars of Actinidia species and breeding source Actinidia rufa for resistance to Pseudomonas syringae pv. actinidiae biovar 3. J. Gen. Plant Pathol. 84: 399–406.
- Li, H., D. Li, A. Chen, H. Tang, J. Li and S. Huang. 2016. Characterization of the Kenaf (Hibiscus cannabinus) global transcriptome using Illumina paired-end sequencing and development of EST–SSR markers. PLoS ONE 11: 0150548. DOI: 10.1371/journal.pone.0150548.
- Li, J., X. Li and D. Soejarto. 2007. Actinidiaceae. p. 334–360. In: Z. Y. Wu, P. H. Raven and D. Y. Hong (eds.). Flora of China. Science Press, Beijing.
- Linsley-Noakes, G. C. 1984. Effects of winter temperatures on flower development in two clones of kiwifruit (Actinidia deliciosa (A. Chev.) C.F. Liang et A.R. Ferguson). Sci. Hortic. 33: 249–260.
- Liu, L., S. Zhang and C. Lian. 2015. De novo transcriptome sequencing analysis of cDNA library and large-scale unigene assembly in Japanese red pine (Pinus densiflora). Int. J. Mol. Sci. 16: 29047–29059.
- Matsumoto, H., T. Seino, K. Beppu and I. Kataoka. 2011. Characteristics of interspecific hybrids between A. chinensis kiwifruit and A. rufa native to Japan. Acta Hortic. 913: 191–196.
- Mertten, D., G. K. Tsang, K. I. Manako, M. A. McNeilage and P. M. Datson. 2012. Meiotic chromosome pairing in Actinidia chinensis var. deliciosa. Genetica 140: 455–462.
- Miki, Y., K. Yoshida, H. Enoki, S. Komura, K. Suzuki, M. Inamori, R. Nishijima and S. Takumi. 2020. GRAS-Di system facilitates high-density genetic map construction and QTL identification in recombinant inbred lines of the wheat progenitor Aegilops tauschii. Sci. Rep. 10: 21455. DOI: 10.1038/s41598-020-78589-4.
- Qu, J. and J. Liu. 2013. A genome-wide analysis of simple sequence repeats in maize and the development of polymorphism markers from next-generation sequence data. BMC Res. Notes 6: 403. DOI: 10.1186/1756-0500-6-403.
- Sablok, G., G. V. P. Raju, S. B. Mudunuri, R. Prabha, D. P. Singh, V. Baev, G. Yahubyan, P. J. Ralph and N. La Porta. 2015. ChloroMitoSSRDB 2.00: More genomes, more repeats, unifying SSRs search patterns and on-the-fly repeat detection. Database 2015: 1–10.
- Tang, P., Q. Zhang and X. Yao. 2017. Comparative transcript profiling explores differentially expressed genes associated with sexual phenotype in kiwifruit. PLoS ONE 12: e0180542. DOI: 10.1371/journal.pone.0180542.
- Wu, H., T. Ma, M. Kang, F. Ai, J. Zhang, G. Dong and J. Liu. 2019. A high-quality Actinidia chinensis (kiwifruit) genome. Hortic. Res. 6: 117. DOI: 10.1038/s41438-019-0202-y.
- Yamamoto, T. and K. Hayashi. 2001. Department of Breeding, Fruit Tree Experiment Station, Ministry of Agriculture, Forestry and Fisheries plant genome research protocol: Latest genome information and its application, mapping of peaches, extraction of genomic DNA. Shujunsha Cell Engineering Supplement, Plant Cell Engineering Series 14: 221–227.
- Yano, M. and M. Matsuoka. 2004. What can we learn from rice genome sequencing, for research goals and strategy formulation. National Institute for Agrobiological Sciences, Japan.
- Yonezawa, K., Y. Mukai and K. Fukui. 1997. New Agricultural Science Series: Plant Genetics and Breeding. Asakura Shoten.
- Yue, J., J. Liu, W. Tang, Y. Q. Wu, X. Tang, W. Li, Y. Yang, L. Wang, S. Huang, C. Fang, K. Zhao, Z. Fei, Y. Liu and Y. Zheng. 2020. Kiwifruit Genome Database (KGD): A comprehensive resource for kiwifruit genomics. Hortic. Res. 7: 117. DOI: 10.1038/s41438-020-0338-9.