Introduction
Pineapples are consumed as fresh fruit and processed products, such as canned slices, chilled fresh-cut chunks, and juice (Ogata et al., 2016). Pineapple quality requirements vary by use (Nakatoh et al., 1985) with acidity an important indicator in shipping fresh pineapples (Takeuchi, 2022). Therefore, improving fruit-quality predictions will benefit marketers who trade in the fresh and processed fruit.
Pineapple fruit are harvested each month owing to floral induction with ethephon and other factors, and eating quality varies by season. Seasonal changes in acid and soluble solid content are reported for pineapple fruit harvested in Japan (Degi et al., 1997; Higa et al., 1985; Irei et al., 2018; Kawamitsu et al., 1995; Nakatoh et al., 1985) and in Thailand (Joomwong, 2006). However, these reports only cover partial intra-annual periods, with no long-term reports of quality variations throughout the year. Acid and soluble solid contents of pineapple clearly vary with temperature, yet the precise temperature dependencies, such as the period affected by temperature and optimum temperature, are unknown.
Japan is at the northern limit for the economic cultivation of pineapples (Ogata et al., 2016) and has a large temperature difference between summer and winter due to its high latitude relative to other production areas. Therefore, analysis of Japanese cultivation records may reveal the complex relationship between acid and soluble solid contents and temperature.
The objective of this study was to collect a large number of acid and soluble solid content records throughout the year in Japan’s main production area (Nago), as well as in two warmer production areas, to determine differences in eating quality by season and region. To investigate the relationship between acid and soluble solid content and temperature, we identified the period during which the acid and soluble solid content at harvest is affected by climatic conditions, then quantified the relationship between acid and soluble solid content and climatic factors.
Materials and Methods
Plant materials and measurements
The pineapple fruit cultivars ‘Soft Touch’, ‘N67-10’, ‘Bogor’, and ‘Okinou P17’ harvested during the 2005–2019 period at experimental fields at Okinawa Prefectural Agricultural Research Center in Nago (26.6°N, 128.0°E), Ishigaki (24.4°N, 124.2°E; located about 450 km southwest of Nago), and Miyakojima (24.8°N, 125.3°E; located about 330 km southwest of Nago), were investigated. These fields were not irrigated. ‘N67-10’ is a vegetative selection from the ‘Hawaiian Smooth Cayenne’ cultivar, and the others are bred from artificial hybridizations (Ogata et al., 2016; Shoda et al., 2012). ‘Soft Touch’, ‘N67-10’, and ‘Bogor’ are the top three most produced cultivars in Japan (Ministry of Agriculture, Forestry and Fisheries, https://www.maff.go.jp/j/tokei/kouhyou/tokusan_kazyu/index.html, October 12, 2022). ‘Okinou P17’ is a new cultivar released in 2015, with several favorable characteristics, including excellent eating quality (Ogata et al., 2016).
Pineapples were planted between March and October, and 25 mL of a mixture of 0.1% ethephon and 4% urea was applied to each plant between April and November of the year following planting. However, most plants planted between August and October were excluded, and the mixture was not applied to these plants. Harvesting was conducted between September after one year of planting and August after two years of planting.
The harvest date was selected based on peel color (percentage of the peel surface that turned yellow). As pineapple peel accumulates more carotenoids in winter than in summer (Joomwong, 2006), the peel color at the time of flesh ripening varies with the season (Onaha, 1984). In accordance with the harvest criteria of the Okinawa Prefecture Fruit Tree Cultivation Guidelines (Okinawa Prefecture, 2019), the fruit of ‘N67-10’ was harvested when the peel color ranged from 20% (June to August) to 80% (December to March). In the present study, fruits were harvested when the peel color ranged from 20% to 90% for ‘Soft Touch’ and from 10% to 80% for ‘Bogor’ and ‘Okinou P17’. Other cultivation conditions, including soil management, were followed as per prefectural guidelines.
Only the first fruit harvested after planting for each plant was used for acid and soluble solid content measurements. Harvested fruits were cut lengthwise into quarters, and after squeezing to obtain the juice, the acid and soluble solid contents were measured using an acid-soluble solid content analyzer (NH-1000 or NH-2000; HORIBA, Kyoto, Japan). The devices measure acid content (citric acid equivalent) in juice using an electrical conductivity meter and the soluble solid content with a refractometer (Yamada, 2000). More than 2,000 fruit data points were obtained for each cultivar in the three regions combined, and more than 5,000 fruits were measured for ‘Soft Touch’ (Table 1). More than 75% of the data is from Nago, where data were available for all months except February for ‘Okinou P17’. No winter data from Ishigaki were available for ‘N67-10’ and ‘Okinou P17’. Data from Miyakojima were only available in the spring and summer.
Climate data and statistical analysis
The daily mean temperatures in the Agro-Meteorological Grid Square Data (Ohno et al., 2016) were used as daily mean temperatures for the three experimental fields. The climate dataset has a 1 km resolution (each grid cell measures 45" longitude × 30" latitude).
The prediction accuracy of the regression equation was evaluated using the contribution rate (R2) and root mean square error (RMSE). RMSE was calculated as follows:
where
n is the number of data points used in the calculation,
ye is the estimated acid content (%) or soluble solid content (°Brix) obtained from the regression equation, and
ym is the measured acid or soluble solid content in the experimental fields.
All calculations were performed using Excel for Microsoft 365, and coefficients and R2 for single or multiple regression equations were calculated using the “Linest function” in Excel.
Results and Discussion
Seasonal changes in fruit quality
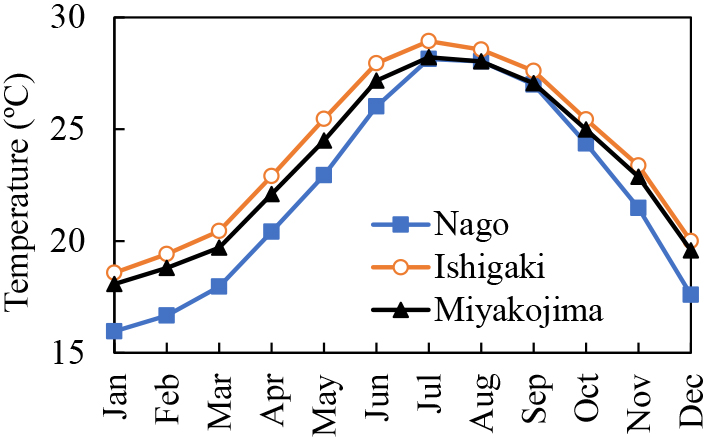
Figure 1 shows the monthly mean temperatures of the three experimental fields. Nago, located at a higher latitude than Ishigaki and Miyakojima, had lower winter–spring temperatures and a larger annual temperature range.
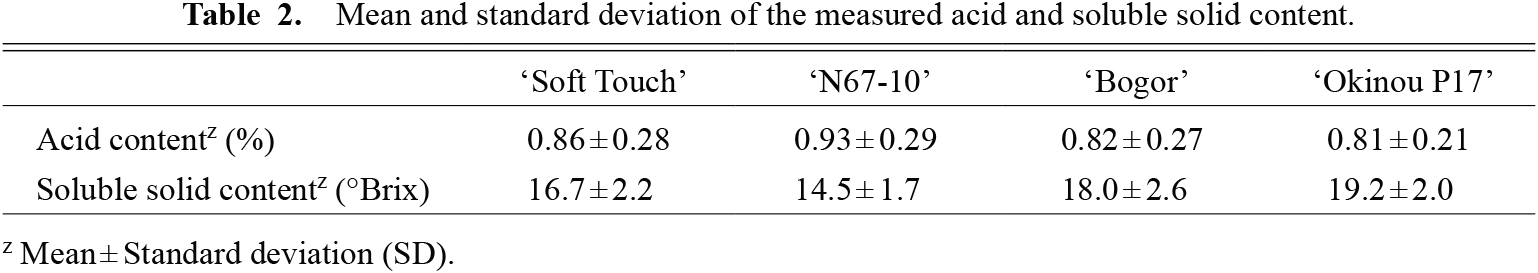
Table 2 shows the mean and standard deviation (SD) of each cultivar’s measured acid and soluble solid content. The mean acid content was approximately 0.8–0.9%, with a higher value for ‘N67-10’ than the other cultivars. The mean soluble solid content was approximately 14–19 °Brix, with a high value for ‘Okinou P17’ and a low value for ‘N67-10’.
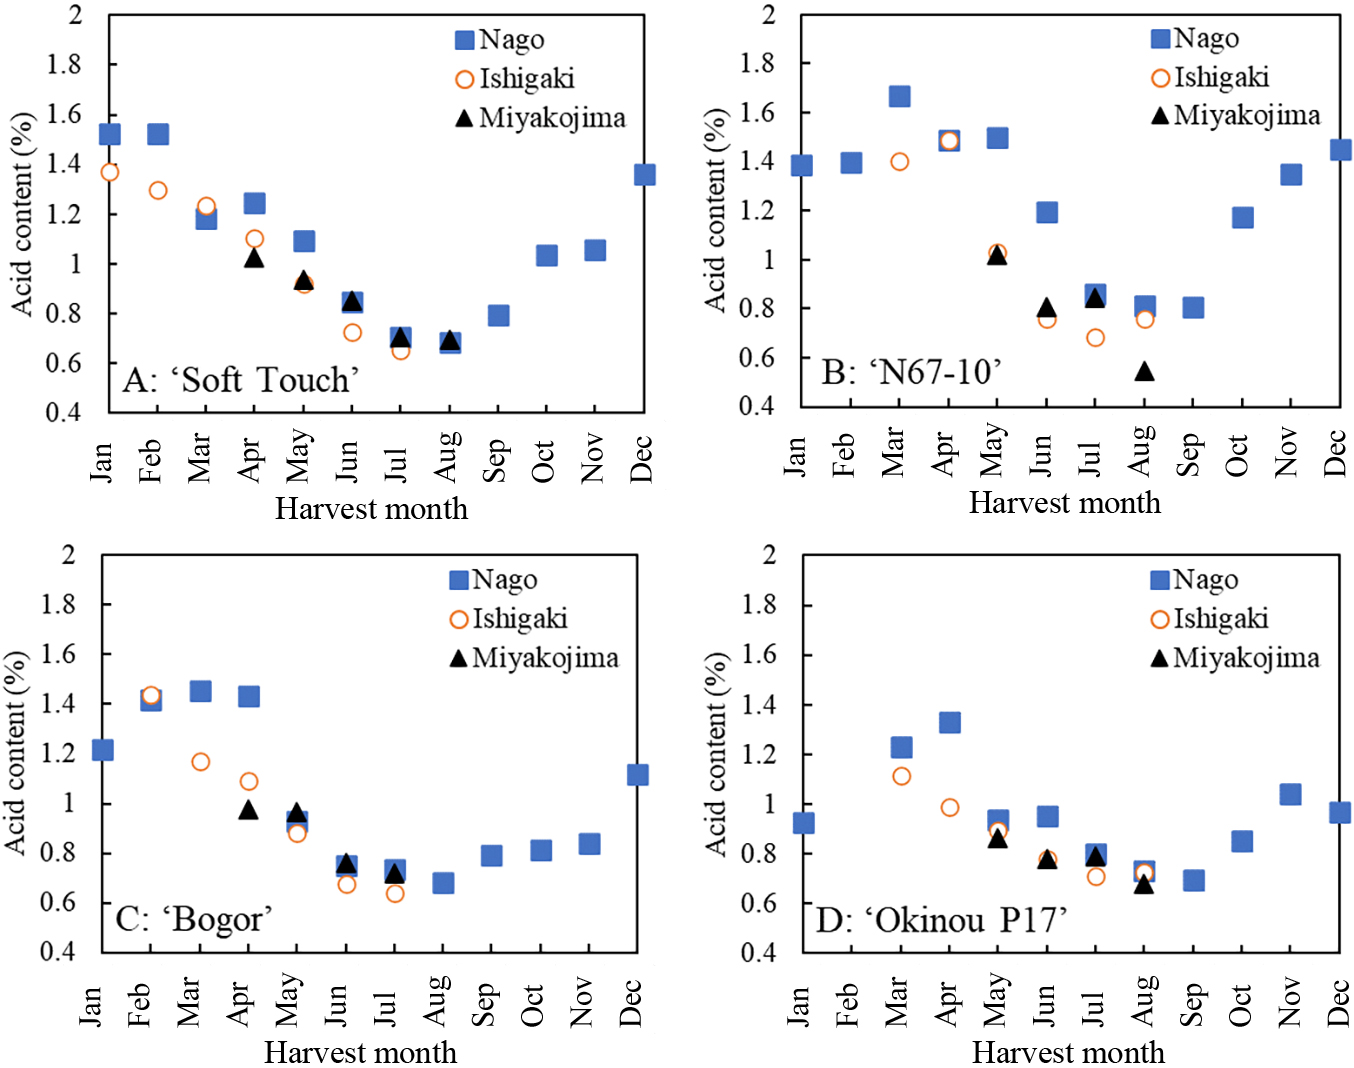
The monthly mean acid content was low from June to September and high from December to April, regardless of the cultivar or region (Fig. 2). The difference between winter and summer for ‘Okinou P17’ was smaller than that of the other cultivars. The acid contents in winter and spring in Nago were higher than those in Ishigaki. Previous research reported lower acid content in summer and higher in winter and spring in Japan (Degi et al., 1997; Higa et al., 1985; Irei et al., 2018; Kawamitsu et al., 1995; Nakatoh et al., 1985) and Thailand (Joomwong, 2006), corroborating the present results. This suggests that seasonal and regional temperature differences at harvest directly relate to fruit acid content.
Previous research (Degi et al., 1997; Higa et al., 1985; Irei et al., 2018; Kawamitsu et al., 1995; Nakatoh et al., 1985) on seasonal changes in soluble solid content in Japan were inconsistent due to the short survey periods used. The present study demonstrated higher soluble solid content for ‘Soft Touch’, ‘N67-10’, and ‘Bogor’ in June, while in September to March it was lower (Fig. 3). Although the soluble solid content of ‘Okinou P17’ was lower in March, there were no obvious differences between May and January. ‘Okinou P17’ tended towards higher soluble solid content and lower acid content than the other cultivars, with smaller seasonal changes in soluble solid and acid content.
Relationship between acid content and temperature
The acids in pineapple fruit are primarily citric and malic acids, which accumulate with fruit growth, then rapidly decrease over a short period immediately before harvest (Singleton and Gortner, 1965). The acids in pineapples are consumed as a metabolite for respiration (Dorey et al., 2016), and the acid content at harvest is lower when the respiration rate increases at high temperatures (Joomwong, 2006; Nakatoh et al., 1985).
Similarly, for grapes whose acid content decreases before harvest, higher temperatures during the decreasing acid period leads to an even lower acid content at harvest (Barnuud et al., 2014; Yamane and Shibayama, 2006). Models are developed to predict grape acid content at harvest using the negative correlation with temperature evaluated for an approximately 40-day period before harvest (Sugiura et al., 2020). Therefore, we assumed that the acid content of pineapple at harvest correlates with pre-harvest temperatures and can be approximated using the following regression equation:
where
ya (%) is the acid content at harvest,
tn (°C) is the mean temperature over the
N days before the harvest date; a
n and b
n are coefficients of the regression equation.
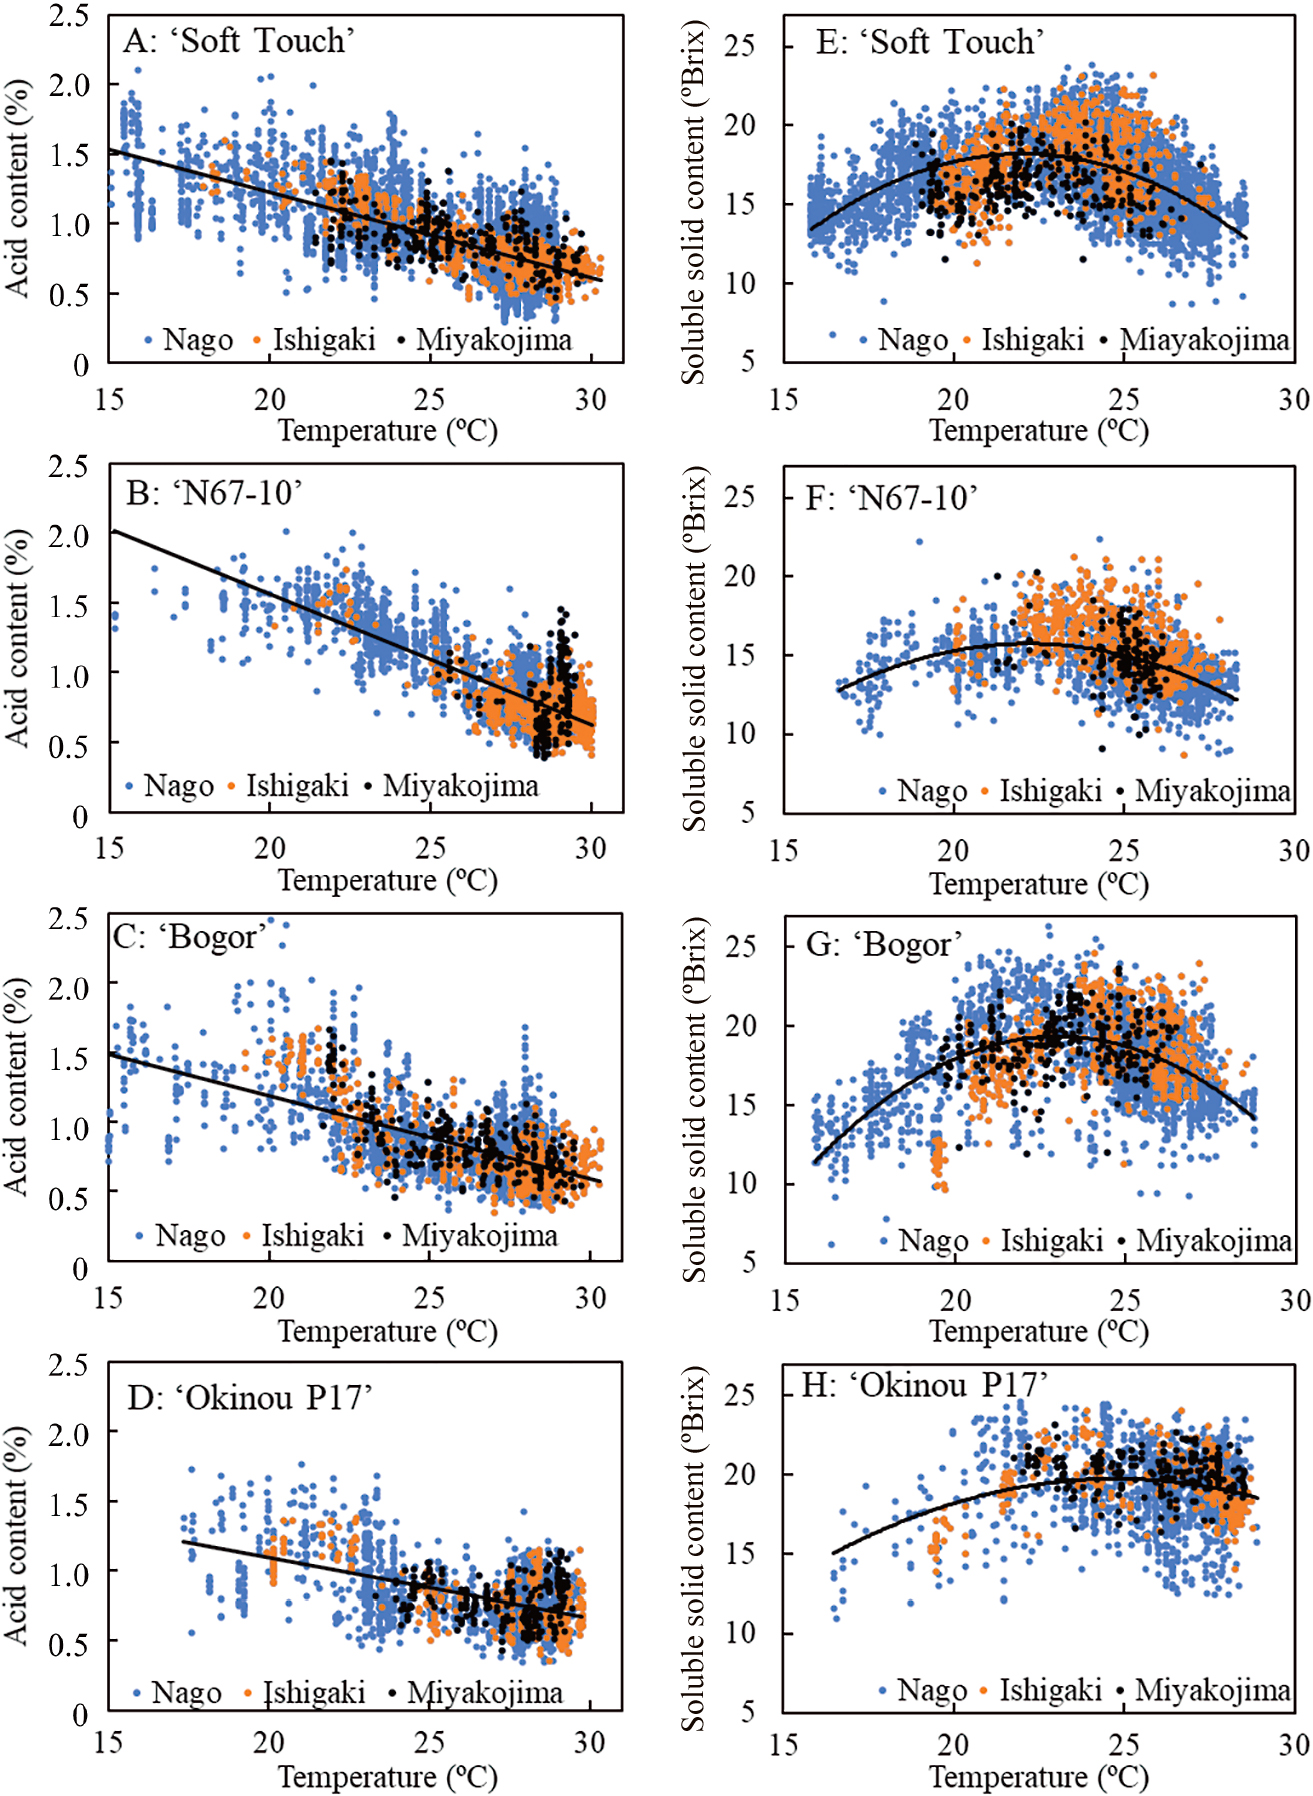
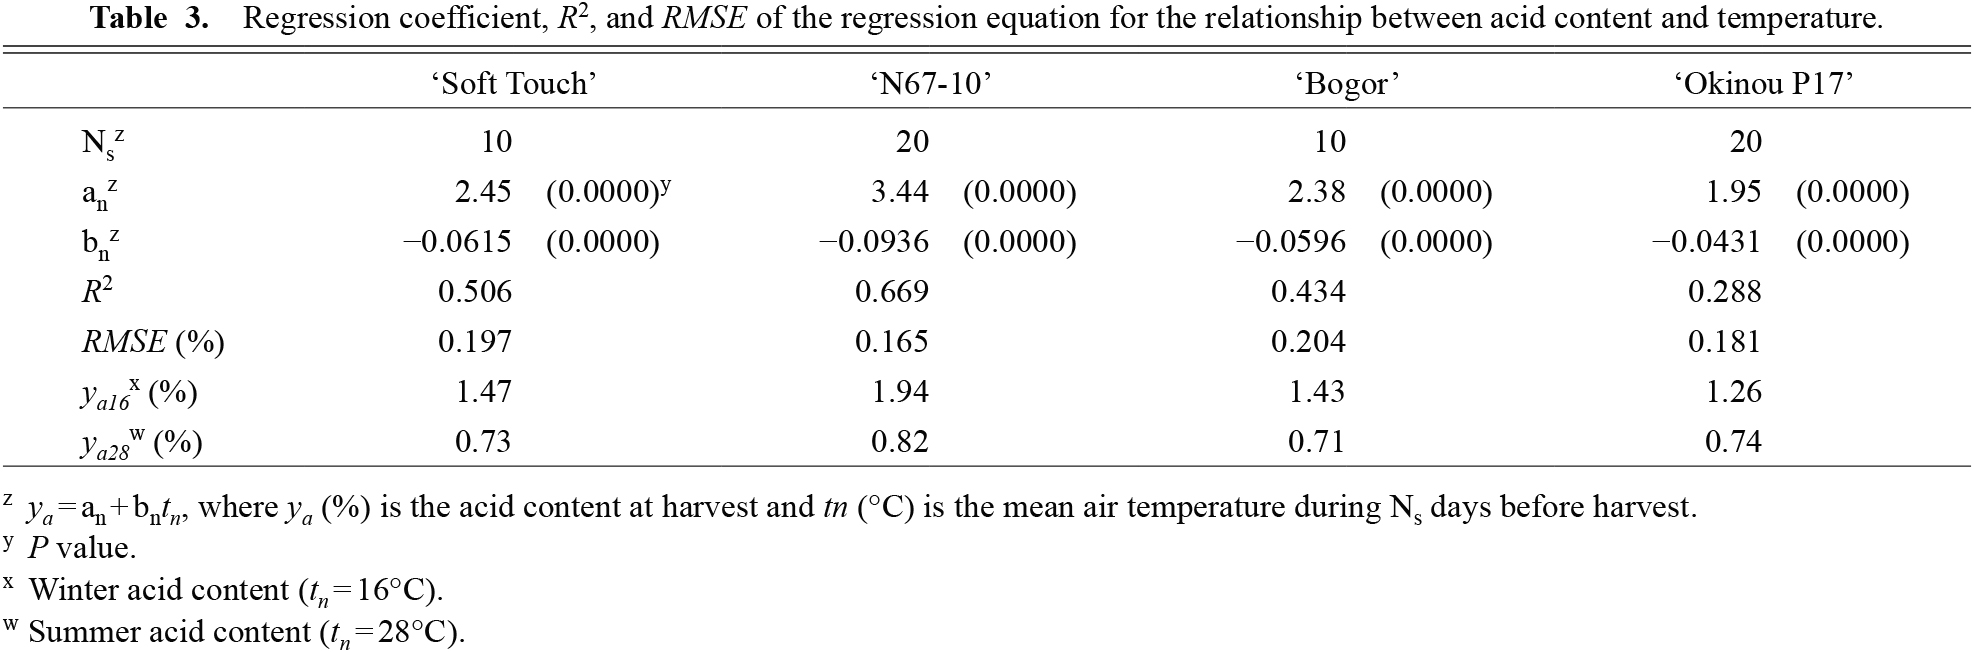
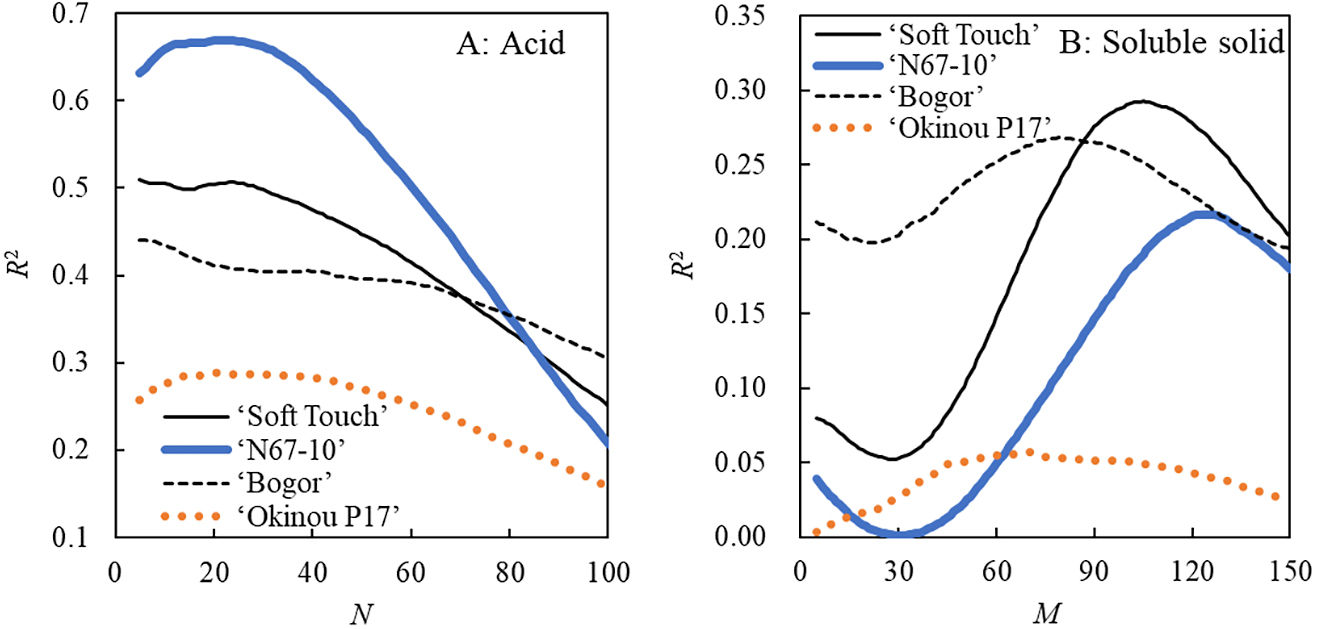
The R2 of Equation (2) was obtained when N varied in the range of 5–100 (Fig. 4A). Data for Nago, Ishigaki, and Miyakojima are included in the calculations. The R2 values of ‘Soft Touch’ and ‘Bogor’ were highest when N was up to 10. The R2 of ‘N67-10’ and ‘Okinou P17’ were highest when N was around 20. Therefore, the period of high sensitivity to temperature (Ns) is assumed to be the 10-day period before harvest for ‘Soft Touch’ and ‘Bogor’, and the 20-day period before harvest for ‘N67-10’ and ‘Okinou P17’. The relationship between mean temperature over Ns days before harvest and acid content at harvest is shown (Fig. 5A–D). The higher the temperature, the lower the acid content; this relationship did not remarkably differ region-wise. Ns was limited to a short period before harvest (10 or 20 days before harvest), possibly due to the short period of acid decrease before harvest (Singleton and Gortner, 1965).
The coefficients an and bn in Equation (2), R2, and RMSE were calculated when N = Ns (Table 3). All coefficients were significant (P < 0.001). The RMSE ranged from 0.17–0.20% and was less than the SD for all acid contents (Table 2), suggesting that Equation (2) can serve to predict acid content based on temperature data. The coefficients in Table 3 were used to estimate the acid content in winter and summer by substituting 16°C and 28°C (the monthly mean temperature in Nago in January and August, respectively) for tn. Cultivar acid content differences in winter were larger than those in summer, and acidity in winter was higher in ‘N67-10’ and lower in ‘Okinou P17’.
The R2 of ‘N67-10’ was as high as 0.67, while the R2 of ‘Okinou P17’ was as low as 0.29, likely because the acid content of ‘N67-10’ is highly temperature-dependent, while that of ‘Okinou P17’ is stable regardless of temperature.
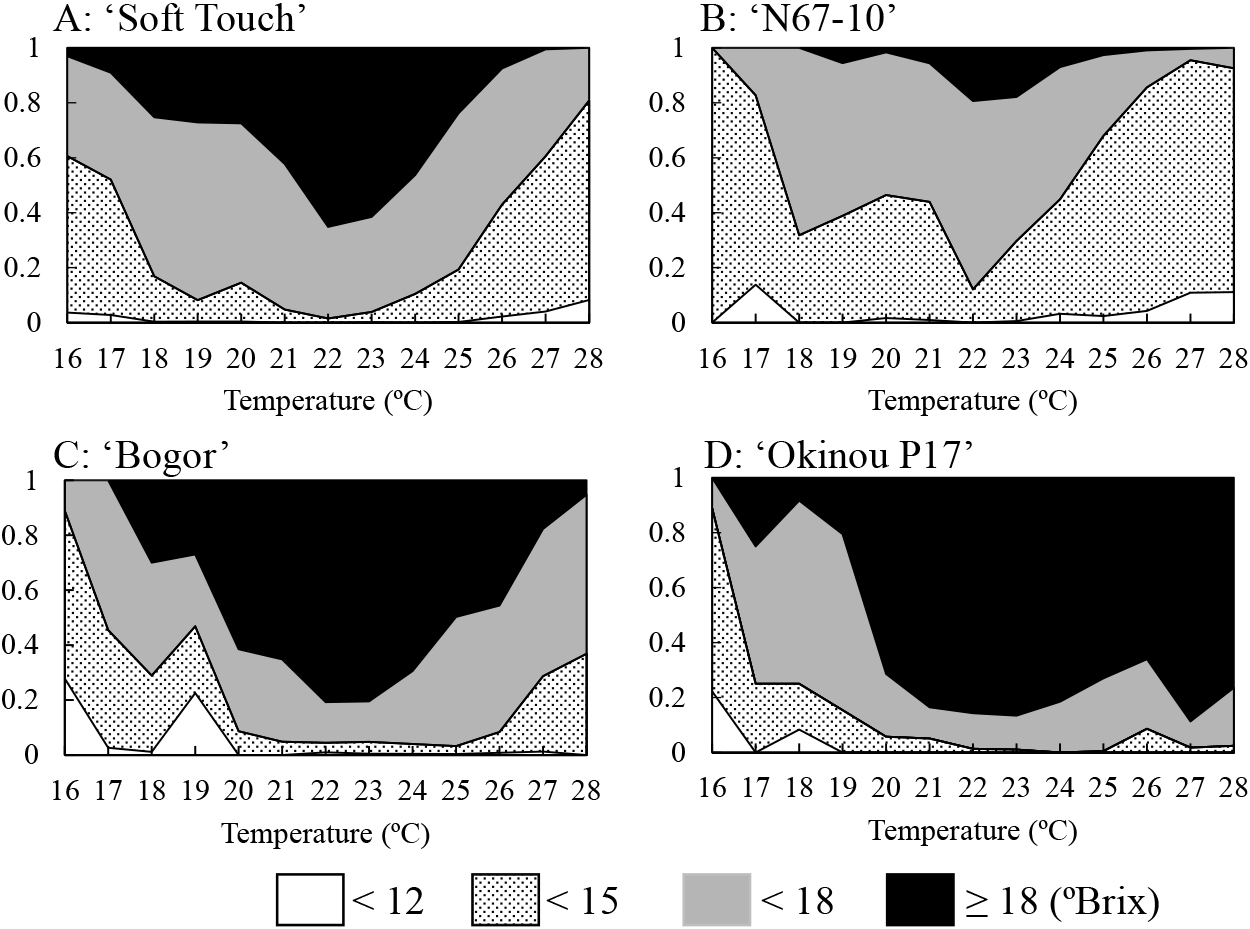
Figure 6 shows the relationship between mean temperature for the Ns-day period before harvests and acid content distribution. Acidity distribution was expressed as a ratio based on the number of whole fruits. The ratio was determined every 1°C. The temperature at which more than 80% of the fruits had acid an content of ≤ 1% was ≥ 24°C for ‘Okinou P17’, ≥ 25°C for ‘Bogor’ and ‘Soft Touch’, and ≥ 27°C for ‘N67-10’.
Relationship between soluble solid content and temperature
The main soluble solids in pineapple fruit are sucrose, glucose, and fructose, with the total soluble solids accumulating throughout the fruit growth period (Singleton and Gortner, 1965; Zhang et al., 2011). In the fruit of many species, sugar results from photosynthates synthesized in the leaves and other plant parts, which are translocated and stored in the fruit vacuoles (Kanayama and Yamaki, 1993). Therefore, the soluble solid content of fruit is expected to relate to photosynthesis during fruit development.
The pineapple, a CAM plant, has a photosynthetic rate that strongly depends on temperature (Lin et al., 2006; Zhu et al., 1999). Neales et al. (1980) reported the highest photosynthetic rate for day temperatures of 25°C and night temperatures of 15–20°C, with decreases when the temperature falls outside these optimum values. Therefore, we hypothesized that pineapple soluble solid content at harvest may be approximated using a quadratic equation with the pre-harvest temperature as a variable:
where
ys (°Brix) is the soluble solid content at harvest,
tm (°C) is the mean temperature over the
M days before harvest, with a
m, b
m, and c
m as coefficients. When Equation (3) is regarded as a multiple regression equation with
tm and
tm2 as explanatory variables,
R2 can be obtained using Excel (Linest function).
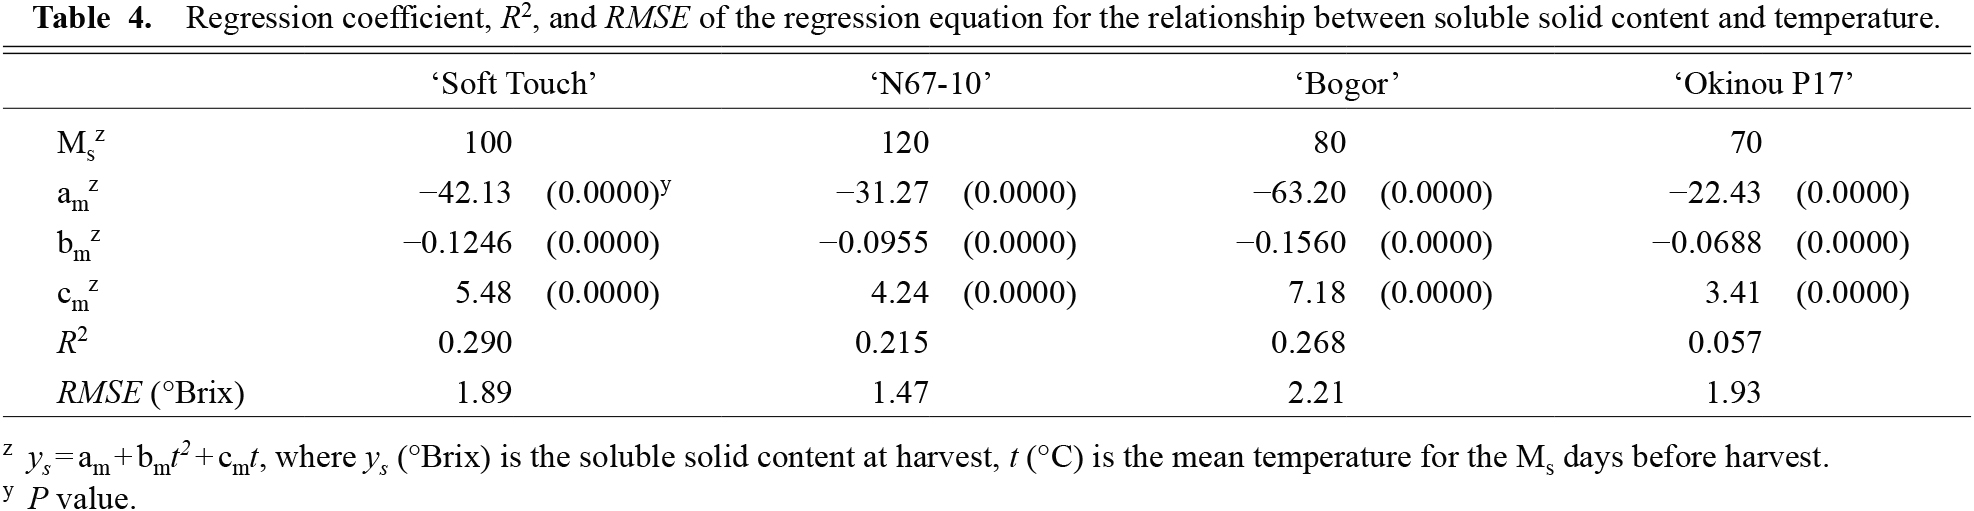
R2 in Equation (3) was obtained for values of M between 5–150 days (Fig. 4B). R2 was highest for ‘Soft Touch’, ‘N67-10’, and ‘Bogor’ when M was approximately 100, 120, and 80, respectively. The R2 for ‘Okinou P17’ was low with an undefined peak, but it did reach a maximum when M was approximately 70.
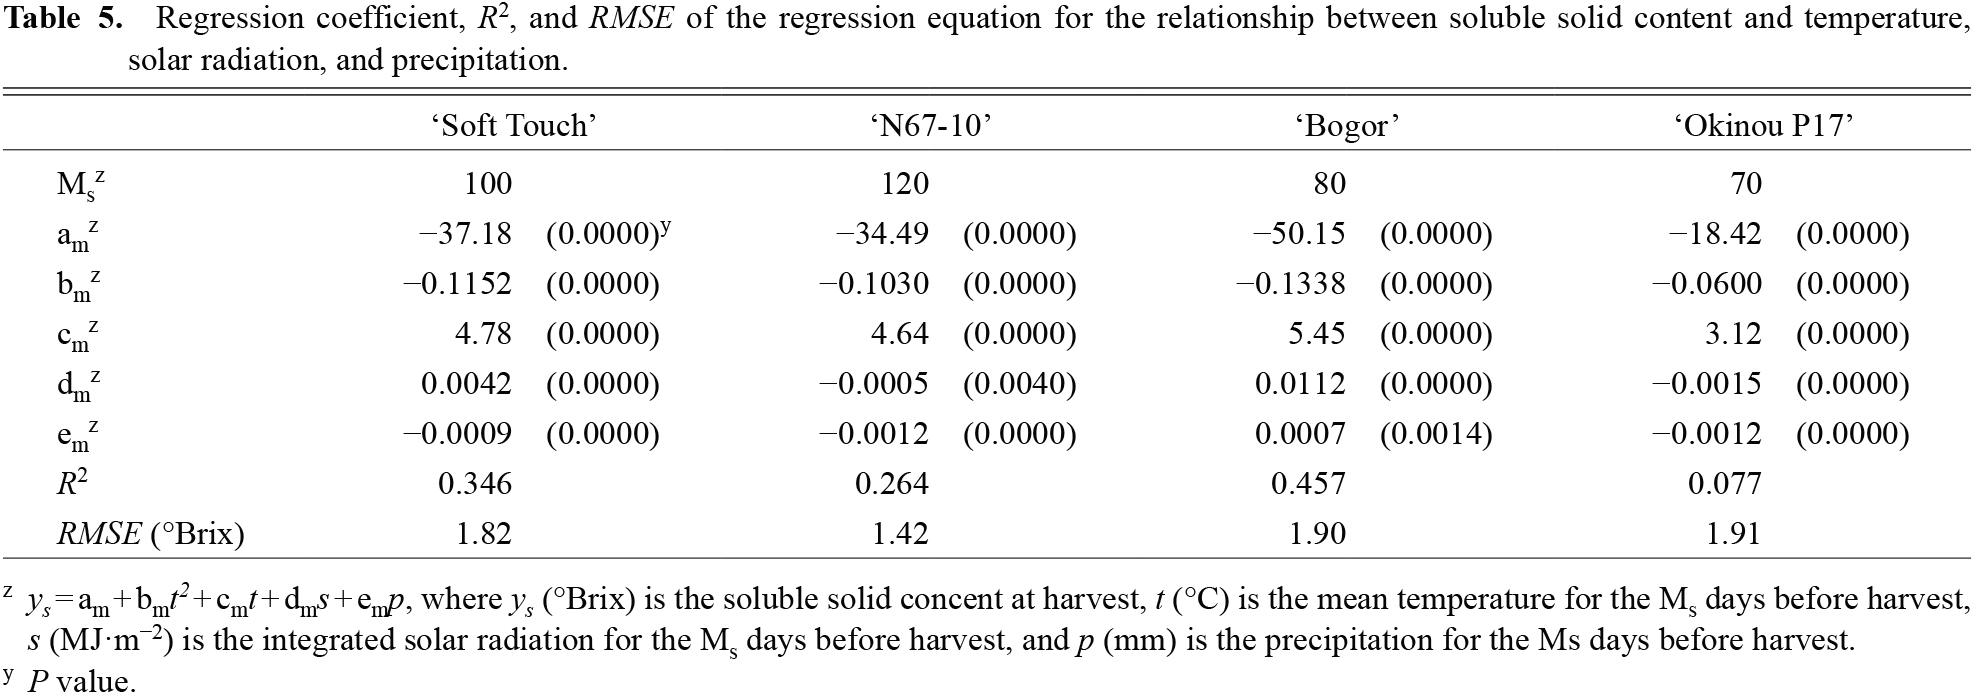
Therefore, the periods of soluble solid content high sensitivity to temperature (Ms) are assumed to be the periods of 100, 120, 80, and 70 days before harvest for ‘Soft Touch’, ‘N67-10’, ‘Bogor’, and ‘Okinou P17’, respectively. The relationship between the mean temperature of the Ms days before harvest and the soluble solid content at harvest yielded a curve, peaking around 23°C (Fig. 5E–H). Regional differences in these relationships were unclear. The coefficients am, bm, and cm in Equation (3) were calculated when M = Ms (Table 4). All the coefficients were significant (P < 0.001), but all R2 were small (R2 < 0.3).
Nose (1986) and Kawamitsu et al. (2002) both reported the influence of daylight intensity and soil moisture affect pineapple photosynthetic rate changes. Thus, we formulated a multiple regression model using the integrated solar radiation and precipitation over the Ms days before harvest:
|
ys=am+bmtm2+cmtm+dmsm+empm
| (4) |
where
sm (MJ·m
−2) and
pm (mm) are the integrated solar radiation and precipitation over the M
s days before harvest, and d
m and e
m are regression coefficients. The coefficients,
R2, and
RMSE were calculated (
Table 5).
All coefficients were significant (P < 0.001), yet differences in R2 and RMSE between Equations (3) and (4) were small. This suggests that solar radiation and precipitation affect soluble solid content, but the effects are smaller than temperature. The coefficients dm and em were positive or negative depending on the cultivar. This may be a result of inaccuracies in the coefficients analysis, due to the small effects of solar radiation and precipitation.
Figure 7 shows the relationship between mean temperature over the Ms days before harvest and soluble solid content distribution. The temperature at which more than 80% of the fruit had a soluble solid content of 15 °Brix was ≥ 19°C for ‘Okinou P17’, 20–27°C for ‘Bogor’, 18–26°C for ‘Soft Touch’, and 22–23°C for ‘N67-10’. Many ‘Okinou P17’ fruit had soluble solid contents of ≥ 18 °Brix even in high-temperature conditions, while many fruit of ‘N67-10’ had soluble solid contents of < 18 °Brix at all temperatures. Takeuchi (2022) reported that among the four cultivars, ‘N67-10’ had the lowest soluble solid content, and ‘Okinou P17’ had a long period of high soluble solid content. These support the soluble solid content distributions.
Acid and soluble solid contents of pineapple were affected by temperatures in the 10–20 and 70–120 days before harvest, respectively. Acid content related linearly with temperature, with higher temperatures resulting in lower acid content. The relationship between soluble solid content and temperature was a curve with a peak around 23°C, nonetheless, the effect of temperature was smaller than that of acid. Cultivar characteristics were clearly expressed in the acid and soluble solid content distributions. These results contribute to a greater understanding of the relationships between acids, soluble solid content, and temperature.