Abstract
Persimmon fruit synthesizes and accumulates proanthocyanidins (PAs), resulting in its astringent taste. The pollination-constant and non-astringent (PCNA) trait is conferred by recessive alleles at the ASTRINGENCY (AST) locus, which has been exploited to control PA accumulation of persimmon fruit. However, some individuals with recessive homozygosity at the AST marker locus in breeding populations produce mature fruit with astringency, thereby reducing the marker-selection efficiency for the PCNA trait. In this study, we genetically and physiologically characterized the predicted ast-homozygous individuals exhibiting strong astringency in a cross population of ‘Taigetsu’ (non-PCNA) and ‘Kanshu’ (PCNA). The fruit PA content of these astringent individuals was higher than that of the other PCNA fruit, but lower than that of the non-PCNA fruit. These astringent individuals were similar to the other PCNA plants in terms of tannin cell size. Gene expression analysis revealed that PA synthesis-related genes (e.g., DkMYB4, DkMYC1, and DkANR) were expressed at a higher level in the astringent individuals than in the other PCNA fruit during the early fruit development stage. Furthermore, in the presumed ast-homozygous individuals with various PA contents, the expression of cellular function-related genes was highly correlated with PA accumulation. These genes may be important for tannin cell development and PA synthesis, potentially offering a novel approach to further modulate astringency in persimmons.
Introduction
Persimmon (Diospyros kaki Thunb.; 2n = 6x = 90) fruit accumulates a large amount of proanthocyanidins (PAs) during the fruit development period, resulting in a strong astringent taste. Persimmon cultivars are classified as a pollination constant and non-astringent (PCNA) type and a non-PCNA type based on PA accumulation patterns in fruit. Non-PCNA fruit continues to accumulate PAs during the fruit development period, and its de-astringency level is determined by ethanol and acetaldehyde contents produced from seeds (Sugiura and Tomana, 1983). On the other hand, the de-astringent process of PCNA fruit is not mainly caused by volatile compound production, but by the cessation of PA accumulation in the early fruit development stage (Yonemori and Matsushima, 1985). Due to its low PA content, mature PCNA fruit is edible without the need for de-astringent treatment using carbon dioxide gas or ethanol vapor. To alleviate such additional labor, modern persimmon breeding programs in Japan have focused on developing elite PCNA cultivars (Sato and Yamada, 2016).
The Japanese-type PCNA trait, which has been targeted by modern breeding programs, is conferred by a single locus, ASTRINGENCY (AST), and PCNA is recessive homozygous at the AST locus (aaaaaa) (Ikeda et al., 1985; Sato and Yamada, 2016). Although AST has not been identified, marker-assisted selection (MAS) using an AST-linked sequence characterized amplified region (SCAR) marker (Kanzaki et al., 2010) has already been introduced in populations derived from crosses between PCNA and non-PCNA in practical breeding programs (Mitani et al., 2014a, b). In PCNA breeding programs, non-PCNA parents are preferred to avoid inbreeding depression, which has occurred in crosses among PCNA parents because of their relatively limited genetic diversity and close relations (Yamada, 1993). However, due to the polyploidy nature of persimmon, only a low rate of PCNA individuals is obtained from the cross between PCNA and non-PCNA plants (Ikeda et al., 1985). Therefore, MAS can be effectively used to enhance the efficiency of PCNA breeding in these cases where only a small percentage of PCNA offspring individuals are expected.
In persimmon fruit tissues, PAs accumulate in the vacuoles of tannin cells, and previous reports revealed that tannin cell size is closely associated with the PA content (Hamada et al., 2009; Ikegami et al., 2004; Yonemori and Matsushima, 1985, 1987b). Based on the observation that tannin cell expansion stops during the period from the end of June to early July in PCNA fruit, it has been proposed that the de-astringent process can be explained by the dilution of tannin contents as the fruit increases in size (Yonemori and Matsushima, 1985).
Previous research on tannin cell development was limited to the cytological features or size differences in cultivars during the fruit development period (Tessmer et al., 2014; Yonemori and Matsushima, 1985, 1987a, b). In contrast, there has been considerable research conducted to decipher the mechanism underlying PA accumulation in persimmon fruit, such as cloning of genes related to the PA biosynthesis pathway. DkMYB4 and DkMYC1 transcription factors, which are associated with the MBW complex and dominantly regulate PA synthesis (Xu et al., 2015), have been identified in persimmon. Their expression patterns coincide with PA accumulation cessation in PCNA fruit (Akagi et al., 2009a; Nishiyama et al., 2018a; Su et al., 2012) and decreases in the expression of anthocyanidin reductase (ANR) (Akagi et al., 2009a, b). Cis-regulation of the DkMYB4 and DkMYC1 complex for DkANR expression has been already shown (Akagi et al., 2009a; Gil-Muñoz et al., 2020), indicating its importance for PA synthesis in persimmon fruit. In contrast to our increasing understanding of the PA synthesis cascade, the molecular basis of tannin cell development remains unexplored.
There are other issues associated with PCNA fruit production and breeding. Most ast-homozygous plants are known to produce astringent fruit when cultivated in the northern part of Japan, which geographically restricts their cultivation area. Harada et al. (1990) reported that the de-astringency process of PCNA fruit requires warm temperatures after the middle fruit development stage. Furthermore, ast-homozygous cultivars show various degrees of fruit astringency loss, depending on the genotype and environment. For example, ‘Hanagosho’ and its F1 offspring ‘Okitsu-20’ often bear fruit that is more astringent than that of ‘Fuyu’ and ‘Jiro’, the most common PCNA cultivars in Japan, even in the middle part of the country (Harada et al., 1990; Yamada and Sato, 2001). This suggests that astringency loss in PCNA fruit is controlled by both environmental and genetic effects. Due to the reciprocal interaction of these effects, ast-homozygous cultivars that retain astringency (e.g., ‘Hanagosho’) have more significant regional limitations for commercial production compared to the commonly cultivated ‘Fuyu’. Consequently, developing ast-homozygous cultivars with reduced astringency is crucial for expanding the geographic range suitable for PCNA fruit production.
In this study, we focused on the variation in fruit astringency and PA content in ast-homozygous plants. In breeding populations, some marker-selected ast-homozygous individuals, which are expected to exhibit the PCNA phenotype according to the AST-linked marker genotype, produce astringent fruit. Fruit astringency of such individuals is generally lower than that of non-PCNA individuals, but any astringency is an undesirable trait. Accordingly, astringent ast-homozygous breeding individuals have been selected out during the selection step of sensory testing, which requires additional labor and expense. Moreover, astringency of the ast-homozygous plants has not been thoroughly characterized to date. In this study, we characterized the fruit PA content and tannin cell development of ast-homozygous individuals from the cross between ‘Taigetsu’ and ‘Kanshu’ during the middle fruit development stage. Furthermore, gene expression related to tannin cell development was characterized by analyzing two astringent ast-homozygous individuals.
Materials and Methods
Plant materials
A D. kaki F1 population from the cross between ‘Taigetsu’ (non-PCNA) and ‘Kanshu’ (PCNA) was used in this study. This population was maintained in the breeding orchard of the Grape and Persimmon Research Station, Institute of Fruit Tree and Tea Science, NARO, Japan (Higashi-hiroshima, Japan). The AST genotype at the SCAR marker locus (Kanzaki et al., 2010) and sensory scores for astringency were retrieved from the breeding records maintained at NARO. Fruits from 12 individuals were collected on July 12 and August 21 in 2017. The 12 individuals consisted of seven marker-selected ast-homozygous siblings (538-164, 538-194, 538-235, 538-265, 538-274, 538-1136, and 540-1576), three non-PCNA siblings (538-127, 538-196, and 538-391) and the parents ‘Taigetsu’ and ‘Kanshu’. The numbers, 538 and 540, indicate cross population numbers that were created in 2003 and 2004, respectively. Ten (540-1576) or five (the other materials) biological replicates (one fruit each) were prepared, and the mesocarp was cut and frozen immediately in liquid nitrogen for the PA and RNA analyses. When counting the number of tannin cells per tissue, we did not prepare biological replicates except for 540-1576. For most materials, approximately 40 mg of mesocarp was cut from each biological replicate to form single sample and fixed in FAA solution (5% glacial acetic acid/10% formalin/35% water/50% absolute ethanol). For 540-1576, the important predicted ast-homozygous plants with astringency, we sampled approximately 200 mg from each biological replicate (fruit) and handled the replicates separately for the counting analysis. Furthermore, to follow up the analyses of fruit PA content and tannin cells, we repeated the sampling and analyses in two successive years. Five fruits were collected again for 538-1136, 540-1576 and the two parents, ‘Taigetsu’ and ‘Kanshu’, on August 17 in 2018 and August 22 in 2019. In addition, during the 2019 season, five fruits, each representing a biological replicate, were sampled approximately every two weeks from early June to mid-August, concluding on August 22, to assess PA accumulation patterns. The details of individuals used for each experiment are summarized in Supplementary Table S1.
Marker genotyping for detection of different AST haplotypes
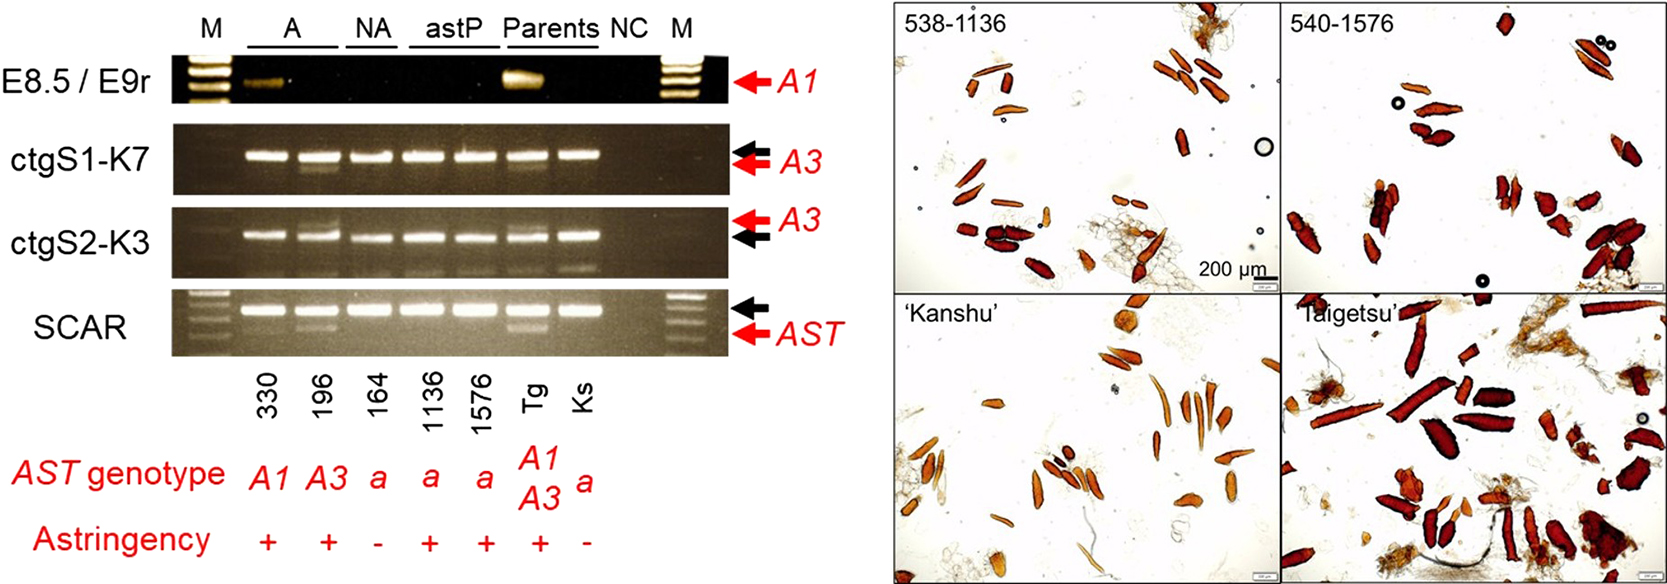
Although AST has not been cloned, the AST genotype can be predicted using a SCAR marker that is closely linked to AST (Kanzaki et al., 2010; Kono et al., 2016; Onoue et al., 2018). To assess the possibility that the AST genotype predicted by the SCAR marker is incorrect due to recombination between the AST gene and the SCAR marker, the whole AST-located region, which was delimited in a previous study (Nishiyama et al., 2018b), was examined using a predicted ast-homozygous individual exhibiting the astringency trait (i.e., 540-1576) after extracting DNA. Because the non-PCNA parent ‘Taigetsu’ has two AST haplotypes (A1 and A3) (Mitani et al., 2014b), 540-1576 can inherit the A1 or A3 haplotype around the AST locus. The genotypes of two previously reported A3-specific CAPS markers (ctgS1-K7 and ctgS2-K3; Nishiyama et al., 2018b) and one A1-specific SCAR marker (E8.5/E9r; Mitani et al., 2014b) were investigated by PCR amplification in three predicted ast-homozygous siblings (538-164, 538-1136, and 540-1576), two non-PCNA siblings (538-330 and 538-196) and the parents ‘Taigetsu’ and ‘Kanshu’. The ast allele genotypes of this population were determined by fragment analysis of amplicons using AST-F, PCNA-F, and 5R3R primers, following the method described in Onoue et al. (2018).
In addition, considering the possibility of genome rearrangement and the presence of only one reported A1-specific molecular marker across the AST region, we attempted to genotype A1 and A3 alleles by a whole-genome sequencing approach. We obtained whole DNA-seq data for ‘Taigetsu’, ‘Kanshu’, 540-1576, 538-1136, A1-bulk (DNA bulk comprising 10 siblings from a cross between ‘Taigetsu’ and ‘Kanshu’, which was thought to have the A1 allele at the SCAR marker. All plants here were genotyped as non-PCNA using the SCAR marker, but showed no A3 signal with the A3-specific markers; See Supplementary Table S1), or A3-bulk (DNA bulk comprising 10 siblings from a cross between ‘Taigetsu’ and ‘Kanshu’, which was predicted to have the A3 allele at the SCAR marker. All plants here were genotyped as non-PCNA using the SCAR marker and had an A3 signal with the A3-specific markers; See Supplementary Table S1) at a sequencing depth of approximately 20x the hexaploid genome. For ‘Kanshu’, 540-1576, and A1-bulk, the DNA-seq library was prepared from 1.5 μg DNA of each individual using an in-house method (Akagi et al., 2014) and sequenced on the Hiseq X platform. For ‘Taigetsu’, 538-1136, and A3-bulk, the DNA-seq library was prepared using an NEBNext® UltraTM IIDNA Library Prep Kit (NEB, Ipswich, MA, USA) and sequenced on one lane of NovaSeq X Plus at Novogene. The reads were filtered for quality using fastp (Chen et al., 2018) with default parameters and then the high-quality reads were aligned to the Diospyros lotus BAC sequences constructed around the AST-locating region (Nishiyama et al., 2018b) using BWA (Li and Durbin, 2009). SAMtools (Li et al., 2009) was used to generate BAM files. Variants were called in a hexaploid manner (-p 6) using freebayes (Garrison and Marth, 2012). After filtering for only biallelic sites and excluding those with any missing genotype data, genotypic data was further processed using updog (Gerard et al., 2018) with the model set to “norm”. The variants were then further filtered using the filter_snp function with the argument prop_miss < 0.05. The variants were further filtered using a read depth of 50–200 (the expected read depth was 120, which corresponded to hexaploidy and a sequencing depth of 20x). Subsequently, the number of variants per 10 kb that were homozygous in ‘Kanshu’ and heterozygous in 540-1576, 538-1136, A1-bulk, A3-bulk, and ‘Taigetsu’ were mapped across the AST region.
Soluble PA and tannin cell analyses
Soluble PA in 10 mg freeze-dried and ground fruit tissue was extracted three times using 500 ml 80% (v/v) methanol and measured as (+)-catechin equivalents according to the DMACA method (Li et al., 1996) for each prepared biological replicate.
To analyze tannin cell numbers in the 2017 samples, fixed fruit tissue was washed with distilled water and then replaced in a 0.05 M EDTA (pH 10) solution. After incubation at 45°C overnight, the tissue was crushed using hydrostatic pressure, and dispersed cells were collected in a 15 ml centrifuge tube. Since different cell types (i.e., tannin cells and others) have various specific gravities, we repeatedly filled and drained the 15 mL centrifuge tube with distilled water to remove lighter parenchyma cells and collect the heavier tannin cells. After that, the volume of water in the tube containing the cells was adjusted to 1 mL. After the number of tannin cells in a 20 μL of fixed cell suspension volume was counted with a VHX-500F digital microscope (KEYENCE, Osaka, Japan), the number of tannin cells per tissue was calculated by the ratio of the whole cell suspension volume and its aliquot for microscopic observation. This observation was repeated five times for a single sample (five technical replicates), excluding 540-1576, the important astringent ast-homozygous individuals. For 540-1576, the measurement was conducted three times for each of the 10 biological replicates (one fruit per replicate). The tannin cell size was measured using ImageJ (Schneider et al., 2012), with more than 45 cells per sample.
As for the 2018 and 2019 samples, soluble PA content was measured in the same way as for the 2017 samples. For tannin cell observations, three and five biological replicates (fruits) were used in the 2018 and 2019 samples, respectively. After incubation in a 0.05 M EDTA (pH 10) solution, cell wall of fruit tissues was enzymatically digested by 0.5% ONOZUKA RS (Yakult, Tokyo, Japan) and 0.05% Macerozyme R-10 (Yakult) at 45°C for three hours. The tannin cell suspension was filtered using 500 μm mesh to screen out vascular tissue. The suspension of isolated tannin cells was messed up to 10 ml, and 50 μl aliquot of the suspension was used for tannin cell observation. The number of tannin cells was manually measured using DP72 (Olympus, Tokyo, Japan). The size of tannin cells was measured using DP80 (Olympus) and ImageJ.
Gene expression analysis
The DkMYB4, DkMYC1, and DkANR expression levels were analyzed by qRT-PCR. Briefly, total RNA was extracted from fruit tissues using a hot borate method (Wan and Wilkins, 1994) and then cDNA was synthesized using ReverTra Ace® qPCR RT Master Mix (TOYOBO, Osaka, Japan). The cDNA templates along with the THUNDERBIRD® SYBRTM qPCR Mix (TOYOBO) and the LightCycler 480 II system (Roche, Basel, Switzerland) were used for the qRT-PCR analysis. The DkActin was used as the internal standard. All primer sequences for qRT-PCR were designed following previous reports (Akagi et al., 2009a; Su et al., 2012) and shown in Supplementary Table S2.
Twelve individuals sampled on July 12 or August 21 in 2017 were used for the transcriptome analysis. In this experiment, RNA obtained from five biological replicates, which represent five fruits, was mixed in equal amounts to form a single sample, and no biological replicates were set for each individual. Three micrograms of the pooled total RNA were used to construct RNA-seq libraries using an NEBNext Ultra II RNA Library Prep Kit for Illumina (NEB) and NEBNext Multiplex Oligos for Illumina (NEB). The same quantity of the libraries from each sample was pooled into a single batch, and 24 libraries (comprising 12 samples each from July 12 and August 21) was sequenced using the DNBSEQ platform (150 bp paired-end reads). The reads filtered using the default parameters of fastp were mapped to the coding sequences in the Diospyros oleifera reference genome (Suo et al., 2020), which is considered to be the closest diploid species to D. kaki (Fu et al., 2016; Yonemori et al., 2008), using the STAR pipeline (Dobin et al., 2013). Transcript abundance was quantified using RSEM (Li and Dewey, 2011) and the tximport package (Soneson et al., 2016). Only the expressed genes with an average transcript per million (TPM) value for eight ast-homozygous individuals exceeding 1 were retained. Differentially expressed genes (DEGs) were detected by comparing two ast-homozygous individuals with astringent traits, 538-1136 and 540-1576, with the other six normal PCNA individuals. This comparison was conducted using DESeq2 (Love et al., 2014), setting thresholds at a false discovery rate (FDR) < 0.1 or P < 0.05. The DEGs with a P value less than 0.05 were analyzed for Gene Ontology (GO) enrichment analysis. Because the genes in the D. oleifera genome were not annotated with GO terms, we created a GO term list for D. oleifera genes. Briefly, Arabidopsis thaliana homologs in the Araport11 database were identified (Cheng et al., 2017) using blastp with an e-value threshold of 1e−5. The best-hit homolog with the lowest e-value was selected. The D. oleifera genes were assigned GO terms according to the A. thaliana GO slim (Berardini et al., 2004; retrieved on April 27th, 2020). The GO enrichment analysis was performed using the topGO package (Alexa et al., 2006) and the following parameters: ontology = “BP”, algorithm = “classic”, and statistic = “ks”. The identified DEGs were further annotated through Blast2GO version 6.0.3 using a Blastx search of the NCBI nr database, with an e-value cutoff of 1e−3.
Results
AST-linked marker genotyping of astringent predicted ast-homozygous individuals
Two predicted ast-homozygous individuals, 538-1136 and 540-1576, from a cross between ‘Taigetsu’ and ‘Kanshu’ were scored as non-PCNA by a sensory evaluation during the breeding process. The AST genotype of these individuals was previously determined using a single primer set (PCNA-F/AST-F/5R3R) targeting the 5R region (Kanzaki et al., 2010). We initially hypothesized that the discrepancy between the AST marker genotype and the astringency of these individuals may be due to the recombination between the AST gene and marker region, with the chimeric haplotype inherited by the astringent individuals.
To assess this possibility, the genotypes of several AST-linked markers were analyzed in a cross population between ‘Taigetsu’ and ‘Kanshu’. ‘Taigetsu’ has two AST haplotypes, namely A1 and A3 (Mitani et al., 2014b). The A3-specific markers were previously developed across the AST region (Nishiyama et al., 2018b). The genotyping analysis of the A3 markers, ctgS1-K7 and ctgS2-K3, positioned around either end of the delimited AST region (Nishiyama et al., 2018b), suggested the absence of the A3 haplotype in 540-1576 and 538-1136 (Fig. 1A). As for the A1 haplotype, PCR analysis utilizing A1-specific primers (Mitani et al., 2014b) suggested the absence of the A1 haplotype (Fig. 1A). Additionally, the presence of A1 and A3 haplotypes was investigated in 540-1576 and 538-1136 via a whole DNA sequencing approach. A1- and A3-linked polymorphisms were detected across the AST region (A1-bulk from Tg and A3-bulk from Tg in Fig. 1B, C). However, the A1-linked variants’ signals in the whole region were much weaker in 540-1576 and 538-1136 compared to those detected in A1-bulk (Fig. 1B, C). The same pattern was observed for the A3 haplotype. Additionally, very few heterozygous variants were shared between A1-bulk or A3-bulk and 540-1576 (2.0% and 1.5% of all variants in this region in 540-1576 for A1 and A3, respectively) or 538-1136 (2.5% and 2.2% of all variants in this region in 538-1136 for A1 and A3, respectively). These variants were not localized at either end of the AST region, indicating no evidence of recombination between the AST and ast haplotypes. These genotyping results indicated that 540-1576 and 538-1136 most likely have a recessive homozygous genotype at the AST locus, that is, the conventional PCNA genotype.

We also investigated whether the astringent phenotype observed in the predicted ast-homozygous individuals could be attributed to the ast allele unique to the astringent plants. The variation in ast alleles has been well-characterized in the 5R adjacent region, and they can be typed using SSR variation within this region (Onoue et al., 2018). In the population derived from the cross between ‘Taigetsu’ and ‘Kanshu’, four ast alleles, namely a349, a351, a353, and a355, with substantial sequence variations, can be inherited. Genotyping analysis revealed that 540-1576 and 538-1136 do not possess any specific ast alleles (Supplementary Table S3). This confirms that, in line with current knowledge, there are no detectable genetic features within the AST region that can be used to select for astringent plants.
Astringency and PA accumulation of ast-homozygous individuals in the population derived from the cross between ‘Taigetsu’ and ‘Kanshu’
To characterize PA accumulation and its related features in the predicted ast-homozygous individuals with astringency, the pattern of soluble PA content per fruit during fruit development is elucidated. It is known that non-PCNA fruit continue to accumulate PA throughout fruit development until the onset of coloration, whereas PA accumulation in the mutant PCNA types ceases early in fruit development. The predicted ast-homozygous individuals with astringency, 540-1576 and 538-1136, exhibited a PA accumulation pattern similar to that of the PCNA parent ‘Kanshu’, with PA accumulation in fruit halting by early July (Fig. 2A).

We further assessed the variation in PA accumulation within this cross population. Two predicted ast-homozygous individuals, 538-1136 and 540-1576, had a higher soluble PA content than the other PCNA samples collected on August 21, and it was observed that the PA content was highly correlated with the sensory test scores (Fig. 2B). On the other hand, the size of the tannin cells of these two individuals was similar to that of the other PCNA individuals (Fig. 2C). For the number of tannin cells per fruit tissue, there was no significant difference between the two predicted ast-homozygous individuals and the other normal PCNA individuals in the July sample (Fig. 2D). However, 538-1136 had significant more tannin cells in the August sample, while 540-1576 had a similar number of tannin cells compared with the other PCNA and non-PCNA individuals (Fig. 2D). To confirm this result, the number of tannin cells in fruit tissue in 538-1136, 540-1576 and their parents was measured again using samples collected on August 17 in 2018 and on August 22 in 2019. Consistently, 538-1136 and 540-1576 exhibited higher fruit PA content, but with tannin cells the same size as the PCNA parent ‘Kanshu’ in the additional two years (Fig. 3A, B). As for the number of tannin cells, 538-1136 had significantly more tannin cells than the parents, while the number of tannin cells in 540-1576 was not significantly different from that of ‘Kanshu’ (Fig. 3C), supporting the results for the 2017 samples. Instead, we observed many dark-colored tannin cells in 540-1576, as well as a non-PCNA parent ‘Taigetsu’, while a PCNA parent ‘Kanshu’ had pale-brown tannin cells (Fig. 3D). Collectively, although both 540-1576 and 538-1136, the predicted astringent ast-homozygous plants, exhibited a high PA level in their fruit, the reason behind this in terms of tannin cell is likely to be different. Specifically, 538-1136 had more tannin cells than the other PCNA individuals, while 540-1576 may have tannin cells which are richer in PA or contain a distinct PA chemical profile in tannin cell vacuoles.

We further considered the fruit enlargement-related “dilution-effect” (Yonemori and Matsushima, 1985) during the de-astringency process in the late fruit development period. Although the soluble PA content was higher in 540-1576 and 538-1136, there were no major differences in the fruit weight associated with PA content in the July 12 and August 21 samples (Fig. 2E), indicating the astringent fruit and the PCNA fruit developed at a similar rate, suggesting that the dilution-based de-astringency process proceeded at the same rate in all ast-homozygous individuals. Hence, the astringency of 540-1576 and 538-1136 may be associated with PA synthesis, but is not likely due to the production of small fruit.
Gene expression analysis related to PA synthesis
The qRT-PCR indicated the expression of PA-related genes (DkMYB4, DkMYC1, and DkANR) differed significantly between the astringent and other ast-homozygous individuals (Fig. 4). It was assumed that a few transcription factors, such as DkMYB4 and DkMYC1, play a central role in the regulation of the gene expression network that results in the differential PA accumulation between PCNA and non-PCNA individuals (Akagi et al., 2009a; Nishiyama et al., 2018a; Su et al., 2012). Both DkMYB4 and DkMYC1 were more highly expressed in the non-PCNA individuals and the astringent ast-homozygous fruit than in the other PCNA individuals in the samples collected on July 12 (Fig. 4A, B). The expression levels of DkANR in the astringent ast-homozygous individuals were at a similar level to those in the non-PCNA individuals, but more than the other PCNA individuals (Fig. 4C), which was consistent with the higher PA contents. The expression levels of these key PA-related genes decreased in the fruit collected from all individuals on August 21. These findings suggest that the astringent ast-homozygous individuals can synthesize PAs even in the middle fruit development stage, possibly by controlling the MBW transcription factor complex.

In addition, we conducted transcriptome analysis to further characterize the overall gene expression pattern that is unique to the astringent ast-homozygous individuals. Differential expression analysis between astringent ast-homozygous individuals and the other (normal) PCNA individuals identified 47 and 23 DEGs (FDR < 0.1) in the July and August samples, respectively, with three genes [phenylalanine ammonia-lyase (PAL), RmlC-like cupins superfamily protein, and dormancy-associated protein homolog 3-like; Table 1] common to both sets. Their expression patterns are shown in Supplementary Figure S1. Under a looser threshold (P < 0.05), 1,143 and 1,134 DEGs were identified in the July and August samples, respectively. Importantly, 1,143 DEGs identified in the July samples were enriched in terms of flavonoid biosynthesis and metabolism, whereas 1,134 DEGs in the August samples were not (Table 2; Supplementary Table S4). This suggests that the earlier developmental stage is critical for the development of astringency in this population. It should also be noted that some GO terms detected in the July samples were related to cell growth or cell wall processes, such as “multidimensional cell growth” and “regulation of cell wall organization or biogenesis” (Table 2).

To further characterize the mechanism that regulates the astringency trait, we explored 47 DEGs (FDR < 0.1) in the July samples by analyzing the Pearson’s correlation coefficient between the TPM values of DEGs and the PA contents (mg·g−1 DW) of the fruit collected on August 21 (Table 1). The expression levels of these genes differed significantly between the two astringent ast-homozygous individuals and the other PCNA individuals, suggesting they may be associated with tannin cell development mechanisms. In this DEG list, many of the genes positively correlated with the PA content were involved in the flavonoid biosynthesis pathway. Of these genes, two ANR homologs were the most positively correlated with the PA content, consistent with the results of PA analysis and qPCR (Fig. 4).
Another notable gene highly positively correlated with the PA content was WRKY44 (Table 1); this gene is a homolog of TTG2, which encodes a transcription factor that regulates the expression of the MATE-type PA precursor transporter gene TT12 in A. thaliana (Kitamura et al., 2010). The highly positively correlated genes also included the MATE transporter family gene DTX41, which is very similar to TT12, and other DTX genes (DTX46 and DTX33) (Table 1; Supplementary Fig. S2). These results reflect the high expression of WRKY44 and the associated regulatory effects on the expression of MATE transporter family genes.
On the other hand, DEGs that are negatively correlated with PA content are mainly involved in cellular organizing processes, including cell wall metabolism [cellulose synthase-like protein G3 (CSLG3) and leucine-rich repeat extension-like protein 4 (LRX4)], cytoskeleton-related genes [F-actin-capping protein subunit alpha (CPA), Rho-associated protein kinase (ROCK), and myosin], intercellular communication and cell division-related genes (QUIRKY and cyclin D3) (Table 1). The significant changes in the expression of such cellular function-related genes may reflect tannin cell morphological modifications.
Discussion
Astringency and PA accumulation of the marker-selected predicted ast-homozygous persimmons
During the breeding of PCNA cultivars, the astringent trait is occasionally found in marker-selected individuals. This is a major problem because even a slightly astringent taste is an undesirable trait for commercial production. In the NARO breeding program, a significant number of predicted ast-homozygous offspring [1,475 out of 13,136 PCNA individuals (11.2%), including Chinese-type PCNA, up to the 2023 season; Supplementary Table S5] exhibited fruit astringency unacceptable for commercial production. Astringency levels vary within a population, and this study identified two predicted ast-homozygous individuals, 538-1136 and 540-1576, as exhibiting the highest level of astringency. This is the first study to reveal that such strong astringency can occur in a substantial proportion of individuals in marker-assisted PCNA breeding. Although this study could not fully confirm that these individuals were homozygous for the mutated ast alleles genetically, as the AST gene has yet to be cloned, it is highly likely that they are homozygous for ast based on the following evidence: (1) the absence of AST-linked variants in the marker genotyping and whole sequencing results (Fig. 1), (2) the timing of PA accumulation cessation being identical to that of PCNA (Fig. 2A), (3) lower PA content compared to non-PCNA individuals (Fig. 2B), and (4) the smaller size of tannin cells, which is comparable to that of PCNA, and smaller than that of non-PCNA, individuals (Fig. 2C).
In this study, the predicted astringent ast-homozygous individuals resulting from the ‘Taigetsu’ and ‘Kanshu’ hybridization had a higher fruit PA content and characteristic tannin cell development patterns compared with the other PCNA individuals (Figs. 2 and 3). The PCNA trait has been considered to be a qualitative trait controlled by a single locus. In contrast, PA synthesis and accumulation are regulated by multiple genes such as structural enzymes, transcription factors, and transporters (Lepiniec et al., 2006). Consequently, it is understandable that the fruit PA content varies among individuals in a cross-derived population, manifesting as a quantitative trait. This variation depends on the cross combination, and our study suggests it is independent of the large genetic effect of AST. We also observed that the PA contents of 538-1136 and 540-1576 were between those of the other PCNA and non-PCNA individuals (Fig. 2B). Similarly, we noted that a small number of predicted ast-homozygous individuals displayed the highest-level astringency observed in the ‘Taigetsu’ × ‘Kanshu’ population (Supplementary Table S5). These results collectively imply that AST has a significantly stronger genetic effect on PA synthesis and accumulation in persimmon fruit compared to other genetic factors contributing to astringency in ast-homozygous individuals.
It has been reported that DkMYB4 and DkMYC1 are key regulators in the control of PAs, operating under the regulation of AST (Akagi et al., 2009a; Nishiyama et al., 2018a; Su et al., 2012). In addition to the previously reported mechanism for controlling PA synthesis by DkMYB4 and DkMYC1, WRKY44 was revealed as a candidate key regulator of tannin cell development, which is thought to promote the flow of PA precursors into vacuoles (Supplementary Fig. S3). The WRKY transcription factor family members regulate abiotic and biotic stress tolerance in plants by controlling the synthesis of secondary metabolites (Schluttenhofer and Yuan, 2015). WRKY44 is homologous to TTG2, which is regulated by the MBW transcription factor complex. The TTG2 transcription factor controls the expression of the MATE-type transporter gene TT12, which is critical for the transport of PA precursors (Ishida et al., 2007; Kitamura et al., 2010; Marinova et al., 2007). In the current study, WRKY44 was expressed at the same level in the non-PCNA and astringent ast-homozygous individuals, while it was expressed at a significantly lower level in the PCNA individuals (Supplementary Fig. S2), indicating that unlike DkMYB4 and DkMYC1, WRKY44 can be highly expressed even in the ast-homozygous genotype in July. Moreover, WRKY44 was the only PA-related transcription factor gene among the 47 DEGs (FDR < 0.1; Table 1) based on homology-based annotation, implying a key role in the mechanism mediating the astringency in ast-homozygous individuals. In addition, some MATE transporter genes were highly expressed in astringent ast-homozygous individuals, including DTX46, DTX33, and DTX41 (Supplementary Fig. S2). DTX46 reportedly contributes to the export of phenolic substances from chloroplasts (Li et al., 2002; Parinthawong et al., 2015). DTX33 in A. thaliana encodes a turgor-regulating tonoplast chloride channel, rather than a flavonoid channel (Zhang et al., 2017). The sequence of persimmon DTX41 is very similar to Arabidopsis TT12, the key transporter of PA precursors. It is important to note that the morphology of tannin cells differs between the two astringent plants (Fig. 3), suggesting the possibility of distinct underlying mechanisms. Nevertheless, the expression patterns of these genes in the astringent individuals and their functions can explain the high PA accumulation and underscore the importance of transport processes for the astringency trait.
Putative functions related to tannin cell development
Tannin cell development is a notable physiological feature influenced by PA in persimmon fruit; however, the developmental process of tannin cells is largely unknown (Nishiyama and Yonemori, 2022). Moreover, the mechanism underlying the transport of PA into vacuoles has not been comprehensively characterized, even in model systems (Dixon and Sarnala, 2020). The PCNA individuals with relatively high PA content and characteristic tannin cell development found in the current study can be a good resource to genetically characterize the mechanism mediating tannin cell development. The potential events that may underlie the tannin cell development mechanism, as suggested in this study, are summarized in Supplementary Figure S3B.
Transcriptome analysis indicated many cell structure-related genes were differentially expressed between the astringent ast-homozygous and PCNA individuals, including CSLG3, LRX4, CPA, ROCK, and myosin (Table 1). The downregulated CSLG3 and LRX4 contribute to cell wall metabolism (Herger et al., 2019; Xiao et al., 2020), whereas the upregulated CPA, ROCK, and myosin are likely related to cytoskeleton dynamics, cell growth, or organelle movements (Duan and Tominaga, 2018; Huang et al., 2003; Mulvey and Dolan, 2023; Riento and Ridley, 2003; Wu and Bezanilla, 2014). Specifically, tannin cells likely have unique vesicle trafficking and have large pores in their cell walls (Yonemori and Matsushima, 1987a, b), and the above genes are candidates for characterizing this pathway.
The number of tannin cells in fruit tissues differed between the astringent ast-homozygous and other PCNA individuals (Fig. 2D). In relation to this result, the expression levels of intercellular communication-related and cell division-related genes, such as QUIRKY and Cyclin D3, were significantly downregulated in the astringent ast-homozygous samples (Table 1). Especially, QUIRKY, a membrane-anchored C2 domain-containing protein localized in plasmodesmata, is involved in intercellular signal transduction (Fulton et al., 2009; Vaddepalli et al., 2014), reminiscent of observations regarding the presence of large cell wall pores in tannin cells (Yonemori and Matsushima, 1987a). The above genes are candidates that are likely to facilitate PA regulation through cellular mechanisms.
Future directions for controlling the PA content in persimmon fruit
The optimized breeding of PCNA persimmon requires an efficient method for identifying and discarding individuals with the undesirable astringency trait at an early stage. Thus, molecular DNA markers that can distinguish astringent individuals from the other PCNA individuals in their juvenile phase will be needed for efficient breeding programs. It is important to note that, according to the genome resequencing results in this study (Fig. 1), it was confirmed that it is currently impossible to fully screen out these astringent individuals based on genetic polymorphism features within the delimited AST region. The current findings suggest that variations in the number of tannin cells, the PA level of tannin cells in fruit tissues, or the expression of WRKY44 may underpin the differences in astringency among predicted ast-homozygous individuals.
Because of the diversity in their astringency and tannin cell development, the astringent ast-homozygous individuals represent relevant materials for elucidating the mechanism underlying PA accumulation in persimmon fruit. Investigating PA accumulation using an ast-homozygous background will lead to a more comprehensive understanding of how PA accumulates in persimmon fruit in a more practical way, with WRKY44 potentially serving as a critical transcription factor regulating PA transport and tannin cell development in the ast background. An interesting observation was that the astringent ast-homozygous plants displayed lower levels of PA compared to non-PCNA plants, but exhibited the same level of astringency as non-PCNA plants in sensory tests (Fig. 2B). One possible explanation for this observation could be the chemical diversity of PA. In fact, an astringent individual with notably darker-colored tannin cells was observed (Fig. 3D). An analysis focusing on the chemical differences in PA, such as the composition of PA monomers (Akagi et al., 2010), would be an intriguing addition to future research. Furthermore, multiple candidate genes related to cellular process were identified, but their relationship with PA accumulation or tannin cell development remains to be elucidated. Because a persimmon transformation system has been established (Tao and Dandekar, 2000), investigating the functions of these candidate genes via genetic transformation experiments is a viable option.
Conclusion
Two predicted ast-homozygous individuals bearing very astringent fruit were identified in a population produced from a cross between ‘Taigetsu’ and ‘Kanshu’. Their AST genotype was inferred to be ast-homozygous through whole DNA-seq and PCR analyses. This conclusion is further supported by their PA accumulation patterns. It was confirmed that it is currently impossible to fully screen out these astringent individuals based on genetic polymorphism features within the delimited AST region. The fruit PA contents of the astringent individuals were higher than those of the other PCNA individuals. Moreover, tannin cell development in the two astringent plants was unique: One had more tannin cells than the other individuals, and the other had more PA-rich tannin cells. This increase in fruit PA content coincided with the enhanced expression of DkMYB4 and DkMYC1 in the two astringent individuals. Transcriptome analysis indicated the expression of DkANR and WRKY44 was significantly upregulated and positively correlated with the fruit PA content. Interestingly, genes related to cell wall metabolism, cytoskeleton modification, cell-cell communication and cell division were also differentially expressed, which is consistent with the cytological features of tannin cells in persimmon fruit tissue. These identified candidate genes may have key functions related to tannin cell differentiation and will be functionally characterized in future transformation experiments.
Literature Cited
- Akagi, T., A. Ikegami, T. Tsujimoto, S. Kobayashi, A. Sato, A. Kono and K. Yonemori. 2009a. DkMyb4 is a Myb transcription factor involved in proanthocyanidin biosynthesis in persimmon fruit. Plant Physiol. 151: 2028–2045.
- Akagi, T., A. Ikegami, Y. Suzuki, J. Yoshida, M. Yamada, A. Sato and K. Yonemori. 2009b. Expression balances of structural genes in shikimate and flavonoid biosynthesis cause a difference in proanthocyanidin accumulation in persimmon (Diospyros kaki Thunb.) fruit. Planta 230: 899–915.
- Akagi, T., Y. Suzuki, A. Ikegami, H. Kamitakahara, T. Takano, F. Nakatsubo and K. Yonemori. 2010. Condensed tannin composition analysis in persimmon (Diospyros kaki Thunb.) fruit by acid catalysis in the presence of excess phloroglucinol. J. Japan. Soc. Hort. Sci. 79: 275–281.
- Akagi, T., I. M. Henry, R. Tao and L. Comai. 2014. A Y-chromosome–encoded small RNA acts as a sex determinant in persimmons. Science 346: 646–650.
- Alexa, A., J. Rahnenführer and T. Lengauer. 2006. Improved scoring of functional groups from gene expression data by decorrelating GO graph structure. Bioinformatics 22: 1600–1607.
- Berardini, T. Z., S. Mundodi, L. Reiser, E. Huala, M. Garcia-Hernandez, P. Zhang, L. A. Mueller, J. Yoon, A. Doyle, G. Lander, N. Moseyko, D. Yoo, I. Xu, B. Zoeckler, M. Montoya, N. Miller, D. Weems and S. Y. Rhee. 2004. Functional annotation of the Arabidopsis genome using controlled vocabularies. Plant Physiol. 135: 745–755.
- Chen, S., Y. Zhou, Y. Chen and J. Gu. 2018. Fastp: An ultra-fast all-in-one FASTQ preprocessor. Bioinformatics 34: i884–i890.
- Cheng, C.-Y., V. Krishnakumar, A. P. Chan, F. Thibaud-Nissen, S. Schobel and C. D. Town. 2017. Araport11: a complete reannotation of the Arabidopsis thaliana reference genome. Plant J. 89: 789–804.
- Dixon, R. A. and S. Sarnala. 2020. Proanthocyanidin biosynthesis—a matter of protection. Plant Physiol. 184: 579–591.
- Dobin, A., C. A. Davis, F. Schlesinger, J. Drenkow, C. Zaleski, S. Jha, P. Batut, M. Chaisson and T. R. Gingeras. 2013. STAR: ultrafast universal RNA-seq aligner. Bioinformatics 29: 15–21.
- Duan, Z. and M. Tominaga. 2018. Actin-myosin XI: an intracellular control network in plants. Biochem. Biophys. Res. Commun. 506: 403–408.
- Fu, J., H. Liu, J. Hu, Y. Liang, J. Liang, T. Wuyun and X. Tan. 2016. Five complete chloroplast genome sequences from Diospyros: genome organization and comparative analysis. PLoS One 11: e0159566. DOI: 10.1371/journal.pone.0159566.
- Fulton, L., M. Batoux, P. Vaddepalli, R. K. Yadav, W. Busch, S. U. Andersen, S. Jeong, J. U. Lohmann and K. Schneitz. 2009. DETORQUEO, QUIRKY, and ZERZAUST represent novel components involved in organ development mediated by the receptor-like kinase STRUBBELIG in Arabidopsis thaliana. PLoS Genet. 5: e1000355. DOI: 10.1371/journal.pgen.1000355.
- Garrison, E. and G. Marth. 2012. Haplotype-based variant detection from short-read sequencing. arXiv preprint arXiv: 1207.3907. DOI: 10.48550/arXiv.1207.3907.
- Gerard, D., L. F. V. Ferrão, A. A. F. Garcia and M. Stephens. 2018. Genotyping polyploids from messy sequencing data. Genetics 210: 789–807.
- Gil-Muñoz, F., J. A. Sánchez-Navarro, C. Besada, A. Salvador, M. L. Badenes, M. del Mar Naval and G. Ríos. 2020. MBW complexes impinge on anthocyanidin reductase gene regulation for proanthocyanidin biosynthesis in persimmon fruit. Sci. Rep. 10: 3543. DOI: 10.1038/s41598-020-60635-w.
- Hamada, K., K. Hasegawa and T. Ogata. 2009. The growth of tannin cells from before flowering to fruit maturity and astringency in Japanese persimmons. J. Hortic. Sci. Biotech. 84: 72–76.
- Harada, H., H. Itamura, S. Taira and G.-H. Zheng. 1990. Natural removal of astringency in PCNA persimmon fruit cv. ‘Jiro’ grown in some different districts of Japan. J. Japan. Soc. Hort. Sci. 58: 807–811.
- Herger, A., K. Dünser, J. Kleine-Vehn and C. Ringli. 2019. Leucine-rich repeat extensin proteins and their role in cell wall sensing. Curr. Biol. 29: R851–R858.
- Huang, S., L. Blanchoin, D. R. Kovar and C. J. Staiger. 2003. Arabidopsis capping protein (AtCP) is a heterodimer that regulates assembly at the barbed ends of actin filaments. J. Biol. Chem. 278: 44832–44842.
- Ikeda, I., M. Yamada, A. Kurihara and T. Nishida. 1985. Inheritance of astringency in Japanese persimmon. J. Japan. Soc. Hort. Sci. 54: 39–45.
- Ikegami, A., K. Yonemori, A. Sugiura, A. Sato and M. Yamada. 2004. Segregation of astringency in F1 progenies derived from crosses between pollination-constant, nonastringent persimmon cultivars. HortScience 39: 371–374.
- Ishida, T., S. Hattori, R. Sano, K. Inoue, Y. Shirano, H. Hayashi, D. Shibata, S. Sato, T. Kato, S. Tabata, K. Okada and T. Wada. 2007. Arabidopsis TRANSPARENT TESTA GLABRA2 is directly regulated by R2R3 MYB transcription factors and is involved in regulation of GLABRA2 transcription in epidermal differentiation. Plant Cell 19: 2531–2543.
- Kanzaki, S., T. Akagi, T. Masuko, M. Kimura, M. Yamada, A. Sato, N. Mitani, N. Ustunomiya and K. Yonemori. 2010. SCAR markers for practical application of marker-assisted selection in persimmon (Diospyros kaki Thunb.) breeding. J. Japan. Soc. Hort. Sci. 79: 150–155.
- Kitamura, S., F. Matsuda, T. Tohge, K. Yonekura-Sakakibara, M. Yamazaki, K. Saito and I. Narumi. 2010. Metabolic profiling and cytological analysis of proanthocyanidins in immature seeds of Arabidopsis thaliana flavonoid accumulation mutants. Plant J. 62: 549–559.
- Kono, A., S. Kobayashi, N. Onoue and A. Sato. 2016. Characterization of a highly polymorphic region closely linked to the AST locus and its potential use in breeding of hexaploid persimmon (Diospyros kaki Thunb.). Mol. Breed. 36: 1–13.
- Lepiniec, L., I. Debeaujon, J. M. Routaboul, A. Baudry, L. Pourcel, N. Nesi and M. Caboche. 2006. Genetics and biochemistry of seed flavonoids. Annu. Rev. Plant Biol. 57: 405–430.
- Li, B. and C. N. Dewey. 2011. RSEM: accurate transcript quantification from RNA-seq data with or without a reference genome. BMC Bioinformatics 12: 323. DOI: 10.1186/1471-2105-12-323.
- Li, L., Z. He, G. K. Pandey, T. Tsuchiya and S. Luan. 2002. Functional cloning and characterization of a plant efflux carrier for multidrug and heavy metal detoxification. J. Biol. Chem. 277: 5360–5368.
- Li, H., B. Handsaker, A. Wysoker, T. Fennell, J. Ruan, N. Homer, G. Marth, G. Abecasis and R. Durbin. 2009. The sequence alignment/map format and SAMtools. Bioinformatics 25: 2078–2079.
- Li, H. and R. Durbin. 2009. Fast and accurate short read alignment with Burrows–Wheeler transform. Bioinformatics 25: 1754–1760.
- Li, Y. G., G. Tanner and P. Larkin. 1996. The DMACA-HCl protocol and the threshold proanthocyanidin content for bloat safety in forage legumes. J. Sci. Food Agric. 70: 89–101.
- Love, M. I., W. Huber and S. Anders. 2014. Moderated estimation of fold change and dispersion for RNA-seq data with DESeq2. Genome Biol. 15: 1–21.
- Marinova, K., L. Pourcel, B. Weder, M. Schwarz, D. Barron, J.-M. Routaboul, I. Debeaujon and M. Klein. 2007. The Arabidopsis MATE transporter TT12 acts as a vacuolar flavonoid/H+-antiporter active in proanthocyanidin-accumulating cells of the seed coat. Plant Cell 19: 2023–2038.
- Mitani, N., A. Kono, M. Yamada, A. Sato, S. Kobayashi, Y. Ban, T. Ueno, M. Shiraishi, S. Kanzaki, T. Tsujimoto and K. Yonemori. 2014a. Practical marker-assisted selection using two SCAR markers for fruit astringency type in crosses of ‘Taiten’ × PCNA cultivars in persimmon breeding. Sci. Hortic. 170: 219–223.
- Mitani, N., A. Kono, M. Yamada, A. Sato, S. Kobayashi, Y. Ban, T. Ueno, M. Shiraishi, S. Kanzaki, T. Tsujimoto and K. Yonemori. 2014b. Application of marker-assisted selection in persimmon breeding of PCNA offspring using SCAR markers among the population from the cross between Non-PCNA ‘Taigetsu’ and PCNA ‘Kanshu’. HortScience 49: 1132–1135.
- Mulvey, H. and L. Dolan. 2023. RHO GTPase of plants regulates polarized cell growth and cell division orientation during morphogenesis. Curr. Biol. 33: 2897–2911.
- Nishiyama, S., N. Onoue, A. Kono, A. Sato, K. Yonemori and R. Tao. 2018a. Characterization of a gene regulatory network underlying astringency loss in persimmon fruit. Planta 247: 733–743.
- Nishiyama, S., N. Onoue, A. Kono, A. Sato, K. Ushijima, H. Yamane, R. Tao and K. Yonemori. 2018b. Comparative mapping of the ASTRINGENCY locus controlling fruit astringency in hexaploid persimmon (Diospyros kaki thunb.) with the diploid D. lotus reference genome. Hort. J. 87: 315–323.
- Nishiyama, S. and K. Yonemori. 2022. Japanese PCNA. In R. Tao and Z. Luo (eds.). The persimmon genome. Springer International Publishing, Cham. 143–153.
- Onoue, N., S. Kobayashi, A. Kono and A. Sato. 2018. SSR-based molecular profiling of 237 persimmon (Diospyros kaki Thunb.) germplasms using an ASTRINGENCY-linked marker. Tree Genet. Genomes 14: 28. DOI: 10.1007/s11295-018-1239-z.
- Parinthawong, N., S. Cottier, A. Buchala, C. Nawrath and J.-P. Métraux. 2015. Localization and expression of EDS5H a homologue of the SA transporter EDS5. BMC Plant Biol. 15: 135. DOI: 10.1186/s12870-015-0518-1.
- Riento, K. and A. J. Ridley. 2003. Rocks: Multifunctional kinases in cell behaviour. Nat. Rev. Mol. Cell Biol. 4: 446–456.
- Sato, A. and M. Yamada. 2016. Persimmon breeding in Japan for pollination-constant non-astringent (PCNA) type with marker-assisted selection. Breed. Sci. 66: 60–68.
- Schluttenhofer, C. and L. Yuan. 2015. Regulation of specialized metabolism by WRKY transcription factors. Plant Physiol. 167: 295–306.
- Schneider, C. A., W. S. Rasband and K. W. Eliceiri. 2012. NIH Image to ImageJ: 25 years of image analysis. Nat. Methods 9: 671–675.
- Soneson, C., M. I. Love and M. D. Robinson. 2016. Differential analyses for RNA-seq: Transcript-level estimates improve gene-level inferences. F1000Res. 4: 1–19.
- Su, F., J. Hu, Q. Zhang and Z. Luo. 2012. Isolation and characterization of a basic Helix-Loop-Helix transcription factor gene potentially involved in proanthocyanidin biosynthesis regulation in persimmon (Diospyros kaki Thunb.). Sci. Hortic. 136: 115–121.
- Sugiura, A. and T. Tomana. 1983. Relationships of ethanol production by seeds of different types of Japanese persimmons and their tannin content. HortScience 18: 319–321.
- Suo, Y., P. Sun, H. Cheng, W. Han, S. Diao, H. Li, Y. Mai, X. Zhao, F. Li and J. Fu. 2020. A high-quality chromosomal genome assembly of Diospyros oleifera Cheng. Gigascience 9: 1–10.
- Tao, R. and A. M. Dandekar. 2000. Genetic transformation of Diospyros kaki L. (Japanese persimmon). p. 77–87. In: Y. P. S. Bajaj (ed.). Biotechnology in agriculture and forestry 44: Transgenic Trees. Springer-Verlag, Berlin.
- Tessmer, M. A., R. A. Kluge and B. Appezzato-da-Glória. 2014. The accumulation of tannins during the development of ‘Giombo’ and ‘Fuyu’ persimmon fruits. Sci. Hortic. 172: 292–299.
- Vaddepalli, P., A. Herrmann, L. Fulton, M. Oelschner, S. Hillmer, T. F. Stratil, A. Fastner, U. Z. Hammes, T. Ott, D. G. Robinson and K. Schneitz. 2014. The C2-domain protein QUIRKY and the receptor-like kinase STRUBBELIG localize to plasmodesmata and mediate tissue morphogenesis in Arabidopsis thaliana. Development 141: 4139–4148.
- Wan, C. Y. and T. A. Wilkins. 1994. A modified hot borate method significantly enhances the yield of high-quality RNA from cotton (Gossypium hirsutum L.). Anal. Biochem. 223: 7–12.
- Wu, S.-Z. and M. Bezanilla. 2014. Myosin VIII associates with microtubule ends and together with actin plays a role in guiding plant cell division. Elife 3: e03498. DOI: 10.7554/eLife.03498.
- Xiao, Y., X. Wu, D. Liu, J. Yao, G. Liang, H. Song, A. M. Ismail, J.-S. Luo and Z. Zhang. 2020. Cell wall polysaccharide-mediated cadmium tolerance between two Arabidopsis thaliana ecotypes. Front. Plant Sci. 11: 473. DOI: 10.3389/fpls.2020.00473.
- Xu, W., C. Dubos and L. Lepiniec. 2015. Transcriptional control of flavonoid biosynthesis by MYB-bHLH-WDR complexes. Trends Plant Sci. 20: 176–185.
- Yamada, M. 1993. Persimmon breeding in Japan. JARQ 27: 33–37.
- Yamada, M. and A. Sato. 2001. Japanese persimmon selection ‘Kaki Okitsu-20’. Bull. Natl. Inst. Fruit Tree Sci. 35: 121–126 (In Japanese with English abstract).
- Yonemori, K. and J. Matsushima. 1985. Property of development of the tannin cells in non-astringent type fruits of Japanese persimmon (Diospyros kaki) and its relationship to natural deastringency. J. Japan. Soc. Hort. Sci. 54: 201–208.
- Yonemori, K. and J. Matsushima. 1987a. Morphological characteristics of tannin cells in Japanese persimmon fruit. J. Amer. Soc. Hort. Sci. 112: 812–817.
- Yonemori, K. and J. Matsushima. 1987b. Changes in tannin cell morphology with growth and development of Japanese persimmon fruit. J. Amer. Soc. Hort. Sci. 112: 818–821.
- Yonemori, K., C. Honsho and S. Kanzaki. 2008. Sequence analyses of the ITS regions and the mat K gene for determining phylogenetic relationships of Diospyros kaki (persimmon) with other wild Diospyros (Ebenaceae) species. Tree Genet. Genomes 4: 149–158.
- Zhang, H., F.-G. Zhao, R.-J. Tang, Y. Yu, J. Song, Y. Wang, L. Li and S. Luan. 2017. Two tonoplast MATE proteins function as turgor-regulating chloride channels in Arabidopsis. Proc. Natl. Acad. Sci. USA 114: E2036–E2045.

