Introduction
Ca2+ serves as a second messenger in eukaryotes, playing crucial roles in plant development and stress responses. The regulation of development and stress responses involves alterations in the concentration of cytoplasmic Ca2+, which is targeted by stimuli. Plant cells maintain a low cytosolic concentration of free Ca2+ compared to that of the apoplast, vacuoles, and endoplasmic reticulum under normal conditions, and alterations in these concentrations play a vital role as secondary messengers for downstream signaling. These changes are detected by Ca2+-sensing proteins, such as calmodulin (CaM) (Amagaya et al., 2020; Sanders et al., 2002). Because of the biological significance of Ca2+ signaling, genetically encoded Ca2+ indicators have been developed to measure Ca2+ concentration and monitor Ca2+ signaling within living cells. These indicators include Aequorin, Yellow Cameleon, and GCaMP (Hamamura et al., 2014). This study specifically focused on GCaMP.
GCaMP is a fluorescence protein consisting of a green fluorescence protein, CaM, and the CaM-binding domain from avian smooth muscle myosin light-chain kinase (M13). It has been genetically engineered to measure the concentration of intracellular Ca2+ (Koldenkova and Nagai, 2013; Nakai et al., 2001). Various types of GCaMP have been developed through modifications, including GCaMP2 to GCaMP6 (Yang et al., 2018). GCaMP6, which was used in this study, is a more sensitive Ca2+ indicator (Chen et al., 2013; Ding et al., 2014). When GCaMP6 binds with cellular Ca2+, it emits fluorescence, which diminishes upon disassociation (Tian et al., 2009). Ca2+ signaling can be visualized in vivo in transgenic organisms that express GCaMP6. While GCaMP6 has predominantly been used in animals since the early 2010s (Chen et al., 2013), its application in plants has been rare and it has mostly been used in the model plant Arabidopsis root (Luo et al., 2020).
Valuable observations have been made by monitoring free Ca2+ in cells via the chemical or physical loading of cells with Ca2+ indicator dyes such as calcium green, which have the advantage of not requiring transformation. However, there are limitations, such as uneven loading and damage to the cells. Genetically encoded Ca2+ indicators are suitable for use over a relatively longer timescale because they do not have any restrictions in terms of dye loading and are also useful for spatial targeting as they allow subcellular targeting. Therefore, it was worthwhile to develop its use in this study, which targeted the whole fruit tissue to investigate fruit Ca2+ signaling. These discussions are drawn from relatively recent articles about genetically encoded Ca2+ indicators (Kleist et al., 2017; Krogman et al., 2020; Luo et al., 2020; Wu et al., 2019).
This study focused on the development of fruit, which is a research topic distinct from previous studies on vegetative organs, such as flower bud formation, pollination, fertilization, fruit set, cell division, cell enlargement, seed formation, and ripening. Fruit exhibits unique environmental responses and signal exchanges with other plant organs (Ito et al., 2022; Kanayama, 2017; Nicolas et al., 2023). Gene expression patterns markedly differ between fruit and vegetative organs (Shukla et al., 2017; Xu et al., 2023; Zouine et al., 2014). While Ca2+ signals play a crucial role in plant development and environmental responses, it is essential to specifically analyze Ca2+ signaling in fruit because of its unique characteristics. Therefore, our study focused on utilizing GCaMP6 in fruit. Examining and imaging Ca2+ signaling in fruit enhances understanding of the relationship between Ca2+ signaling and fruit growth or environmental responses and also elucidates the mechanisms underlying physiological disorders, as Ca2+ is thought to be implicated in various fruit crop disorders (Ikeda and Kanayama, 2015; Suzuki et al., 2019). In this study, we investigated the effects of sugars, which are involved in fruit growth, and cold, glutamate, and salt treatments, which are involved in environmental stress responses, on GCaMP6 fluorescence to demonstrate that Ca2+ concentrations can be measured in fruit, as well as to elucidate the fruit Ca2+ signaling mechanisms that respond to each stimulus.
Tomato is the most produced vegetable worldwide, with an annual production of approximately 187 million tons (FAO, 2021). Over the years, tomato production has steadily increased annually, with the continuous advancements in production systems and the development of new cultivars. The tomato fruit is rich in various health-promoting components, thus prompting research across diverse fields of study from genetics to physiology (Ikeda et al., 2016; Xiao et al., 2022). Therefore, the tomato genome sequence was analyzed early on, establishing it as a model plant for fruit research (The Tomato Genome Consortium, 2012). Therefore, we employed transgenic tomato plants transformed with GCaMP6 to pioneer and broaden the application of GCaMP6 in fruits, as well as investigating Ca2+ signaling in fruit.
Materials and Methods
Plant growth and transformation
For the transformation process, a vector containing the cauliflower mosaic virus 35S promoter, GCaMP6, and the nos terminator inserted into pPZP211, a plant binary vector, was used (Supplementary Fig. S1) (Chen et al., 2013). The transformation of tomato plants (Solanum lycopersicum cv. Micro-Tom) followed the method described by Sun et al. (2006). More than 10 transformants were selected for further investigation, and a line that was T2 homozygous and had the highest GCaMP6 gene expression was finally selected and used. Seeds were sterilized with a sodium hypochlorite solution and planted on filter paper under aseptic conditions. Cotyledons from plants approximately one week after planting were used for fluorescence observations via confocal microscopy. For other observations, seedlings around one week after germination were transplanted into 5 cm cubes of rockwool blocks (MU 50/50; Grodan, Roermond, Netherlands) and cultivated in OAT House solution A, which was prepared by dissolving OAT House No. 1 and No. 2 in tap water (OAT Agrio Co., Ltd., Tokyo, Japan). The plants were grown in growth chambers (LH-240, LH-241; Nippon Medical & Chemical Instruments Co., Ltd., Osaka, Japan) under a photon flux density of 88 μmol·m−2·s−1 on the rockwool surface with a photoperiod of 16 h light (25°C)/8 h dark (20°C). Lateral buds were removed as required. At least 10 individuals were cultivated for each experiment, from which the number of replicates of fruits and leaves indicated in each figure was used.
Fluorescence observations in transgenic and wild-type plants
The adaxial side of the cotyledons was observed using confocal microscopy (C1si; Nikon, Tokyo, Japan), with excitation by a continuous wave solid-state laser with a peak wavelength at 488 nm and emission detection at 500–530 nm. For other observations, fruit 15 days after flowering (DAF) were longitudinally cut with a razor, and their surfaces were examined using a chemiluminescence system (Fusion Solo S; VILBER LOURMAT, Marne-la-Vallee, France). Fusion Solo S was used, and fluorescence was measured with excitation at 480 nm with a blue LED with emission detected at 565 nm. The fluorescence intensity was defined as the sum of the fluorescence intensity of the targeted tissues divided by the number of pixels, which represents the fluorescence signal per unit area.
Effect of fruit cutting on fluorescence intensity
The centers of 14–16 DAF fruits were longitudinally cut into 1 mm thick slices using a razor and affixed to a black medicine dish (7 mL, 44 × 44 mm; Lab Logistics Group GmbH, Meckenheim, Germany) with glue (#05274; Toagosei Co., Ltd., Tokyo, Japan). These fruit slices were immersed in 2 mL of water 60 s after cutting. Measurements were started 90 s after cutting, and fluorescence intensity was recorded at 15-min intervals using the Fusion Solo S system. The fluorescence intensity was defined as the sum of the fluorescence intensity of the targeted tissues divided by the number of pixels, which represents the fluorescence signal per unit area.
Effect of cold shock, glutamate treatment, salt stress, and sugar treatment on fluorescence intensity
Fruit (14–16 DAF) slices were prepared and affixed to a black medicine dish as described above. Thereafter, 2 mL of water was added 90 s after cutting, and the slices were incubated at room temperature for 3 h before undergoing cold shock, glutamate, and salt stress treatments as described below. For the cold shock treatment, water was removed after 3 h of incubation, and 2 mL of 4°C water was added to the fruit 10 s later. In the control group, 2 mL of room temperature water was added instead of cold water. For the glutamate and salt stress treatments, 200 μL of 11 mM L-glutamic acid (final concentration of 1 mM) and 1.1 M sodium chloride (final concentration of 100 mM) were added to the fruit 30 s after 3 h of incubation. The sugar treatments were performed similarly, and glucose, fructose, and sucrose were used. Here 200 μL of 1,100, 110, and 11 mM sugar solutions were added to the fruit for a final concentration of 100, 10, and 1 mM, respectively. In the control group, 200 μL of water was added instead of each sugar solution. Measurements using the Fusion Solo S system were initiated 5 s after each treatment, and fluorescence intensity was recorded for 2 min at 5 s intervals. The fluorescence intensity was defined as the sum of the fluorescence intensity of the targeted tissues divided by the number of pixels, which represents the fluorescence signal per unit area.
Comparison of fluorescence intensity between fruit tissues during the early stages of fruit development
Fruit at 10, 15, and 20 DAF were used for this experiment. The localization of fluorescence intensity within the fruit was assessed using the maximal (Fmax) and minimal (Fmin) fluorescence intensity, as previously described by Nakai et al. (2001). The end of the 3 h incubation period after slice preparation was defined as time 0 (T0), and the targeted fluorescence intensity (F) was measured at T0. Water was replaced with 4°C water 30 s after T0, and Fmax was measured 35 s after T0. Subsequently, EGTA (final concentration of 10 mM) was added 65 s after T0, and Fmin was measured 1 h after the addition of EGTA. The values of (F—Fmin)/(Fmax—Fmin) were then calculated and used as the corrected values. The fluorescence intensity was defined as the sum of the fluorescence intensity of the targeted tissues divided by the number of pixels, which represents the fluorescence signal per unit area, while in the placenta, it was evaluated as the average value from 12 randomly selected points.
Results and Discussion
Fluorescence observations in transgenic and wild-type tomato plants
Using confocal microscopy, fluorescence was detected in the tomato cotyledons. Figure 1A shows the fluorescence image of epidermal cells on the adaxial side of the cotyledon, where fluorescence was observed in the cytosol along the cell contours and at what appeared to be the nucleus. In an enlarged image of the cell, GCaMP6 fluorescence seemed to localize in both the cytosol and nucleus (Fig. 1B). No fluorescence was observed in the wild-type plants (Fig. 1C). Previous studies have shown that GCaMP3 exhibits fluorescence in the cytosol and nucleus of tobacco leaves (DeFalco et al., 2017), while GCaMP6 does not display fluorescence in the nucleus of human cultured 293-F cells (Wu et al., 2019). These reports address the differences between plants and animals, as well as between GCaMP3 and GCaMP6. However, the number of reports regarding nuclear localization in plants is still small. Although localization in the nucleus and cytosol was shown in tomatoes (Fig. 1), it cannot be concluded whether nuclear localization is a common property among plants. In this study, GCaMP6 was demonstrated to function normally in the cytosol and was used in subsequent experiments. Ca2+ at high concentrations, after entering the cytosol, binds to Ca2+-binding proteins and initiates secondary messenger cascades, such as the activation of kinases and regulation of transcription factors in response to abiotic stresses (Krogman et al., 2020). Given the importance of tissue localization in this study, fluorescence throughout the fruit was observed using the Fusion Solo S chemiluminescence system (Fig. 2). Particularly strong fluorescence was observed in the pericarp, placenta, and seeds, while it was hardly observed in the wild-type fruit.


Until now, the use of GCaMP has been limited to experimental model plants, such as Arabidopsis transformed with GCaMP6 (Luo et al., 2020), GCaMP3 (Toyota et al., 2018), and GCaMP5 (Diao et al., 2018), and tobacco plants transformed with GCaMP3 (DeFalco et al., 2017). Figures 1 and 2 demonstrate that GCaMP can serve as a reliable Ca2+ indicator in tomatoes because of its subcellular localization, expression in fruit tissue, and minimal signal in wild-type plants. Moreover, the higher Ca2+ sensitivity and fluorescence intensity of GCaMP6 compared to GCaMP5 and GCaMP3 may have offered an advantage in examining the transgenic tomato plants generated in this study (Chen et al., 2013; Ding et al., 2014).
Effect of fruit cutting on fluorescence intensity
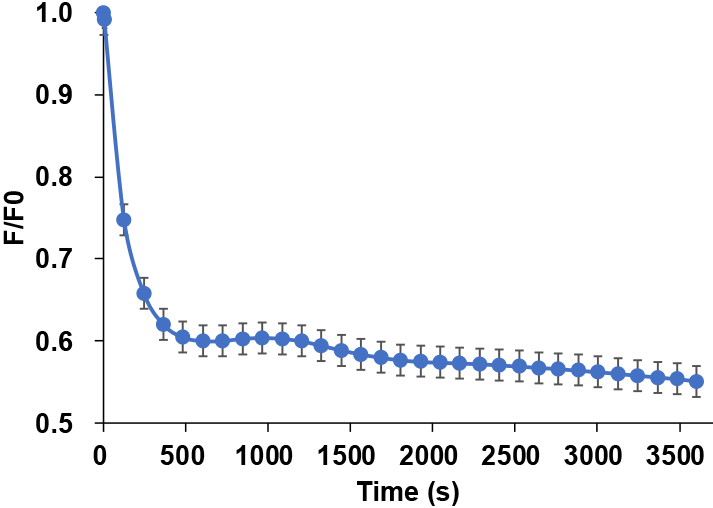
In contrast to the thin and small leaves and radicles that are commonly used in experimental model plants, fruit is thick and requires cutting to observe Ca2+ signaling on the fruit surface and within the internal tissues. However, plant response to injury triggers Ca2+ signaling (Beneloujaephajri et al., 2013; Toyota et al., 2018), and the increased fluorescence intensity resulting from cutting the fruit may interfere with the accurate measurement of targeted Ca2+ signaling. To address this issue, an experimental method was developed to eliminate the effect of fruit cutting. Initially, the fluorescence intensity increased following fruit cutting, but after leaving the fruit slices in water for 3 h (10,800 s), it decreased and stabilized (Fig. 3). The fluorescence intensity reached a steady state at 3 h post-cutting and fluctuated by no more than 5% across all five replicates.

Wound-induced Ca2+ responses have been studied in tobacco (DeFalco et al., 2017) and Arabidopsis (Toyota et al., 2018; Vincent et al., 2017a, b) plants to validate the functionality of Ca2+ sensors and ensure that fluorescence intensity corresponds to the cellular Ca2+ levels. In our study, fruit cutting increased the fluorescence intensity 2.1-fold (Supplementary Table S1). As described later, glutamate, which is known to initiate Ca2+ signaling (Toyota et al., 2018), elevated the fluorescence intensity. In addition, Ca2+ chelator EGTA reduced the fluorescence intensity, as described later. As responses to wounding, glutamate and EGTA are taken as evidence that the Ca2+ indicator is functional, so it can be concluded that the fluorescence intensity measured in our study indicated the cellular Ca2+ levels. Previous reports have described chemical treatments that were administered to tobacco leaf disks 4–6 h after incubation in water to eliminate the effects of leaf-cutting (DeFalco et al., 2017). Similarly, Arabidopsis leaf disks were soaked in water overnight before the addition of stimuli and fluorescence measurement (Zhao et al., 2021). By following a comparable approach and stabilizing the fluorescence intensity through water incubation post-cutting, we were able to analyze the Ca2+ signaling in fruit while mitigating the effects of wounding, as described in previous reports. Incubation post-cutting also eliminated the effects of changes in osmotic pressure as with cutting, but it is possible that mitigating changes in osmotic pressure by using sugar alcohols, for example, could produce better results, and this needs to be explored further. In subsequent experiments, various treatments were applied to fruit after 3 h of incubation in water, and to ensure accuracy, fluorescence intensity was adjusted using an untreated control.
Effect of cold shock, glutamate, and salt stress treatments on Ca2+ signaling in tomato
Cold shock immediately caused an approximately two-fold increase in fluorescence intensity compared to the control in tomato fruit (Fig. 4A, B). Following this peak signal, the fluorescence gradually decreased and returned to pretreatment levels. Cold shock in Arabidopsis roots induces a rapid increase in Ca2+ concentration within 10 s, resulting in a single peak of fluorescence intensity (Kiegle et al., 2000) similar to that observed in tomato fruit. In contrast, cold shock in tobacco leaves leads to a sharp increase in fluorescence intensity within a few seconds, followed by a decline to near pretreatment levels and a subsequent increase until 150 s after treatment (DeFalco et al., 2017). Our results, as well as those from previous studies, suggest that cold shock triggers a rapid and robust increase in Ca2+ concentration levels, but the response pattern in fruit and roots is likely different from that observed in leaves.

Glutamate is released upon injury to Arabidopsis leaves, initiating Ca2+ signaling in distant organs and triggering a Ca2+-based defense responses (Toyota et al., 2018). Fluorescence intensity begins to rise within tens of seconds after glutamate treatment and exhibits a single peak in tobacco leaves (DeFalco et al., 2017). Similarly, Arabidopsis roots also demonstrate that glutamate induces Ca2+ elevation (Krogman et al., 2020). In tomato fruit, fluorescence intensity likewise increased within tens of seconds after glutamate treatment (Fig. 4C). Consequently, it can be concluded from this study and previous reports that glutamate serves as a trigger for Ca2+ signaling and mediates wound responses across various organs (DeFalco et al., 2017; Krogman et al., 2020; Toyota et al., 2018).
Salt stress tolerance is a crucial survival strategy for plants, but it has even greater importance for fruit because salt stress can increase sugar content. However, the intricate physiological mechanisms, including signal transduction, underlying the salt stress response in fruit have not been fully elucidated (Kanayama, 2017). In tomato fruit, the fluorescence intensity following salt treatment increased at 15 s, peaked at 40 s, and then decreased (Fig. 4D). In Arabidopsis roots, salt treatment triggered Ca2+ spikes approximately ten times larger than those in the control group within seconds, followed by a rapid decrease (Kiegle et al., 2000). Although our study confirmed the results of previous research on immediate Ca2+ elevations due to salt stress, the fluorescence intensity in fruits increased by only 10%, which is smaller than the observed increase in Arabidopsis roots. When plants detect salt stress in roots, it induces Ca2+ signaling, which leads to subsequent long-distance Ca2+ signaling that triggers stress responses throughout the entire plant (Choi et al., 2014). Root Ca2+ signaling is also suggested as an early response to salt stress, as described in maize root protoplasts using another method employing a fluorescent probe (Lynch et al., 1989). However, salt treatment does not induce Ca2+ signaling in tobacco leaves, which implies that salt stress responses mediated by Ca2+ signaling are organ-specific (Graus et al., 2023).
Collectively, the rapid and robust response in roots is likely a crucial strategy for plant survival, while the response in the fruit contributes to an increase in sugar content. Ca2+ signals triggered by cold and salt stress indicated that Ca2+ signals initiate stress responses against abiotic stress in fruit. Moreover, it was suggested that the Ca2+ signaling response to salt stress in fruit differs from that of other organs.
Effect of sugars on Ca2+signaling in tomato fruit
Sugars are recognized for their dual role as both carbon sources and signal molecules (Keunen et al., 2013; Weber et al., 2005). Within fruit, sugars participate in fruit set and growth, as well as in the regulation of genes associated with sugar metabolism (Kanayama et al., 1998; Kanayama, 2017; Odanaka et al., 2002). However, understanding of the Ca2+ signaling mechanism at the molecular level in fruit remains incomplete, apart from a partial understanding of fruit morphology and ripening (Asai et al., 2013; Clevenger et al., 2015; Kamiyoshihara et al., 2010). Therefore, we investigated the relationship between Ca2+ signaling and sugars, which exhibit fruit-specific roles. Sugar concentrations in tomato fruits vary widely among the different sugar types, fruit developmental stages, and even among closely related species (Klann et al. 1993). It has been postulated that multiple sugar-sensing mechanisms in plants function at the subcellular, cellular, and organismal levels at different physiological sugar concentrations (Li and Sheen, 2016). Thus, we evaluated the responses at three different concentrations.
As glucose, fructose, and sucrose are the primary sugars found in fruit, their impact on fluorescence intensity was measured at various concentrations. At 100 mM, significant differences in fluorescence intensity were observed between glucose and fructose and between glucose and sucrose for the initial 40 s, whereas no such differences were found between fructose and sucrose (Fig. 5A). However, when compared to the addition of 100 mM of sugar, the addition of 10 mM fructose led to an increase in fluorescence intensity compared to glucose and sucrose (Fig. 5B). Furthermore, at the 1 mM concentration, the fluorescence intensity of both glucose and fructose was increased compared to that of sucrose, although no significant difference was observed between fructose and sucrose (Fig. 5C). The signals obtained here for the sugars were small compared to those for the other treatments shown in Figure 4.

In plants, glucose reportedly serves as a signal molecule via the glucose sensor hexokinase (Rolland et al., 2006). While the signaling mechanisms for fructose and sucrose in plants are largely unknown, it has been suggested that fructose may participate in hexokinase-independent sugar signaling in seedlings (Cho and Yoo, 2011). Our results indicate the presence of a fructose signaling system alongside glucose in fruit. The glucose- and fructose-induced Ca2+ signaling in tomato fruit suggests the existence of sugar sensors for both glucose and fructose, with their signals transmitted through Ca2+ signaling to regulate fruit development and metabolism. In addition, as changes in the fluorescence intensity varied depending on the sugar concentrations, it is likely that glucose and fructose sensors function independently and possess different affinities for sugars.
Comparison of fluorescence intensity between fruit tissues during the early stages of fruit development
When comparing fluorescence intensity across individuals, tissues, or developmental stages, the measured values are influenced by the concentration of the GCaMP6 protein. To address this, correction values were calculated based on previous reports (Dischler et al., 2022; Nakai et al., 2001): (F—Fmin)/(Fmax—Fmin), where F represents the targeted fluorescence intensity, Fmin is the minimum fluorescence intensity resulting from the application of a Ca2+ chelator (EGTA), and Fmax is the maximum fluorescence intensity achieved through ionophore application. Following the addition of the Ca2+ chelator EGTA to the fruit slices, fluorescence intensity decreased to approximately 60% and stabilized within 1 h post-treatment (Fig. 6); however, ionophore treatment did not result in a sharp increase in fluorescence intensity in the fruit slices. Similarly, an increase in fluorescence intensity in leaf disks was insufficient (DeFalco et al., 2017), while the response in culture cells was sharp (Dischler et al., 2022), making it challenging to use in plant tissues. Instead, Fmax was determined through cold shock treatment, as it elicited the most rapid and robust increase in fluorescence intensity across the various stimuli. This method is not necessarily general and is cumbersome; therefore, better methods, such as creating a fusion sensor with a standardized fluorescent protein, need to be developed. Moreover, in experiments where changes in fluorescence intensity are continuously monitored (Figs. 4 and 5), simple methods, such as using F/F0, are generally appropriate.
Ca2+ ions levels using (F—Fmin)/(Fmax—Fmin) were compared among the fruit tissues during the early stages of fruit development, which is a critical period that influences fruit growth and the onset of physiological disorders. When examining Ca2+ levels across the whole fruit at different developmental stages, no significant differences were observed (Fig. 7A). However, significant variations were detected when comparing Ca2+ levels between the fruit pericarp and placenta (Fig. 7B). Consequently, our focus shifted to the fruit pericarp, where the Ca2+ levels were then compared across the divided pericarp sections from the stem end to the blossom end. While the corrected values showed no significant differences at 10 and 20 DAF, Ca2+ levels in the blossom end were significantly lower than those in the stem end at 15 DAF, with values in the blossom end measuring half as much as those in the stem end (Fig. 7C). Although the comparison of the Ca2+ levels among the divided parts from the stem end to the blossom end using whole fruit tissues yielded similar results to those shown in Figure 7C, no significant differences were observed (Supplementary Fig. S3). Therefore, this imaging analysis method can accurately compare Ca2+ levels among tissues as it allows for the easy evaluation of fluorescence intensity across different tissues, such as the pericarp and placenta, from the blossom end to the stem end.

At 15 DAF, Ca2+ levels were found to be lower in the blossom end of the pericarp, and 15 DAF is critical for the development of tomato fruit as it marks the onset of cell enlargement and a high relative growth rate (Tanksley, 2004). As Ca2+ is a low-mobility element in plants, there may be an inadequate supply of Ca2+ to the fruit blossom end during the rapid growth stages (Ho et al., 1993; Ho and White, 2005). Moreover, compared to other species, tomato fruit exhibits lower Ca2+ concentrations (Watanabe et al., 2016). Our results are supported by previous studies. Furthermore, studies on blossom end rot, a significant physiological disorder in tomatoes that affects the pericarp of the blossom end, have suggested Ca2+ deficiency during the early stage of fruit development as the primary cause (Ikeda and Kanayama, 2015; Uozumi et al., 2012). Therefore, the lower Ca2+ levels observed in our study likely validate this previous suggestion.
Conclusions
The in vivo measurement of cellular Ca2+ concentration has been limited to the roots and leaves of model plants, such as Arabidopsis or tobacco. This study indicated the possibility of measuring Ca2+ levels in fruit, an organ of unique importance in horticulture and plant physiology. In addition, by analyzing Ca2+ signals in fruit, we can discern the organ-specific salt stress responses and concentration-dependent responses to hexose. Moreover, this study enabled the observation of Ca2+ distribution within the fruit during its early development stages. Previously, determining Ca2+ concentration primarily relied on extraction methods, in which the total Ca2+ was measured from the cell wall to the cytosol across whole fruit tissues. Here, a method to monitor physiologically relevant free Ca2+ and visualize its distribution within the fruit was introduced. The use of Ca2+ indicators in fruit has the potential to elucidate the relationship between Ca2+ and horticulturally important traits.

