Abstract
In this study, we examined marketing accountability by assessing the significance of the use of marketing and financial metrics in Japanese firms. Data related to both metrics was provided by 667 managers. The individual decision of marketing-mix activity served as our unit of analysis. We asked managers how many of the 15 marketing and 15 financial metrics proposed by Mintz and Currim (2013) they used. We concluded that the use of metrics contributes to improving performance; however, the relationship is not simple. Although managers using few metrics are likely to fail, the success of those that use many is not guaranteed either. We developed and examined an advanced model after reexamining Mintz and Currim’s study and determined that the control of reporting duty between vertical management layers was effective for using financial metrics. Top management control seems to increase effectiveness when using marketing metrics, but this effect diminishes when considering several control variables. Our additional cluster analysis identifies that the majority of our samples depend on fewer metrics with worse performance. The existence of this majority named “no metrics” implies that the relationship between metric use and performance can be linear or non-linear depending on the size of this cluster.
1 INTRODUCTION
Marketing accountability has recently captured a noticeable amount of research interest. Driving this boosted interest is an increasing awareness of the crisis of marketing (Webster, Malter, & Ganesan, 2003, 2005). Marketers are thought to lack the analytical skills required to link their marketing activities’ effectiveness with the financial performance of their organizations (Cassidy, Freeling, & Kiewell, 2005). Because marketing spending is regarded as soft money, it tends to be reduced or cut when financial pressure is high and greater accountability for capital costs is required. The pressure also comes from retailers who have increased influence over their suppliers’ marketing expenditure (Homburg, Workman, & Jensen, 2002; Workman, Homburg, & Jensen, 2003). Growing pressure to be accountable to the demands of stakeholders might also have furthered the declining influence of marketing departments within their firms.
Responding to these practical demands, marketing scholars have organized the marketing metric research into three categories. The first works on the development of metrics designed to measure customer-related performance, such as awareness, satisfaction, and the effect of marketing-mix activities (Ambler, 2003; Farris, Pfeifer, & Reibenstein, 2010). The second category seeks to connect marketing activities to financial metrics and monetary figures, such as net profit and return on investment (Srinivasan & Hanssens, 2009). The third assesses not only an individual metric’s effect but also how multiple metrics are used in different managerial contexts. Some research has examined the comprehensiveness of these various metrics (Homburg, Artz, & Wieseke, 2012), such as marketing dashboards (O’Sullivan & Abela, 2007). Others have listed the types of metrics that should be included in the line-up of these dashboards (Katsikeas, Morgan, Leonidou, & Hult, 2016). Mintz and Currim (2013) further contributed to the literature by examining the factors that drive management to employ various marketing and financial metrics. They found that firm strategy, metric orientation, type of marketing-mix activity, and environmental characteristics are more effective for explaining metric use than managerial characteristics. In terms of individual items, the relationships between antecedent factors and the use of marketing/financial metrics are nonlinear.
Mintz and Currim (2015) also examined the conditions wherein metric use is promoted by focusing on the factors that moderate the relationship between metric use and marketing performance. For example, they found that metric use in larger firms with stronger market orientation and worse recent business performance is associated with less improvement in marketing-mix performance. They argued that the non-linearity of the relationship between metric use and performance suggests that the incentives and/or the training programs offered to managers must be contingent upon the specific managerial conditions.
Following Mintz and Currim’s (2013, 2015) research stream, we conducted empirical research to examine whether marketing/financial metric use can lead to improved performance in Japanese firms. Our interest lies in determining whether the marketing metric research framework developed chiefly in the Western business and market environment could also be applied to different business and market environments.
Sales-marketing interface is the field of marketing organization research that has clarified where such cultural differences exist in different industries and countries (Homburg & Jensen, 2007). The various forms of sales-marketing interfaces might therefore produce different outcomes in metric use.
In the Western environment, conflicts between marketing and sales departments affect the controlling method. For example, an increase in the number of marketing metrics in use might disincentivize sales departments. Therefore, management must take this possible opportunism from the sales department into account and apply an appropriate set of metric scales (Kotler, Rackman, & Krishnaswany, 2006). Alternatively, in the Japanese environment, sales departments generally have more influence and are responsible for budget planning and accounting control. Takashima (2002) pointed out that Japanese sales departments are often engaged in creating and providing value for customers throughout the process: they develop products/services by interacting with R&D; they gather and review data from distributors/customers; and they maintain ongoing relationships with these stakeholders. This behavior implies that Japanese sales departments are not simply devoted to sales activities. Indeed, they also design marketing plans.
Therefore, Japanese managers, without mentioning marketing or sales managers, may operate differently from Western counterparts. In terms of budgeting or exploiting soft marketing money, does the Japanese managers’ use of marketing/financial metrics have a positive influence on the marketing-mix performance, as examined in Western culture? What kind of moderating effects exist that hinder or promote the use of effective metrics to increase performance?
Our research questions are therefore:
-
1)
Can Mintz and Currim’s (2013) findings be repeated in a different cultural setting?
-
2)
Which moderating variables should be included in a model that does not assume a simple linear relationship between metric use and performance?
To address these research questions, we conducted three analyses.
2 LITERATURE REVIEW AND HYPOTHESIS DEVELOPMENT
Our research procedure draws upon three contributions from the literature. First, we conducted a study to reexamine Mintz and Currim’s (2013) findings after reviewing literature regarding marketing accountability and the breadth of metrics. This study applies their findings in the context of a different cultural setting. Second, we referred to control theory (Ambler, Kokkinaki, & Puntoni, 2004) to create an advanced model that will exceed the performance of the earlier model created by Mintz and Currim. Finally, we reviewed literature regarding the marketing and sales managers’ job scopes to identify the distinct features of the cultural setting of Japanese firms.
2.1 Breadth of metrics
The problem of investing in indirect costs is closely related to the reason that marketing accountability matters (Fukutomi et al., 2017). During the ’90s, market-driven strategy (Day, 1990) or market orientation (Kohli & Jaworski, 1990; Narver & Slater, 1990) stimulated researchers’ efforts to cumulate studies regarding how an organization succeeds by becoming increasingly customer- and competitor-oriented and by increasing the smoothness of intra-organizational information flows. The role of marketing is expected to be that of an evangelist for these orientations by transforming information flows into knowledge (Moorman & Rust, 1999). Knowledge regarding marketing and its creativity influence the relative and departmental power of marketing by enabling the marketing function to exert significant influence on other departments, such as R&D or manufacturing (Verhoef & Leeflang, 2009). However, no matter how the marketing department insists on the importance of a market-driven strategy or market orientation, it may fail to overcome the budgeting problem and will conflict with the financial department. The marketing department must be prepared to justify investment in indirect costs, such as marketing. Verhoef and Leeflang included the construct of accountability as an antecedent to marketing influence and market orientation. Although their measurement of accountability had limitations because they depended on the participants’ subjective evaluation of accountability (i.e., asking participants if they are accountable), their findings attracted subsequent researchers to refine their construct.
Collaborative studies conducted by marketing and management accounting researchers led to the development of the concept of the use of metrics for measuring marketing accountability. Along with studies focusing on the variations of metrics (Ambler, 2000; Challagalla, Murtha, & Jaworski, 2014; Kosan, 2005), Katsikeas et al. (2016) provided knowledge regarding the types of metrics that may occasionally be useful. O’Sullivan and Abela (2007) examined marketing performance measurement ability, and noted that the use of a marketing dashboard leads to improved performance. Homburg, Artz, and Wieseke (2012, p. 75) conceptualized this dashboard’s comprehensiveness and proposed the CMPMS (Comprehensiveness of Marketing Performance Measurement Systems) concept by measuring “financial and nonfinancial measures” showing a “balanced picture of the marketing function,” the analytical orientation of “cause and effect relationship,” and a reflection of strategy in the metrics used. Moreover, they titled the balanced combination of metrics as “breadth.” Mintz and Currim (2013) conceptualized breadth with increased objectivity by counting the actual quantity of marketing and financial metrics used. They prepared 30 alternatives, comprising 15 specific marketing and 15 financial metrics, and asked managers how many metrics were used for a recent marketing-mix activity. The number of metrics used by a manager were noted as the “breadth of metrics.”
Mintz and Currim concluded that the breadth of both marketing and financial metrics influences performance positively. They conducted a similar study in 2015, and specified organizational, managerial, and environmental conditions wherein metric use is activated. A potential research arena exists for examining the external validity of their findings in a different setting. They warned that a simple linear relationship may not exist between the breadth of metrics and performance because too many metrics may cause information overload. Research has yet to further examine the non-linear relationship between metric use and performance.
With this background, we aimed to share the research questions of Mintz and Currim (2013) to evaluate the external validity of their findings. Our hypotheses for this reexamination are:
H1: The greater the use of marketing metrics, the greater the marketing-mix activity performance/business unit performance.
H2: The greater the use of financial metrics, the greater the marketing-mix activity performance/business unit performance.
We employed the 30 specific alternatives of marketing and financial metrics that they created. Our study aims to provide another perspective regarding the seemingly linear, but most likely, non-linear relationship between metric use and performance.
2.2 Control theory: Toward an advanced model
We used control theory to develop an advanced model that captures the non-linear relationship between metric use and performance. Ambler, Kokkinaki, and Puntoni (2004) referred to control theory to identify how organizations determine the reasons for metrics selection. The nature of managerial control is a comparison between operational plans and performance (Hulbert & Toy, 1977). Metrics or any performance measurement system can be used to control actions and performance.
Control theory highlights the importance of interactions between various management layers for enriching supervision and implementation (Ramaswami, 1996). As a generator and disseminator of information and knowledge (Homburg & Jensen, 2007; Kohli & Jaworski, 1990), the marketing function is responsible for promoting intraorganizational communication and arranging corrective actions when the planned performance is not achieved after the occurrence of any unanticipated events. Therefore, metric use for assessing marketing performance requires organizational involvement (Mintz & Currim, 2013; Noble & Mokwa, 1999) for designing, implementing, and monitoring specific marketing plans.
In this study, we introduce two concepts of managerial control over metric use. The first is the control of intraorganizational information flows by measuring how thoroughly metric use is monitored. The second is top management emphasis as an antecedent of an organization’s orientation (Jaworski & Kohli, 1993), and functional activities under the supervision of the controlling parties, such as top management (Chakrabarty, Brown, & Widing, 2012).
To examine the first concept, we considered the thoroughness of information flow control by calculating the number of metrics that managers are obligated to report to upper management layers and divide it by the number of metrics used. This concept tackles an ex-post procedure of metric use. On the contrary, the second concept—top management emphasis—existed prior to metric use. Therefore, to examine the second concept and top management control over the use of metrics, we calculated the ratio of the number of metrics used, divided by the metrics emphasized by the top management team. Therefore, we aimed to create an advanced model to examine the relationship between metric use and performance by including the examination of managerial control on information flows and top management control. Here we propose the following four hypotheses:
H3: The greater the ratio of the number of marketing metrics to be reported to the upper management divided by the number of total metrics used, the better the marketing-mix activity performance/business unit performance.
H4: The greater the ratio of the number of financial metrics to be reported to the upper management divided by the number of total metrics used, the better the marketing-mix activity performance/business unit performance.
H5: The greater the ratio of the number of marketing metrics used divided by the metrics emphasized by the top management team, the better the marketing-mix activity performance/business unit performance.
H6: The greater the ratio of the number of financial metrics used divided by the metrics emphasized by the top management team, the better the marketing-mix activity performance/business unit performance.
2.3 Characteristics of the marketing in Japanese firms: Sales managers’ broad job range
Control theory is built on two foundational propositions. First, information shall flow beyond certain boundaries. Second, the controller supervises those who are controlled. The theory is well applied to Western organizations; as Kotler, Rackham, and Krishnaswamy (2006) note, the marketing function is a controlling unit in an organization’s headquarters, whereas the sales function is dispersed among various local markets and is to be controlled. The marketing function is responsible for designing long-term sales plans, implementing these plans, and monitoring the opportunistic behavior of the sales force and its tendency to achieve quotas by adopting a sales orientation, instead of a customer orientation (Michaels & Day, 1985; Thomas, Soutar, & Ryan, 2001). Research has yet to develop solutions aimed at resolving the conflicts between these two functions (Dewsnap & Jobber, 2000; Montgomery & Webster, 1997).
However, the job ranges of marketing and sales departments in Japan are quite different from the West. Japanese sales departments are characterized by their wide job range. Nakanishi (2002) noted that Japanese sales departments are not just a sales force made up of selling personnel, whereas sales departments in the United States are positioned as a tactical element within the whole promotion strategy. Onzo (1995) and Takashima (2002) may have agreed that Japanese sales departments are engaged in various tasks ranging from coordination with R&D and distributors/customers to formulating overall marketing strategy. Thus, the boundary between sales and marketing functions/departments in Japan is more obscure than in the West. Our research target is Japanese marketing managers, but in fact, over 80% of the self-professed primary tasks of marketing managers’ are focused on sales (details are given in the following section on data selection). This is one piece of evidence that suggests that the boundary is obscure.
One of our research questions seeks to examine the applicability of Mintz and Currim’s (2013) insights. If they have universal applicability and metric use contributes to success in a different cultural setting, their insights may not presume departmental boundaries. For this reason, we do not specify the marketing department as a controller. Instead, we focus on information flows between hierarchical boundaries and supervision by top management in proposing our hypotheses.
The scales developed by Mintz and Currim (2013) will match with sales activities. According to McManus and Guilding’s (2008) review, literature regarding marketing lacks perspectives on customer-oriented performance measures. By contrast, sales studies focus on customer-oriented behavior. Alternative marketing metrics include customer-oriented measures such as satisfaction, preference, consideration sets, share of customer wallets, and eleven other items (Mintz & Currim, 2013, p. 20). Sales studies, on the contrary, tend to emphasize the incentives to achieve sales turnover (Zoltners, Sinha, & Lorimer, 2012). Other sales researchers have been taking note of the studies on empathy of the sales force toward customers (Pryor, Malshe, & Paradise, 2013), or their identification with the organization (Homburg, Wieseke, & Hoyer, 2009), managerial emphasis on emotional intelligence (Lassk & Shepherd, 2013), and psychological climate (Erevelles & Fukawa, 2013). However, they seem to ignore perspectives on financial aspects regarding how an organization achieves these desirable outcomes within a certain budget. Again, alternatives to financial metrics capture the solutions for this problem. We expect that metric use leads to better performance when the upper management layer moderates the effect of metric use by controlling marketing/sales activities.
3 METHOD
Our first objective is to reexamine Mintz and Currim’s (2013) findings; therefore, we employed a common unit of analysis and major research items. The unit of analysis is the individual decision of a marketing-mix activity. Managers were requested to select “a major marketing-mix decision undertaken not so recently that performance evaluation is premature and not so long ago that memory of the decision and its performance is fuzzy” (Mintz & Currim, 2013, p. 36). Ten types of activities are included: traditional advertising, internet advertising, direct-to-customer, social media, price promotions, pricing, new product development, sales force, distribution, and public relations/sponsorship. We also replicated these 10 types of activities in this study.
3.1 Data collection
Our data collection method comprised a survey. Through this survey, we aimed to examine how marketing and financial measures are used when managers are involved in decision-making related to marketing activities. Therefore, our research target is an individual who is above the assistant manager level and is in charge of marketing-related tasks, such as advertising, promotion, sales, public relations, or distribution. The survey participants are full-time employees at private firms based in Japan. Advertising agencies, cooperatives, and firms in the financial, research, and educational sectors were excluded. Mintz and Currim (2013) delivered invitations to several executive communities, and they also asked an individual manager to answer questions about several decisions. The data for this study were not acquired in exactly the same way as the original.
To avoid common method bias, we conducted surveys twice for each participant (Chang, Witteloostuijn, & Eden, 2010). The first survey contained all questions, whereas the second survey only included items related to dependent variables, that is performance. The first survey was conducted from October 20 to 22, 2016, and the second survey was conducted from November 24 to December 1, 2016. For the first survey, our questionnaire site remained open until we had collected over 800 answers from the monitors of a research agency. An invitation for the second survey was delivered to those who responded to the first survey. Respondents received several shopping points from the research agency (the amount was not disclosed) for their participation in the survey.
We collected a total of 824 and 798 samples, respectively, from the two surveys. Sales managers provided a significant portion of our samples. Among the total samples, 667 samples with complete answers were deemed usable for the study. The average profile of our respondents is a 48.13-(SD = 7.46)-year-old male (96.9%) working for a company with 200 or more employees (57.9%), at the maturity stage of a product life cycle (64.7%).
3.2 Measures
Managers were requested to provide the number of metrics they had used for each activity; they considered 15 marketing metrics and 15 financial metrics. Both metrics have 12 general items in common, whereas 3 other items were prepared, based on the different types of marketing-mix activities (Mintz & Currim, 2013, p. 29). The 12 general marketing metrics are market share, awareness, satisfaction, likeability, preference, willingness to recommend, loyalty, perceived quality, consideration set, total customers, share of customer wallet, and share of voice. The 12 general financial metrics are net profit, ROI, ROS, ROMI, net present value, EVA, marketing expenditures, stock prices/returns, Tobin’s q, target volume, customer segment profitability, and customer lifetime value. The participants were also queried regarding 6 specific metrics, based on the type of marketing-mix activity. For example, in decision-making related to the sales force, managers are requested to select whether they use new customer retention rate, the number of responses by campaign, or reach as marketing metrics. They responded as to whether they use sales funnel/pipeline, sales force productivity, or sales potential forecast as financial metrics. Table 1 shows that the managers use an average of 2.95 marketing metrics and 2.57 financial metrics.
Table 1
Descriptive statistics of scale items
| Metric Use |
Mean |
SD |
| # of metrics used |
|
Marketing |
2.95 |
3.80 |
|
Financial |
2.57 |
3.24 |
| # of metrics reported |
|
Marketing |
2.53 |
3.42 |
|
Financial |
2.52 |
3.23 |
| # of metrics emphasized |
|
Marketing |
2.12 |
2.99 |
|
Financial |
2.91 |
3.63 |
| Performance |
Marketing-mix activity performance
(relative to objectives)
(α = .864) |
Relative to your firm’s stated objectives, how is the last major marketing activity undertaken performing on: (1 = “much worse,” and 7 = “much better”) |
| Customer satisfaction |
4.22 |
1.06 |
| Profitability |
3.95 |
1.11 |
| Customer loyalty |
4.01 |
0.93 |
| Sales |
4.08 |
1.20 |
| Market share |
3.93 |
1.07 |
| ROI |
3.87 |
0.97 |
| Business unit performance (relative to competitors) (α = .893) |
Please rate the performance of your entire business unit relative to your major competitors: (1 = “much worse,” and 7 = “much better”) |
| Your business unit achieves higher profitability than competitors. |
3.93 |
1.29 |
| Your business unit provides products and services that are priced higher than those of your competitors. |
4.14 |
1.15 |
| Your business unit avoids price lowering. |
3.94 |
1.29 |
| Manufacturing in your business unit is more efficient than at your competitors. |
3.85 |
1.17 |
| Your business unit provides differentiated products and services. |
4.17 |
1.19 |
| Your business unit acquires more loyal customers more than your competitors. |
4.14 |
1.12 |
| The perceived quality of your products and services is higher than that of your competitors. |
4.34 |
1.13 |
| Your products and services are better known than your competitors’. |
4.27 |
1.24 |
| Your business unit invests in your brand from a long-term perspective. |
3.85 |
1.24 |
| Control Variables |
| Organizational Involvement (α = .855) |
How strongly do you agree or disagree with each of the following statements: (1 = “strongly disagree,” and 7 = “strongly agree”) |
| This marketing action was a real company-wide effort. |
4.14 |
1.04 |
| People from all over the organization were involved in this marketing action. |
4.01 |
1.09 |
| A wide range of departments or functions in the company got involved in this marketing action. |
4.01 |
1.10 |
| Metric-based compensation (α = .810) |
Please indicate how important each metric type is related to your compensation package: (1 = “not at all important,” and 7 = “extremely important”) |
| Overall metrics |
4.59 |
1.15 |
| Marketing metrics |
4.37 |
1.11 |
| Financial metrics |
4.55 |
1.14 |
| Metric training level (α = .916) |
Please indicate your level of training on the use of metrics (can be through work or educational experiences): (1 = “much less than average amount of training,” and 7 = “much more than average amount of training”) |
| Overall metrics |
3.86 |
1.37 |
| Marketing metrics |
3.81 |
1.31 |
| Financial metrics |
3.78 |
1.33 |
| Recent business performance (α = .849) |
To what extent did the overall performance of the business unit meet expectations last year: (1 = “poor,” and 7 = “excellent”) |
4.17 |
1.24 |
| To what extent did the overall performance of your business unit relative to your major competitors meet expectations last year: (1 = “poor,” and 7 = “excellent”) |
4.15 |
1.16 |
| B2C |
Please indicate the extent to which your sales come from B2B or B2C markets: (1 = “mostly B2B,” and 7 = “mostly B2C”) |
3.19 |
1.90 |
| Services |
Please indicate the extent to which your sales come from goods or services markets: (1 = “mostly goods,” and 7 = “mostly services”) |
3.48 |
1.98 |
| Industry concentration |
Approximately what percentage of sales does the largest 4 competing businesses in your market control: (0 = “0%–50%,” and 1 = “51%–100%”)* |
0%–50% 277 (41.5%) |
51%–100% 266 (39.9%) |
Market turbulence
(α = .184) |
How strongly do you agree or disagree with each of the following statements: (1 = “strongly disagree,” and 7 = “strongly agree”) |
| Products/services become obsolete very slowly in your firm’s principal industry. (R) |
3.79 |
1.26 |
| Your firm seldom needs to change its marketing practices to keep up with competitors. (R) |
4.12 |
1.10 |
| Consumer demand and preferences are very easy to forecast in your principal industry. (R) |
4.04 |
1.09 |
| Your firm must frequently change its production/service technology to keep up with competitors and/or consumer preferences. |
4.24 |
1.12 |
* 124 samples answered “unclear.”
(R) Reverse coded items.
For the examination of hypotheses H1 and H2, the performance is evaluated based on an organization’s stated objectives. We included performance measures related to competitors because they are commonly employed in other studies regarding metric use (Homburg, Artz, & Wieseke, 2012; O’Sullivan & Abela, 2007). The descriptive statistics of performance indices are also listed in Table 1. Table 2 presents the correlation matrix of the average scores of performance and metric use.
Table 2
Correlation matrix
|
|
|
1 |
2 |
3 |
4 |
5 |
6 |
7 |
8 |
9 |
10 |
11 |
12 |
13 |
14 |
15 |
16 |
| 1 |
# of metrics used |
Marketing |
1 |
|
|
|
|
|
|
|
|
|
|
|
|
|
|
|
| 2 |
|
Financial |
.717 *** |
1 |
|
|
|
|
|
|
|
|
|
|
|
|
|
|
| 3 |
# of metrics reported |
Marketing |
.668 *** |
.519 *** |
1 |
|
|
|
|
|
|
|
|
|
|
|
|
|
| 4 |
|
Financial |
.551 *** |
.698 *** |
.713 *** |
1 |
|
|
|
|
|
|
|
|
|
|
|
|
| 5 |
# of metrics emphasized |
Marketing |
.454 *** |
.335 *** |
.528 *** |
.385 *** |
1 |
|
|
|
|
|
|
|
|
|
|
|
| 6 |
|
Financial |
.369 *** |
.411 *** |
.364 *** |
.459 *** |
.663 *** |
1 |
|
|
|
|
|
|
|
|
|
|
| 7 |
Performance |
relative to objectives |
.084 ** |
.060 |
.081 ** |
.099 ** |
.073 * |
.079 ** |
1 |
|
|
|
|
|
|
|
|
|
| 8 |
|
relative to competitors |
.089 ** |
.022 |
.096 ** |
.028 |
.115 *** |
.095 ** |
.498 *** |
1 |
|
|
|
|
|
|
|
|
| 9 |
Organizational involvement |
.095 ** |
.118 *** |
.137 *** |
.109 ** |
.133 *** |
.098 ** |
.190 *** |
.209 *** |
1 |
|
|
|
|
|
|
|
| 10 |
Metric-based compensation |
.193 *** |
.163 *** |
.147 *** |
.144 *** |
.194 *** |
.212 *** |
.145 *** |
.200 *** |
.342 *** |
1 |
|
|
|
|
|
|
| 11 |
Metric training level |
.148 *** |
.141 *** |
.102 *** |
.124 *** |
.082 ** |
.106 *** |
.209 *** |
.199 *** |
.305 *** |
.349 *** |
1 |
|
|
|
|
|
| 12 |
Recent business performance |
.141 *** |
.095 ** |
.070 * |
.074 * |
.084 ** |
.048 |
.315 *** |
.334 *** |
.221 *** |
.249 *** |
.206 *** |
1 |
|
|
|
|
| 13 |
B2C |
.041 |
−.039 |
.050 |
−.026 |
.055 |
−.046 |
.052 |
.076 ** |
.043 |
−.059 |
.115 *** |
−.027 |
1 |
|
|
|
| 14 |
Services |
−.008 |
−.028 |
−.013 |
.015 |
−.051 |
−.080 ** |
.071 * |
.035 |
.007 |
.035 |
.089 ** |
.084 ** |
.248 *** |
1 |
|
|
| 15 |
Industry concentration |
.045 |
.014 |
.010 |
.027 |
.053 |
.065 |
.025 |
.046 |
.054 |
.013 |
−.027 |
−.003 |
−.050 |
−.088 ** |
1 |
|
| 16 |
Market turbulence |
.025 |
.031 |
.035 |
.061 |
.024 |
.046 |
.093 ** |
.048 |
−.042 |
.005 |
−.061 |
.012 |
.003 |
.031 |
−.073 * |
1 |
* p < .10, ** p < .05, *** p < .01
For the addition of variables deduced from control theory to examine H3–6, we used the same 30 items of marketing and financial metrics and requested managers to respond about the number of metrics they are obligated to report to the upper management and the number of metrics emphasized by the top management team. On average, managers reported that they were obligated to report 2.53 marketing and 2.52 financial metrics. The average top management team emphasizes 2.12 marketing and 2.91 financial metrics.
In addition, control variables were introduced. These variables had been hypothesized and empirically supported by Mintz and Currim (2013, p. 22) for their influence on the managers’ metric use. They are organizational involvement (Noble & Mokwa, 1999), metric-based compensation, metric-based training (Mintz & Currim, 2013), recent business performance (Jaworski & Kohli, 1993), B2B versus B2C, goods versus services (Verhoef & Leeflang, 2009), industry concentration (Kuester, Homburg, & Robertson 1999), and market turbulence (Miller, Burke, & Glick, 1998). Descriptive statistics and a correlation matrix for these control variables are listed in Tables 1 and 2. Industry concentration is a dummy variable.
To assess reliability and validity of measures, we conducted exploratory factor analysis for all scale items to reveal appropriate loadings higher than .6 for almost all items belonging to their constructs. Exceptionally, the second item of metric-based compensation shows .473, and all four items for market turbulence show loadings less than .5. We then calculated Cronbach’s alphas to show that the variable measuring market turbulence lacks reliability. Consequently, the other variables are calculated using the average scores of each scale item, and we took it into consideration that the items measuring market turbulence cannot be aggregated when we conducted the following analyses.
4 RESULTS
Based on our research questions, we conducted three analyses. The first reexamines the relationship between metric use and performance using the scale items in Mintz and Currim’s (2013) study; the second analysis includes the managerial control variables; and the third is an additional cluster analysis. Through the cluster analysis, we aimed to supplement the first and second analyses. Note that Harman’s one factor test also indicated no common method bias.
4.1 Analysis 1: Breadth of metrics
Table 3 lists the findings of our regression analyses. H1 and H2 are not supported. The relationship between the breadth of the metrics (i.e. the number of metrics used) and performance is not as clear and linear as it was in the original analysis. Only the number of marketing metrics used is related to performance suggesting some support for H1; however, the performance score is measured differently from the original. There must be conditions in which metric use contributes to success.
Table 3
Results of regression analysis (Analysis 1: A reexamination)
|
Mintz & Currim (2013, p. 31) |
|
This Study (N = 667) |
|
Effect on Marketing Mix Activity Performance |
|
Effect on Marketing Mix Activity Performance |
| # of metrics used |
relative to objectives |
relative to objectives |
relative to competitors |
| Marketing metrics |
.210 *** |
.083 |
.151 *** |
| Financial metrics |
.150 *** |
.001 |
−.086 |
|
system weighed R2 .210 |
adjusted R2 .004 |
adjusted R2 .009 |
Note *** p < .01
All coefficients are standardized.
Although our reexamination failed to reveal the same linear relationship between metric use and performance, this is within both our and the original authors’ assumptions.
Prior to the second analysis, we took the logarithms of the scores of information flow control and top management emphasis because the Japanese samples are characterized by their use of few metrics. Because the variable measuring market turbulence lacks validity, we evaluated five combinations and their coefficients of determination. When we include the second item measuring constant change in marketing practices in our model, the coefficient of determination scores higher than including the three other items individually or excluding all four market turbulence items.
Table 4 lists the results of the regression analysis examining whether the two types of managerial controls can serve as a key to interpret the relationship between metric use and performance. For those who answered “0” regarding the number of metrics reported or emphasized, the ratios could not be calculated. In these cases, the number of samples used is specified.
Table 4
Results of regression analysis (Analysis 2: An advanced model)
| Effect on Marketing-Mix Activity Performance (relative to objectives) |
|
Effect on Marketing-Mix Activity Performance (relative to objectives) |
|
Model 1 |
|
Model 2 |
|
Model 1 |
|
Model 2 |
| information flow control (N = 307) |
|
|
|
|
top management control (N = 288) |
|
|
|
| # of metrics reported / # of metrics used |
|
|
# of metrics used / # of metrics emphasized |
|
|
| Marketing metrics |
−.022 |
|
.012 |
|
Marketing metrics |
.154 ** |
|
.067 |
|
| Financial metrics |
.100 * |
|
.087 |
|
Financial metrics |
−.053 |
|
−.029 |
|
| log Marketing metrics |
|
.012 |
|
.025 |
log Marketing metrics |
|
.134 ** |
|
.077 |
| log Financial metrics |
|
.118 * |
|
.134 ** |
log Financial metrics |
|
−.070 |
|
−.042 |
| control variables |
|
|
control variables |
|
|
| Organizational involvement |
|
|
.138 ** |
.182 *** |
Organizational involvement |
|
|
.148 ** |
.161 ** |
| Metric-based compensation |
|
|
−.034 |
−.032 |
Metric-based compensation |
|
|
−.027 |
−.022 |
| Metric training level |
|
|
.174 *** |
.135 ** |
Metric training level |
|
|
.160 ** |
.202 *** |
| Recent business performance |
|
|
.187 *** |
.212 *** |
Recent business performance |
|
|
.190 *** |
.141 ** |
| B2C |
|
|
.024 |
.043 |
B2C |
|
|
.031 |
.043 |
| Services |
|
|
.041 |
.033 |
Services |
|
|
.075 |
.049 |
| Industry concentration |
|
|
.073 |
.044 |
Industry concentration |
|
|
.037 |
.032 |
| Market turbulence |
|
|
.103 * |
.094 |
Market turbulence |
|
|
.098 * |
.127 ** |
| adjusted R2 |
.004 |
.008 |
.119 |
.138 |
adjusted R2 |
.013 |
.007 |
.120 |
.126 |
* p < .10, ** p < .05, *** p < .01
All coefficients are standardized.
Logarithmic scores are indicated by “log.” In our test of H3–6, the maximum variance inflation factor (VIF) is 1.458. Therefore, there are no problems with multicollinearity throughout the analysis (Burns & Bush, 2000). The two findings will be summarized.
First, managerial control over the information flow of financial metrics (the ratio of the quantity of metrics reported to upper management divided by the number of financial metrics used) influences performance positively. H4 is supported. The ratio has a weaker positive influence on performance than do several control variables (Model 1 and 2 on the left of Table 4). Organizational involvement, metric training level, and recent business performance are better indicators of performance. The profile of our respondents leaned towards B2B and goods industries; however, these two control variables had no influence. Thus, managerial control over financial metric use does indeed have a positive effect on performance after considering the effects of control variables.
Second, top management control over marketing metrics (the ratio of marketing metrics used divided by the number of metrics emphasized by top management) influences performance slightly, but positively, without considering the influence of the control variables (Model 1 on the right of Table 4). Again, the ratio has a very weak effect on performance, and the effect vanishes when considering the influence of the control variables. The same set of control variables and constant change in marketing practices have positive influence on performance. Thus, H5 and H6 are not supported.
The problem with this second analysis is the use of ratios in the analysis, which may be high whenever a numerator and denominator are close, regardless of the number of metrics. To overcome this problem and to further investigate the relationship among metric use, performance, and managerial control, we conducted an additional cluster analysis.
4.3 Analysis 3: Metric clusters
We conducted a cluster analysis using six items: the numbers of marketing and financial metrics used, the numbers of both metrics reported, and the numbers emphasized by top management. First, we designated the appropriate number of clusters. The cubic clustering criterion (CCC) scores highest when we divide the 667 samples into 18 clusters; however, both the Bayesian and Akaike information criteria (BIC and AIC) scores are lowest when we divide the samples into 9 clusters. Regarding the 9 clusters, the fifth largest cluster consists of 29 samples that account for less than 5% of all samples. The fourth largest consists of 37 sample accounting for 5.55%. Therefore, we found that there are 3 larger clusters and other small clusters, regardless of whether 9 or 18 clusters are designated. Figure 1 illustrates the dendrogram of our cluster analysis; 3 or 4 sample clusters can be discussed. However, it must be noted that we reach the same conclusion when we divide our samples into any number of clusters. There will always be a large cluster of “no metrics” introduced later.
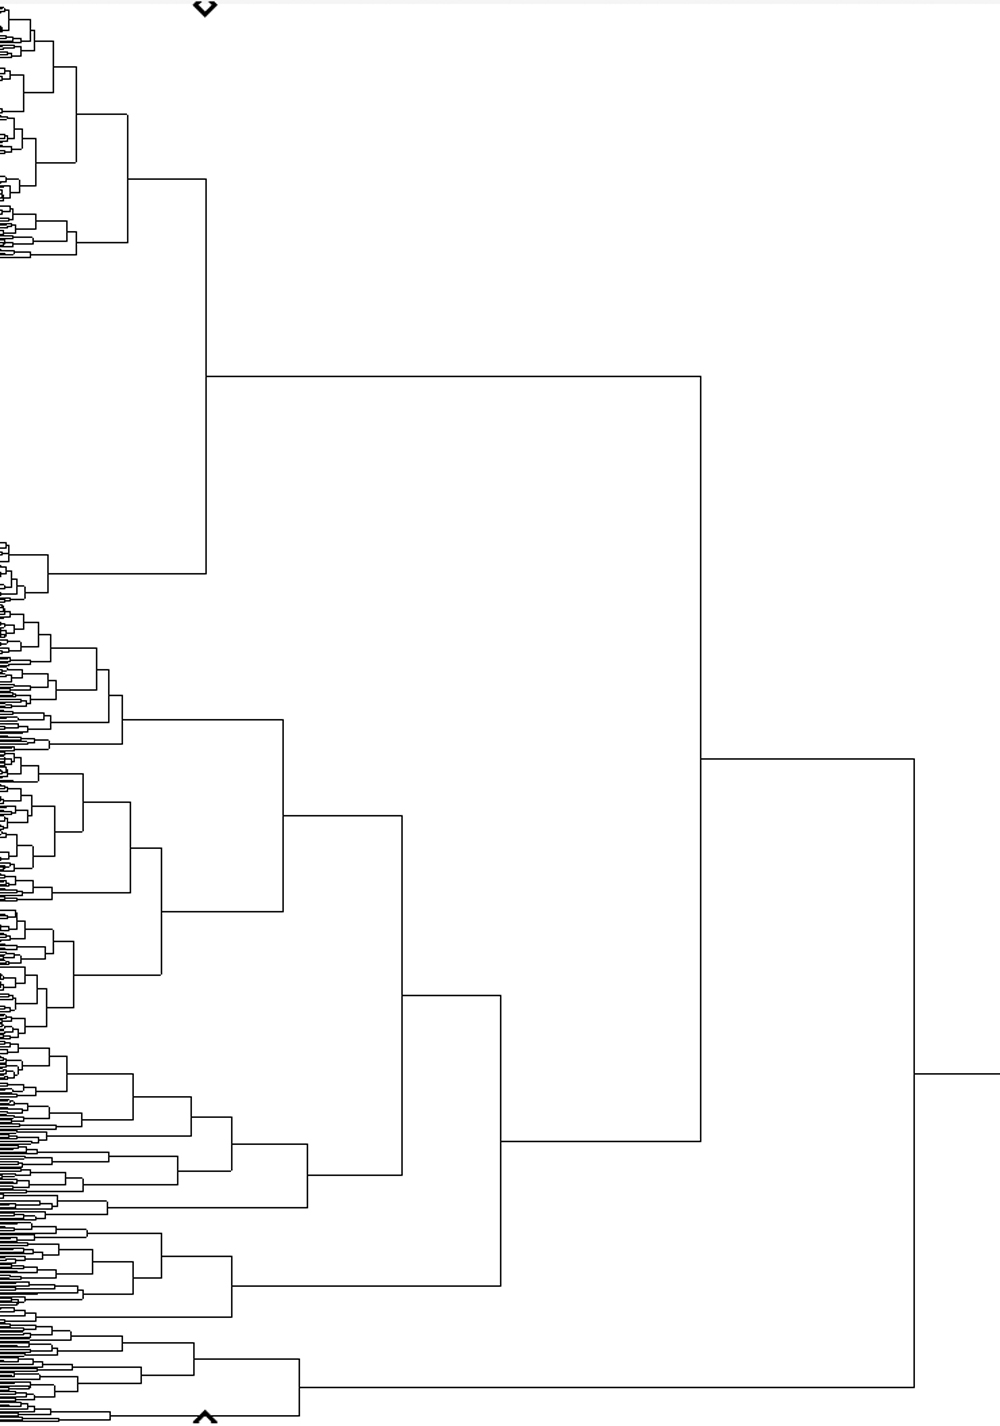
Table 5 presents the output of our cluster analysis, dividing all samples into four (a three-cluster solution will be discussed later). Referring to the average features of these 4 clusters, the first cluster, “many metrics,” is characterized by the use of many metrics, both marketing and financial. However, this cluster is the smallest, consisting of 42 samples. The second cluster, the majority of our samples (406), uses almost “no metrics.” The feature of the third cluster portrays a high level of top management emphasis, particularly on financial metrics. This “financial metrics emphasized” cluster consists of 52 samples. The fourth cluster consists of approximately a quarter of our samples (167) and is characterized by its use of “moderate numbers” of both metrics. Top management emphasis is not as apparent in this sample cluster.
Table 5
Results of cluster analysis and ANOVA (Analysis 3: An additional study)
|
1st. Cluster ‘many metrics’ |
2nd. Cluster ‘no metrics’ |
3rd. Cluster ‘financial metrics emphasized’ |
4th. Cluster ‘moderate mumbers’ |
| # of metrics used |
| Marketing |
11.43 |
0.87 |
4.12 |
5.51 |
| Financial |
10.33 |
1.02 |
2.48 |
4.40 |
| # of metrics reported |
| Marketing |
10.31 |
0.78 |
3.27 |
4.60 |
| Financial |
10.31 |
0.95 |
2.83 |
4.30 |
| # of metrics emphasized |
| Marketing |
6.29 |
0.77 |
7.04 |
2.83 |
| Financial |
7.67 |
1.27 |
11.25 |
3.11 |
| Number |
42 |
406 |
52 |
167 |
| Marketing Mix Activity Performance |
| relative to objectives |
3.84 |
3.51 |
3.64 |
3.58 |
| relative to competitors |
3.81 |
3.52 |
3.81 |
3.64 |
We then conducted a one-way ANOVA to compare their performance. The average performance scores of these clusters are also listed in Table 5. Both relative performances compared with objectives (F = 2.791, p = .040) and with competitors (F = 4.991, p = .002) of “many metrics” and “financial metrics emphasized” indicated high scores. Post hoc analyses by Tukey show that “many metrics” performs better compared with objectives than “no metrics” (M_ “many metrics” = 3.84 > M_ “no metrics” = 3.51, p = .036), and “financial metrics emphasized” performs slightly better compared with competitors than “no metrics” (M_ “financial metrics emphasized” = 3.81 > M_ “no metrics” = 3.52, p = .055). The result suggests a certain support for H1 and H2. It also shows that H6 (top management control over the use of financial metrics) is supported.
5 CONCLUSION AND DISCUSSION
To summarize our results, we have found that:
-
1)
The results of analysis 1 show that the relationship between the number of metrics used and performance is neither clear nor linear;
-
2)
The results of analysis 2 show that the reporting duty of financial metrics has a positive influence on performance, and top management emphasis on marketing metrics may have a limited influence on performance, but it is still unclear, and;
-
3)
The results of the additional cluster analysis identify the largest cluster, characterized by its use of few metrics scores with the worst performance.
Because the results of our reexamination did not show the same results as Mintz and Currim’s (2013) study, it is difficult to assume a simple linear relationship between metric use and performance among Japanese firms. According to our cluster analysis, however, the amount of metrics matters (H1 and H2 are rejected in analysis 1, but the possibility of improvement in performance by using metrics are suggested by two small clusters in analysis 3). Particularly organizations that use few metrics are likely to fail. This study suggests that the majority of our respondents use few metrics. This reveals that, in reality, Japanese firms may not make use of metrics or performance measurement systems developed in the West. The cluster characterized by its use of many metrics showed relatively higher performance; however, it is not reasonable to increase the mere number of metrics according to analyses 1 and 2. Information and metrics may also be overloaded.
More comprehensive results were drawn from our research model by including concepts of managerial control. Although Homburg, Artz, and Wieseke (2012) proposed a model measuring the breadth of metrics by evaluating “the balanced picture of marketing function” with “financial and nonfinancial” metrics (p. 75), we found that different approaches to controlling metric use are beneficial. This is not the balance of metric variation, however, respective managerial controls over metrics retain such balance. For the effective use of financial metrics, it is beneficial to ensure smooth information flows within an organization by setting reporting duties between vertical layers of management (H4 is supported). The information overload problem can be solved through these managerial controls on metric use.
Counter to our expectations, top management emphasis on marketing metrics has less effect on performance than the control variables (H5 is not supported when considering the effects of control variables).
Mintz and Currim’s (2013) findings were not reproduced in analysis 1, and we suppose the reasons as follows. The boundary between marketing and sales departments/functions is obscure, and Japanese managers’ job scopes are broader than Western managers’. Western marketing or sales managers are strongly obligated to achieve their planned objectives, but Japanese managers are less responsible for the performance of the individual marketing-mix activity. Japanese may prioritize the success of the overall business units. Thus, the metric use in Japanese firms shows no effects on the original performance measure compared with their stated objectives. Rather, the use of marketing metrics has a positive influence on the performance of their entire business unit relative to competitors in analysis 1. The results of analysis 3 also suggest that managers who use more metrics achieve better performance in their business units. These practical and cultural difference should have influenced the results.
In addition to this cultural issue, we conducted three ex post analyses to examine how “no metrics”, a large portion of our samples, influenced the results. First, we added a “no metrics” dummy variable to our regression analysis, but this variable did not have a significant influence on performance nor did it improve the coefficient of determination (R squared was unchanged from .138 in the information flow control model, and changed from .126 to .124 in the top management emphasis model). Secondly, we excluded “no metrics” and repeated the regression to find that nothing but metric training and recent business performance are significant indicators of performance. The coefficients of determination scored lower (.114 and .120). Thirdly, t tests indicated that “no metrics” scored significantly lower in organizational involvement, metric compensation, metric training, recent business performance, constant change in marketing practices (the second item of market turbulence), and performance related to objectives. Our analyses 1 and 3 and all these additional findings suggest that a linear or non-linear relationship can be seen, depending on the number of organizations that are inactive in desirable behaviors and metric use.
5.1 Limitations and future direction
This study has several limitations. The first limitation is low coefficients of determination. Whereas recent business performance (a control variable) has the most effect on performance, over 80% of performance determinants are still unexplored. However, when we refer to the results of regression analyses in the existing studies, our scores of .138 and .126 are comparable. Coefficients of determination range from .00–23 in Ambler, Kokkinaki, and Puntoni (2004, p. 7), .12–23 in Homburg, Artz, and Wieseke (2012, p. 67), and .004–235 in O’Sullivan and Abela (2007, p. 85–88). Thus, we have this limitation in common, and it may be derived from the nature of metric use. Concrete marketing activities related to the metric use may have increased the coefficients.
In our study, managers use fewer than 6 metrics, although they have 30 alternative metrics to select from. Variance in the numbers of metrics is high. Although we cannot arrange these 30 metrics as a reexamination, we are unsure whether the measures of metric use are appropriate or whether Japanese managers seldom use these metrics in reality. Mintz and Currim (2015) have attempted to capture the detailed conditions when use of the 30 fixed metrics becomes effective; however, this requires a simultaneous confirmation of the appropriateness of metrics. Because many of our samples use few metrics, quantitative research was not necessarily an appropriate approach. Thus, to explore the cause-effect relationship while controlling the conditions, qualitative studies of rather small number of cases are expected to identify practical and effective metric use and its relationship with other desirable behavioral and financial outputs. Further studies must include qualitative comparison analysis (QCA) and an international comparison of metrics use. The methods for measuring the breadth of metrics can be developed and tested against each other. Our assumption of a direct relationship between metric use and performance is yet another limitation in this study. It may be advantageous to examine the behavioral outputs of metric use.
The results of our reexamination did not show a simple linear relationship between metric use and performance. The reason that we reached a different conclusion from the original may be the presence of the “no metrics” cluster. However, if we had used a 3-cluster solution for our analysis, there will be the largest and worst “no metrics” cluster, moderate numbers of “moderate numbers,” and a smaller and improved cluster making use of metrics. The relationship between metric use and performance is thus influenced by the size of “no metrics.” Its presence implies a linear relationship between metric use and performance; however, when it becomes excessively large, those who actively use metrics become outliers. Further tests are required to discuss the linear or non-linear relationships between metric use and performance.
Our results also indicate the lack of much broader aspects. Without overlooking the causal chains of organizational metric use and performance (Seggie, Cavusgil, & Phelan, 2007), we endeavor to create a model incorporating organizational philosophy, systems, procedures, behavioral outputs, and performance indices. For example, there is an interesting study by Yamaguchi (2018, p. 24) that shows that only 36% of Japanese firms exploit their internally-acquired data and 19% make use of external data despite the availability of new information technologies. This corresponds with our study showing that most Japanese firms are not data-driven.
Finally, recent business performance was a strong indicator of present performance. We also attempted structural equation modeling (SEM) to examine if the metric use effected by the control variables in this study leads to performance. The SEM results indicate that the use of marketing metrics affected performance significantly when we excluded recent business performance or when we did not assume the direct path from recent business performance to the present performance. Yet the model fit indices scored low in these models (CFI scored .841 and .785 and RMSEA scored .066 and .078 respectively). When we included recent business performance in the model and assume the direct path to performance, model fit indices scored higher (.916 and .050) but the effect of metric use diminished as in analysis 2. This variable is desirable by nature, and we will be trapped into the same conclusion when we added other variables measuring the desirable outputs of an organization. For example, when we added ad hoc variable like customer orientation, (Thomas, Soutar, & Ryan, 2001) model fit was improved but the effect of metric use diminished. We should better build a model by employing the neutral and controllable variables. We now expect that broader aspects on organizational factors like the climate of Japanese firms that make use of information, data, or metrics may help us understand their reality and future.
5.2 Managerial implications
Metric use is indispensable for Japanese firms. The largest cluster that uses almost no metrics is not successful. It is not true that when managers use more metrics, they are closer to success. Financial metrics must be monitored thoroughly. Upper management should set the duties of those in the lower layers to enhance smooth information flows within an organization. For example, an online information sharing system that visualizes metrics and achievements in real time may be useful for exploiting financial metrics. Managers may then be required to control their sales forces’ inputs and outputs and report to the upper management. Controlling functions may have to provide incentives to sales managers for the flow of verified and detailed information. The findings of this study do not emphasize the incentives for achieving sales quotas. Instead, they shed light on a different perspective regarding incentives for information flow beyond management layers and functional boundaries to vitalize metric use.
ACKNOWLEDGEMENTS
The authors thank the editors and anonymous IJMD reviewers for their constructive feedback and suggestions during the review process. This study was supported by JSPS KAKENHI Grant Numbers 26285096 and 26380580.
REFERENCES
- Ambler, T. (2000). Marketing metrics. Business Strategy Review, 11(2), 59–66.
- Ambler, T. (2003). Marketing and the bottom line: The marketing metrics to pump up cash flow. London: FT Prentice Hall.
- Ambler, T., Kokkinaki, F., & Puntoni, S. (2004). Assessing marketing performance: Reasons for metrics selection. Journal of Marketing Management, 20(3–4), 475–498.
- Burns, A. C., & Bush, R. F. (2000). Marketing research. Upper Saddle River: Prentice Hall.
- Cassidy, F., Freeling, A., & Kiewell, D. (2005). A credibility gap for marketers. Mckinsey Quarterly, 2, 9–10.
- Chakrabarty, S., Brown, G., & Widing, II, R. E. (2012). The role of top management in developing a customer-oriented sales force. Journal of Personal Selling & Sales Management, 32(4), 437–449.
- Challagalla, G., Murtha, B. R., & Jaworski, B. J. (2014). Marketing doctrine: A principles-based approach to guiding marketing decision makings in the firm. Journal of Marketing, 78(4), 4–20.
- Chang, S.-J., van Witteloostuijn, A., & Eden, L. (2010). From the editors: Common method variance in international business research. Journal of International Business Studies, 41(2), 178–184.
- Day, G. S. (1990). Market driven strategy: Processes to creating value. New York: The Free Press.
- Dewsnap, B., & Jobber, D. (2000). The sales-marketing interface in consumer-packaged goods companies: A conceptual framework. Journal of Personal Selling & Sales Management, 20(2), 109–119.
- Erevelles, S., & Fukawa, N. (2013). The role of affect in personal selling and sales management. Journal of Personal Selling & Sales Management, 33(1), 7–24.
- Farris, P. W., Bendle, N. T., Pfeifer, P. E., & Reibenstein, D. J. (2010). Marketing metrics: The definitive guide to measuring marketing performance. Upper Saddle River: Wharton School Publishing.
- Fukutomi, G., Yamashita, Y., Uehara, W., Fukuchi, H., & Sasaki, M. (2017). Dysfunction from focusing on overseas business. GSTF Journal on Business Review, 5(1), 28–37.
- Homburg, C., Workman, Jr., J. P., & Jensen, O. (2002). A configurational perspective on key account management. Journal of Marketing, 66(2), 38–60.
- Homburg, C., Artz, M., & Wieseke, J. (2012). Marketing performance measurement systems: Does comprehensiveness really improve performance? Journal of Marketing, 76(3), 56–77.
- Homburg, C., & Jensen, O. (2007). The thought worlds of marketing and sales: Which difference makes a difference? Journal of Marketing, 71(3), 124–142.
- Homburg, C., Wieseke, J., & Hoyer, W. D. (2009). Social identity and the service-profit chain. Journal of Marketing, 73(2), 38–54.
- Hulbert, J. M., & Toy, N. E. (1977). A strategic framework for marketing control. Journal of Marketing, 41(2), 12–20.
- Jaworski, B. J., & Kohli, A. K. (1993). Market orientation: Antecedents and consequences. Journal of Marketing, 57(3), 53–70.
- Katsikeas, C. A., Morgan, N. A., Leonidou, L. C., & Hult, G. T. M. (2016). Assessing performance outcomes in marketing. Journal of Marketing, 80(2), 1–20.
- Kohli, A. K., & Jaworski, B. J. (1990). Market orientation: The construct, research propositions, and managerial implications. Journal of Marketing, 54(2), 1–18.
- Kosan, L. (2005). Accounting for marketing: Marketing performance through financial results. International Review of Management and Marketing, 4(4), 276–283.
- Kotler, P., Rackham, N., & Krishnaswamy, S. (2006). Ending the war between sales and marketing. Harvard Business Review, 84(7–8), 68–78.
- Kuester, S., Homburg, C., & Robertson, T. S. (1999). Retaliatory behavior to new product entry. Journal of Marketing, 63(4), 90–106.
- Lassk, F. G., & Shepherd, C. D. (2013). Exploring the relationship between emotional intelligence and salesperson creativity. Journal of Personal Selling & Sales Management, 33(1), 25–37.
- McManus, L., & Guilding, C. (2008). Exploring the potential of customer accounting: A synthesis of the accounting and marketing literatures. Journal of Marketing Management, 24(7–8), 771–795.
- Michaels, R. E., & Day, R. L. (1985). Measuring customer orientation of salespeople: A replication with industrial buyers. Journal of Marketing Research, 22(4), 443–446.
- Miller, C. C., Burke, L. M., & Glick, W. H. (1998). Cognitive diversity among upper-echelon executives: Implications for strategic decision processes. Strategic Management Journal, 19(1), 39–58.
- Mintz, O., & Currim, I. S. (2013). What drives managerial use of marketing and financial metrics and of marketing-mix activities? Journal of Marketing, 77(2), 17–40.
- Mintz, O., & Currim, I. S. (2015). When does metric use matter less? How firm and managerial characteristics moderate the relationship between metric use and marketing mix performance. European Journal of Marketing, 77(2), 1809–1856.
- Montgomery, D. B., & Webster, Jr., F. E. (1997). Marketing’s interfunctional interface: The MSI workshop on management of corporate failure zone. Journal of Market-Focused Management, 2(1), 7–26.
- Moorman, C., & Rust, R. E. (1999). The role of marketing. Journal of Marketing, 63(Special Issue), 180–197.
- Nakanishi, N. (2002). “Eigyō” no shigoto [Task of “sales”]. Shōgaku ronkyū [The Bulletin of the Faculty of Business Administration, Kwansei Gakuin University], 50, 237–257.
- Narver, J. C., & Slater, S. F. (1990). The effect of a market orientation on business profitability. Journal of Marketing, 54(4), 20–35.
- Noble, C. H., & Mokwa, M. P. (1999). Implementing marketing strategies: Developing and testing a managerial theory. Journal of Marketing, 63(4), 57–73.
- Onzo, N. (1995). Eigyō taisei no daiyamondo [Diamond of sales system]. In J. Ishii & M. Shimaguchi (Eds.), Eigyo no honshitsu: Dentō to kakushin no sōkoku [The essence of sales: Conflict between tradition and innovation] (pp. 122–154). Tokyo: Yūhikaku.
- O’Sullivan, D., & Abela, A. V. (2007). Marketing performance measurement ability and firm performance. Journal of Marketing, 71(2), 79–93.
- Pryor, S., Malshe, A., & Paradise, K. (2013). Salesperson listening in the extended sales relationship: An exploration of cognitive, affective, and temporal dimensions. Journal of Personal Selling & Sales Management, 33(2), 185–196.
- Ramaswami, S. N. (1996). Marketing controls and dysfunctional employee behaviors: A test of traditional and contingency theory postulates. Journal of Marketing, 60(2), 105–120.
- Seggie, S. H., Cavusgil, E., & Phelan, S. E. (2007). Measurement of return on marketing investment: A conceptual framework and the future marketing metrics. Industrial Marketing Management, 36(6), 834–841.
- Srinivasan, S., & Hassens, D. M. (2009). Marketing and firm value: metrics, methods, findings, and future directions. Journal of Marketing Research, 46(3), 293–312.
- Takashima, K. (2002). Eigyō purosesu inovēshon: Shijō shikō no komyunikēshon kaikaku [Sales process innovation: Market-oriented communication reformation]. Tokyo: Yūhikaku.
- Thomas, R. W., Soutar, G. N., & Ryan, M. M. (2001). The selling orientation-customer orientation (S. O. C. O.) scale: A proposed short form. Journal of Personal Selling & Sales Management, 21(1), 63–69.
- Verhoef, P. C., & Leeflang, P. S. H. (2009). Understanding the marketing department’s influence within the firm. Journal of Marketing, 73(2), 14–37.
- Webster, Jr., F. E., Malter, A. J., & Ganesan, S. (2003). Can marketing regain its seat at the table? MSI Working Paper, 03-113, Marketing Science Institute.
- Webster, Jr., F. E., Malter, A. J., & Ganesan, S. (2005). The decline and dispersion of marketing competence. MIT Sloan Management Review, 46(4), 35–43.
- Workman, Jr., J. P., Homburg, C. & Jensen, O. (2003). Intraorganizational determinants of key account management effectiveness. Journal of Academy of Management Science, 31(1), 3–21.
- Yamaguchi, S. (2018). Soshiki naigai dēta katsuyō no sokushin hōhō: dēta katsuyō kōdō ni eikyō wo ataeru yōso no jisshō kenkyū [How to advance the utilization of internal and external data: An empirical analysis of characteristics that affect data utilization behavior]. Soshiki kagaku [Organizational Science], 51(4), 24–32.
- Zoltners, A. A., Sinha, P., & Lorimer, S. E. (2012). Breaking the sales force incentive addiction: A balanced approach to sales force effectiveness. Journal of Personal Selling & Sales Management, 32(2), 171–186.