Abstract:
Nanosilica is one of the most widely used nanomaterials across the world. However, their
assessment data on the occupational exposure to nanoparticles is insufficient. The present
study performed an exposure monitoring in workplace environments where synthetic powders
are prepared using fumed nanosilica. Furthermore, after it was observed during exposure
monitoring that nanoparticles were emitted through leakage in a vacuum cleaner (even with
a HEPA-filter installed in it), the properties of the leaked nanoparticles were also
investigated. Workers were exposed to high-concentration nanosilica emitted into the air
while pouring it into a container or transferring the container. The use of a vacuum
cleaner with a leak (caused by an inadequate sealing) was found to be the origin of
nanosilica dispersion in the indoor air. While the particle size of the nanosilica that
emitted into the air (during the handling of nanosilica by a worker) was mostly over
100 nm or several microns (µm) due to the coagulation of
particles, the size of nanosilica that leaked out of vacuum cleaner was almost similar to
the primary size (mode diameter 11.5 nm). Analysis of area samples resulted in 20% (60% in
terms of peak concentration) less than the analysis of the personals sample.
Introduction
Nanosilica is one of the most widely used nanomaterials across the world. In South Korea,
34,136 tons of 93 types of nanomaterials are manufactured or imported annually, and silica
occupies the second place with 9,408 tons1).
Silica exists in two phases: crystalline, and amorphous. Crystalline silica is especially
notorious for inducing lung cancer and is categorized into Group 1 by International Agency
for Research on Cancer. Nanosilica is mainly produced through pyrolysis or polymerization
processes in the amorphous phase. The adverse health effect of amorphous nanosilica has not
been clearly demonstrated to date, nor has any occupational exposure limit (OEL) been
attributed to it yet2).
Besides toxicity evaluation, exposure monitoring plays a very important role in risk
assessment for nanosilica. Therefore, it is necessary to establish a scale to systematically
quantify the measurement results of exposure monitoring in various environments3).
On the other hand, the present study determined that a vacuum cleaner emits nanoparticles
even with a high efficiency particulate absorption (HEPA)-filter installed in it. Studies
that performed indoor environment assessments confirmed vacuum cleaners as the origin of
nanoparticles that are found in indoor air4). However, HEPA-filtered vacuum cleaners are recommended as an
appropriate cleaning method in workplace environments where nanomaterials are
handled5). Therefore, the
objectives of this study are first, to perform monitoring of the nanoparticle exposure
during the manufacturing process of synthetic powders, and second, to deliver a case study
of vacuum cleaners causing nanoparticle dispersion in the workplace indoor air, and third,
to assess the properties of nanoparticles during the vacuum cleaner operation.
Subjects and Methods
Nano-specific and non-nano specific information of the workplace
Table 1.
Nano-specific and not nano-specific information in this study
| Nano-specific information |
Information that not nano-specific |
| Description of physical and chemical form
of the engineered nanoparticle used |
-Chemical composition: silicon dioxide
(non-coated)
-Size distribution: unknown-Specific surface area: 300
m2/ga
-Primary particle size: 7 nma |
Information on process |
In method section |
| Description of site |
-Located fourth floor in buildingDimensions of the
workplace: 13 m (width), 8 m (length), 5 m (height)
-There were two entrances, one
opening to the veranda leading outside the building; and the other connected to
other workplaces within the building.
-The bench-top Thermo-Hygrostat was active
throughout working hours |
| Description of physical and chemical form of released/
detected silicon dioxide particles |
-Primary particle size: similar to manufacturer’s
valueb
-Agglomerate size: a few micron
-Elemental composition: silicon
and oxideb |
Risk management measures (RMM) |
-Workers wear a respirator only when
handling nanosilica
-HEPA-filtered vacuum cleaner used
-No local exhaust |
| Potential other sources of ultrafine and other
particles |
-Oil particle during filter press
-Water droplet during
sonication |
| Human exposure characterized |
In results section |
Environmental release information |
-Used powder volume: silica 5 kg, metal silicon
2.5 kg
-Vacuum cleaner specifications: 4,500 watt, equipped HEPA filte
r-Vacuum
cleaner size: 60 cm × 60 cm × 100 cm |
| Environmental release characterized in terms of mass
flow rates and not only concentrations |
Not know |
Sampling and data analysis strategy for human
exposure |
-Personal samples: two (one sample per day)
-Area
samples: two (one sample per day)
-Measuring location: 1 m from the filter press
(3 m from the pressure vessel)
-Data analysis: in text |
a Manufacturer’s value. b in TEM analysis, this work
As there are numerous factors that affect the results of assessment of nanoparticle
exposure, efforts were made to establish a precise mapping of information associated with
such factors. To this end, nano specific information and non nano-specific information
presented by Clark et al. (2012)6) was investigated in this study, and the results are shown
in Table 1.
Operation Processes (in order of performance)
1) Mixing and stirring: First, the nanosilica is poured (10 kg paper bag) into a
container on the floor. Then, the bag is weighed using a balance. Finally, the nanosilica
is poured into a stirrer (includes walking for 5 m to the stirrer with the container). In
order to prevent the nanosilica from being emitted to the air while pouring, a vacuum
cleaner is switched on and placed close to the inlets of the container and the stirrer.
Subsequently, micro-sized metal silicon and liquid is poured into the stirrer, which is
then put into operation. The nanosilica that was scattered on the floor was suctioned into
a vacuum cleaner. (1 h)
2) Drainage: The thoroughly stirred sludge is automatically transferred to the
Filter-Press process through a delivery hose, and the pressing begins to enable liquid
drainage. The press is powered by a hydraulic motor. (Automatic operation, 80 min)
3) Sonication: The filter is separated after the Filter-Press process and undergoes
sonication in the water bath for reuse. (1 h)
4) Drying: In order to collect the cakes, the surface of the filter is scratched and a
stainless steel tray is used for collection. The cakes are then stored in a drying machine
in a different workplace. (20 m from the entrance)
5) Storage: On the next day, the tray is carried to the workplace and the dry powder is
spooned into a plastic bag. (20 min) (Fig.
1).
Sampling strategy
1) Area sample measurement using SMPS and NSAM
We used a scanning mobility particle sizer (SMPS; Model 3910; TSI Inc.), which measures
the particle number concentration of 13 sets of particles per unit volume of ambient air
(10−300 nm), and a nanoparticle surface area monitor (NSAM; Model 9000; TSI Inc.), which
measures the surface area concentration of particles ranging from 10 to 1,000 nm. The
measurements were made continuously in one-minute intervals for 24 h (from 10:00 a.m. on
the 1st day, to 10:25 a.m. on the 2nd day). The measuring location was about 1 m from
the filter press (about 3 m from the pressure vessel).
2) Personal sampling and area sampling using DiSCmini
DiSCmini (DM) (Matter Aerosol, Wohlen, Switzerland; Fierz et al.,
2011)7), an instrument
recently developed for nanoparticle monitoring and personal sampling, was used to
measure the number concentration, surface area concentration, and mean particle size of
the airborne particles ranging from 10 to 700 nm at one-minute intervals. The area
sampling was also conducted using another DM. The battery of the DM used for personal
sampling was charged during a lunch break. The personal sampling was measured for two
days in keeping with the working schedule, and the area sampling was continuously
measured until the next day.
3) Assessment of the background concentration
As nanoscale particles are found both in workplace environments and in ambient air, it
is necessary to assess the background concentration to identify the concentration of
nanoparticles generated in the process of handling nanomaterials7,8,9,10,11). In this study, the concentration measured before the
handling of nanomaterials was used as the background concentration, since the particle
concentration is at its lowest level of the day at this time. Additionally, air in other
workplaces within the building and outside the building was also analyzed considering
the fact that outside air infiltrates through two doors.
4) Filter-based sampling and FTIR analysis
Gravimetric analysis was performed by means of a polycarbonate filter (37 mm, pore 0.4
µm; SKC Inc., USA). Particulate sampling was performed at a rate of 5
LPM under a lowered detection limit in order to facilitate the gravimetric analysis.
Similar to the DM analysis case, area samples were analyzed and measured for two days as
per the working schedule. Because gravimetric analysis is used to determine the weights
of all particles, FTIR analysis was performed to determine the weight of silica
particles. After the gravimetric analysis, a fourier-transform infrared-spectroscopy
(Nicolet 6700, Thermo fisher scientific Inc., USA) analysis was performed on the filter
via low-temperature pyrolysis and KBr-pellet preparation in accordance with the NIOSH
method 760212). The FTIR
spectra confirmed an amorphous silica-specific peak of 800 cm−1. The limit of
detection (LOD) of silica was 0.010 mg/sample.
5) TEM analysis
The shape and chemical composition of airborne nanoparticles was investigated using a
transmission electron microscopy (TEM, H-7650, Hitachi Inc., Japan) analysis whereby the
airborne nanoparticles were trapped in a TEM grid with a portable electric dust
collector, ESPnano (model 100, Dash connector technology Inc., USA). For each task
(pouring nanosilica into the container, operating vacuum cleaner, operating filter
press, ultrasonic cleaning, spoon-transferring synthetic powder), samples was collected
for 20 to 50 s at the operator’s breathing zone. The chemical composition was verified
by an energy-dispersive X-ray spectroscopy (EDS).
Vacuum cleaner analysis
It was confirmed that nanoparticles are generated in the air path of the vacuum cleaner
(age: manufactured 2010; type: dry vacuums; model: CLEON, made in Korea; power: 4.5HP),
and a follow-up assessment of the vacuum cleaner was performed on a later date after the
exposure monitoring.
This paper reports the experiments conducted to measure the particle mode size and number
concentration of nanoparticles emitted from the vacuum cleaner using SMPS. The experiments
were conducted in the same situation and the working conditions (silica amount, work
method, work time, etc.). The measurement was conducted at a distance of 1 m from the
exhaust vent of the vacuum cleaner.
The measurement was conducted sequentially by measuring the size and concentration of
nanoparticles:
(1) Present in the workplace environment (background concentration).
(2) When the vacuum cleaner is ON (i.e., the air in the workspace is inhaled) in order to
see whether the nanoparticles are generated by the vacuum cleaners’ motor.
(3) Scattered in air when silica powder is poured into a container when the vacuum
cleaner is OFF.
(4) Scattered in air when silica powder is poured into a container when the vacuum
cleaner is ON.
During the process of exposure monitoring, it was found that the concentration of
nanoparticles fell abruptly when the bench-top HEPA-filtered thermo-hygrostat was turned
on. Therefore, the vacuum cleaner analysis was performed with the Thermo-Hygrostat
off.
Analysis of other factors
Temperature and humidity were measured during working hours (except during the night),
and the wind speeds at the inlet and outlet of vacuum cleaner was measured using a
hot-wire anemometer (model AS-202A, Graywolf sensing solutions Inc.).
Data analysis
A distribution of the DM measurement results on a log probability plot resulted in
linearity. Thus, the geometric mean concentration and the GSD were calculated after the
logarithmic conversion.
Results
1) Aerosol characterization by task
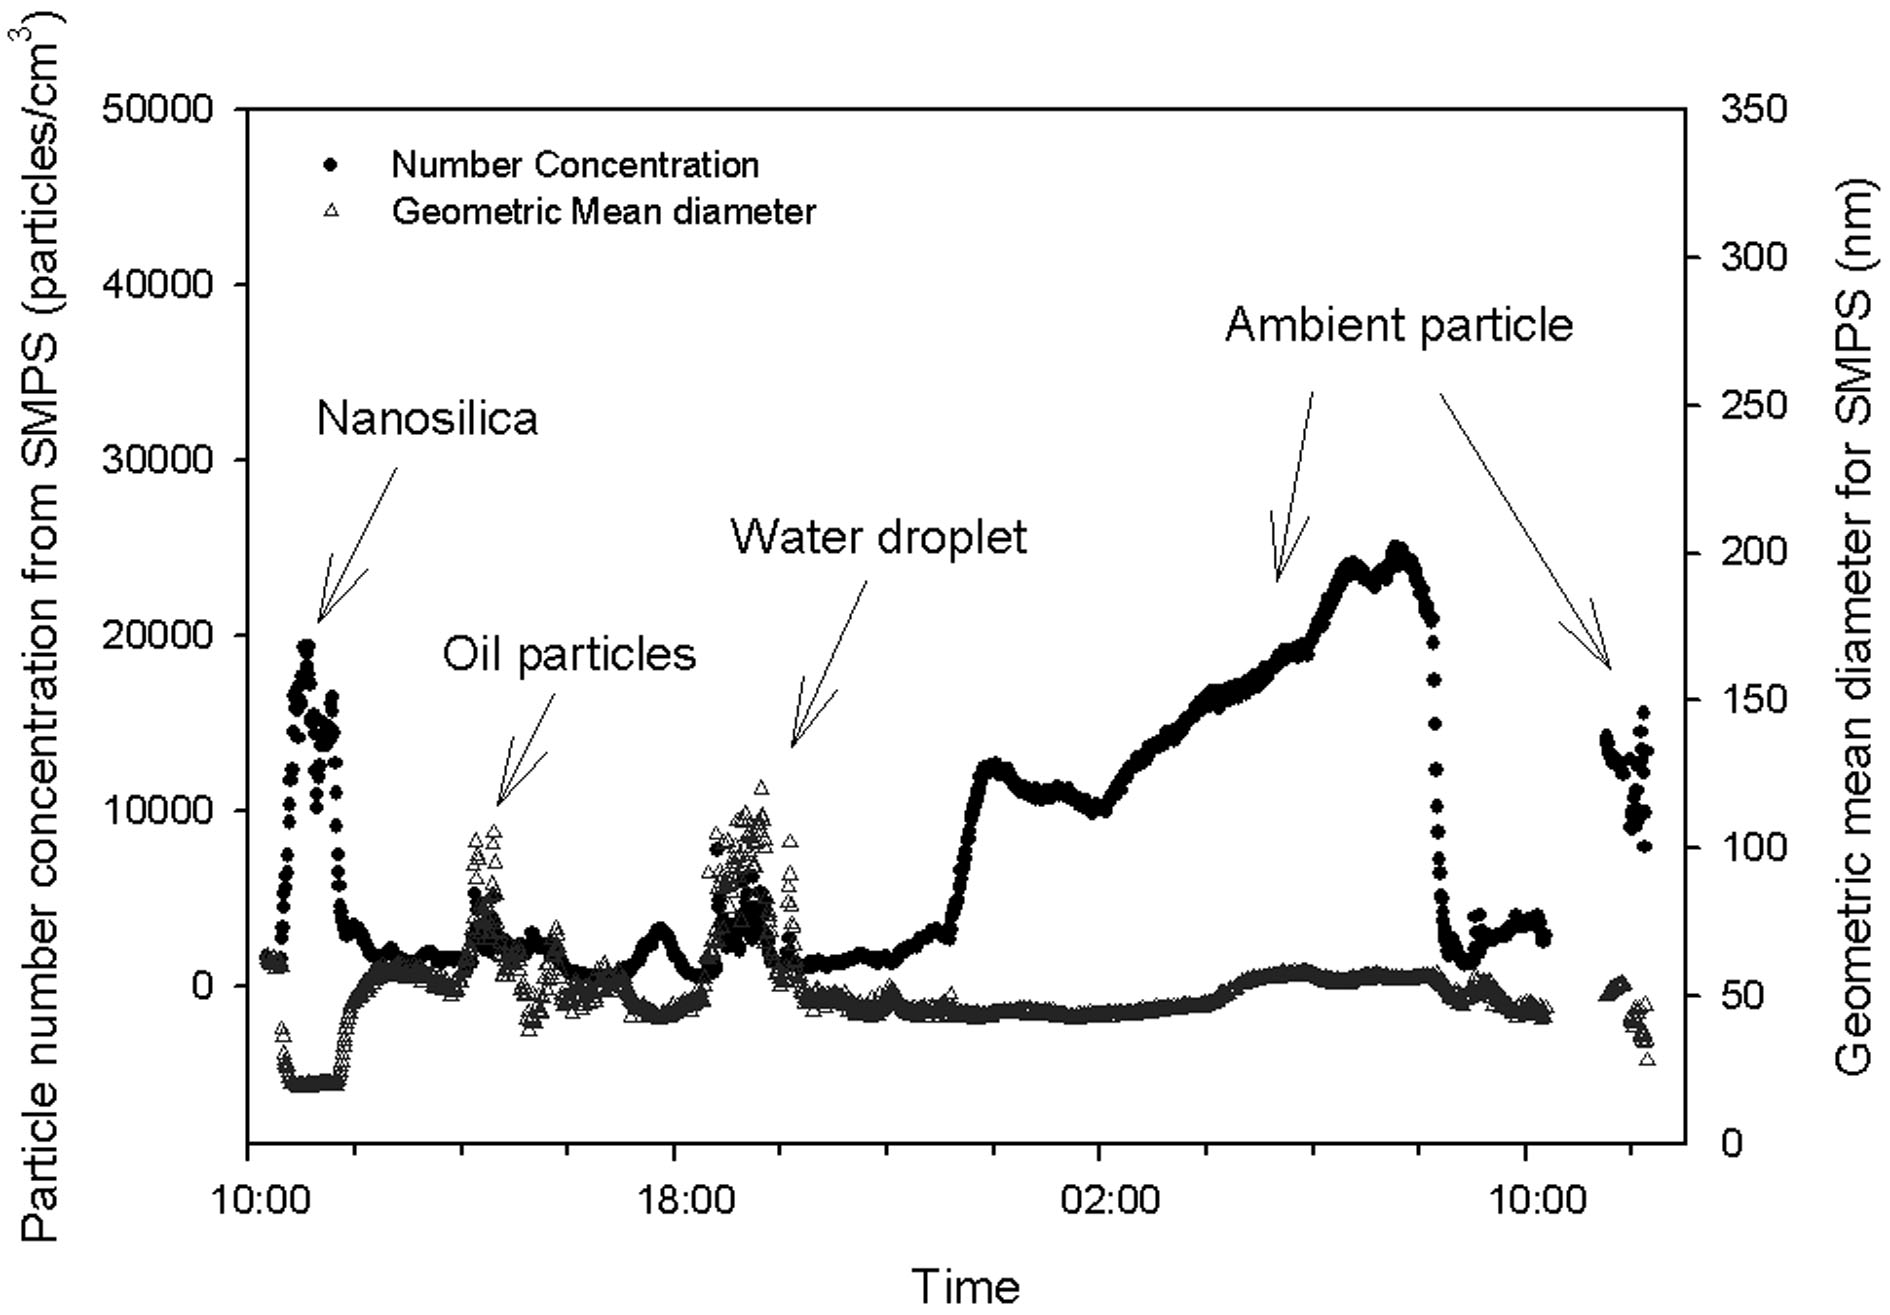
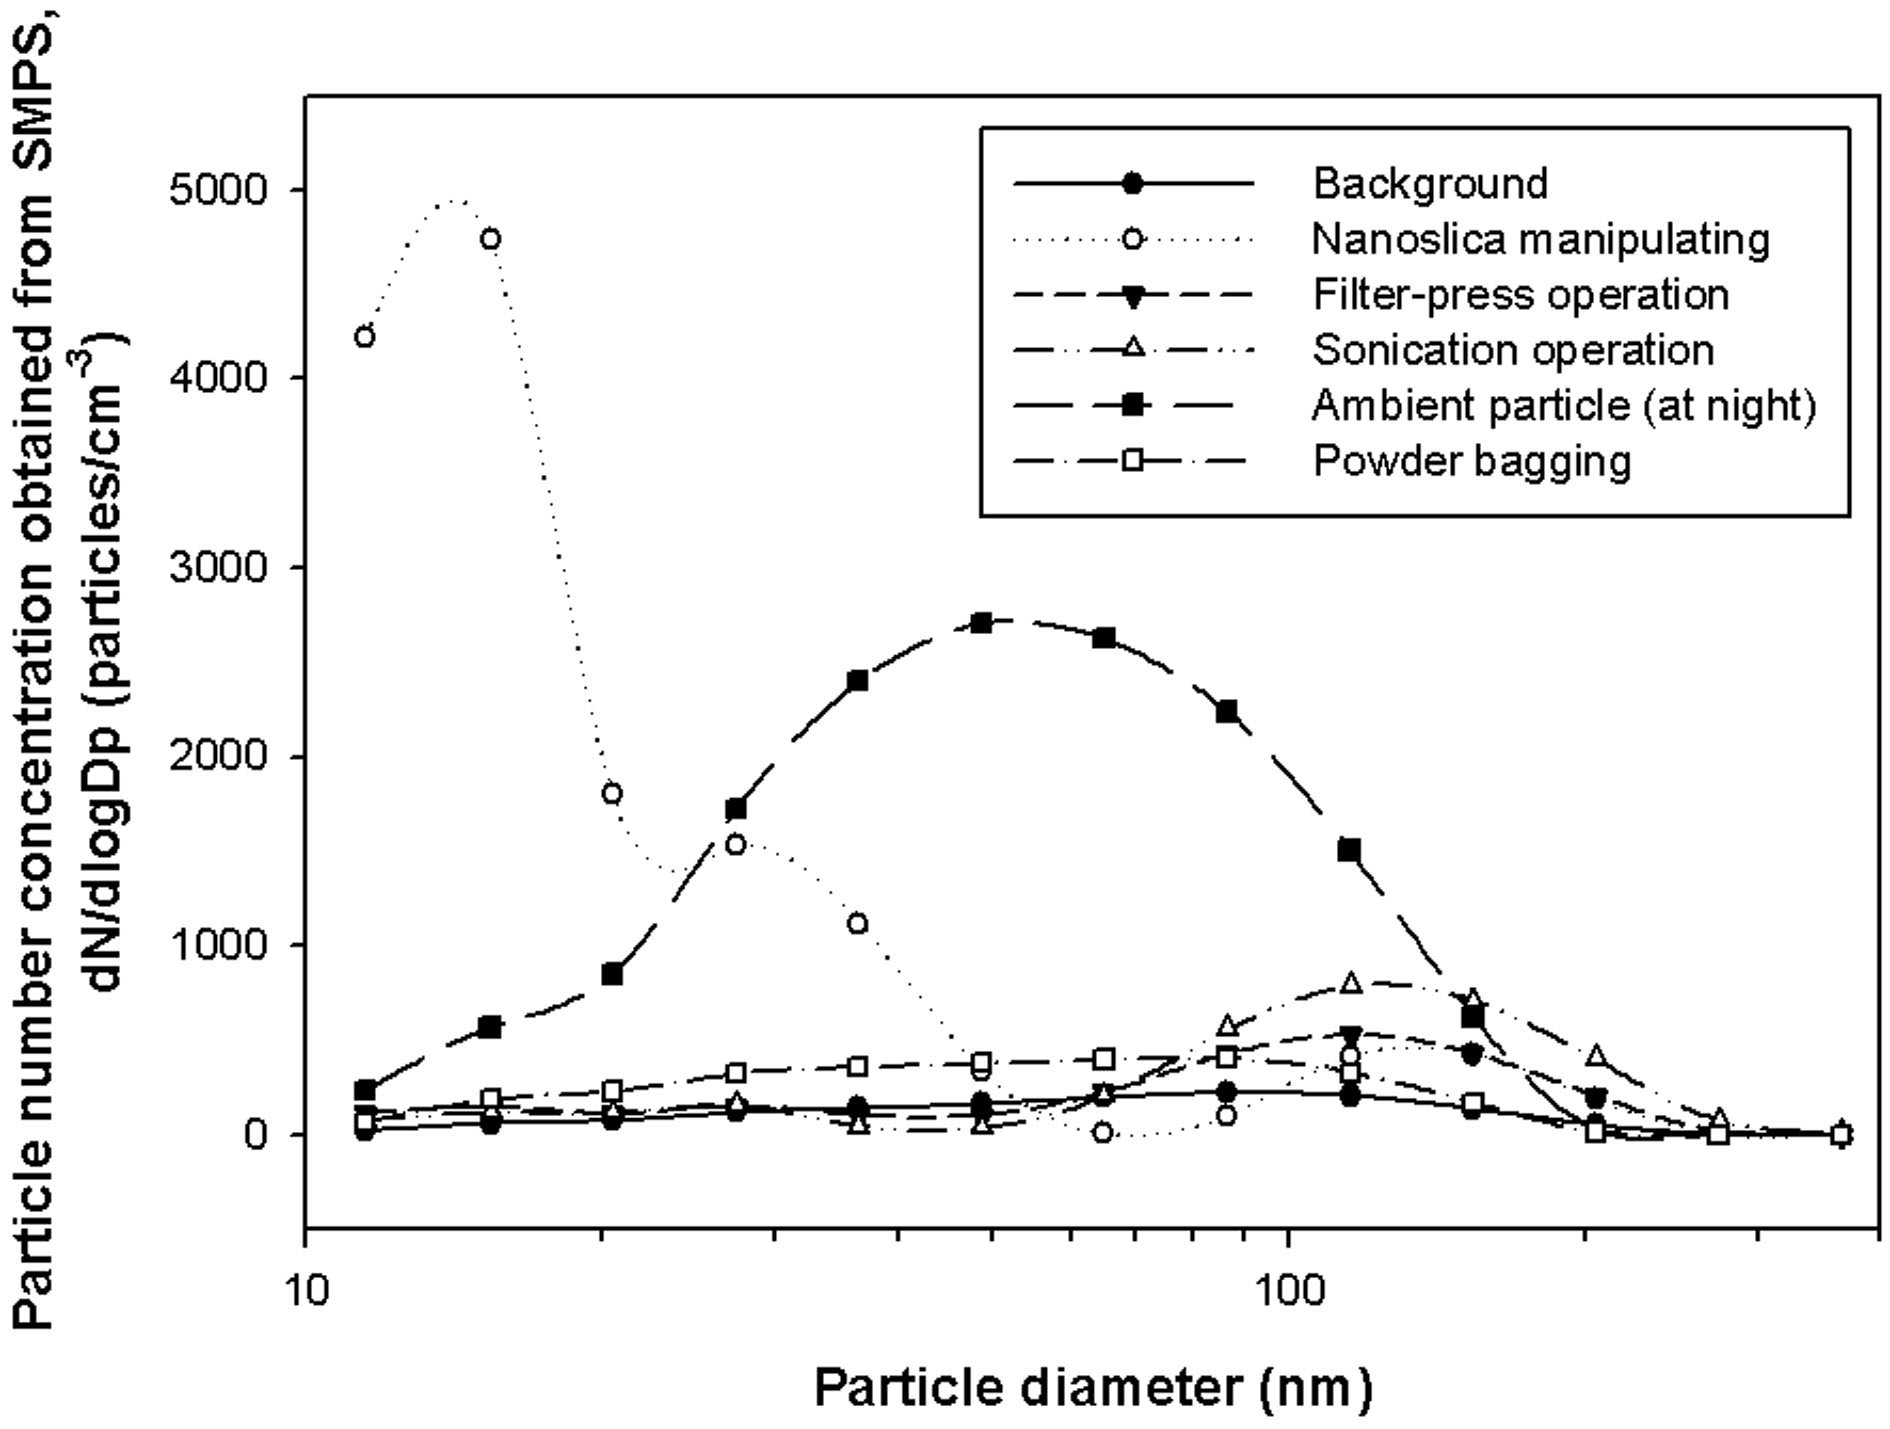
Table 2.
Summary statistics by tasks in workplace
| Task/Activity |
SMPS |
|
DiSCmini |
|
NSAM |
| GM |
size |
Peak |
|
GM |
Peak |
size |
GSD |
|
SA |
Peak |
| Before the start of operations (inside workplace) |
1.3×10³ |
62 |
1.6×10³ |
|
2.4×10³ |
5.3×10⁴ |
64 |
1.71 |
|
5.2 |
6.1 |
| Manipulating nanosilica |
9.6×10³ |
24 |
1.9×10³ |
|
2.5×10⁴ |
3.0×10⁵ |
22 |
1.83 |
|
14.1 |
23.8 |
| Filter press operation (oil particle) |
2.6×10³ |
76 |
5.2×10³ |
|
3.4×10³ |
7.8×10⁵ |
53 |
1.46 |
|
8.3 |
28.2 |
| Sonication (water drop) |
3.2×10³ |
93 |
6.2×10³ |
|
4.7×10³ |
2.9×10⁴ |
51 |
1.11 |
|
20.5 |
42.2 |
| At night (ambient particle) |
1.4×10⁴ |
49 |
2.5×10⁴ |
|
1.6×10⁴ |
3.8×10⁴ |
41 |
1.07 |
|
35.2 |
67.8 |
| Powder bagging (dry cake) |
2.8×10³ |
50 |
2.9×10³ |
|
2.5×10³ |
1.8×10⁴ |
55 |
1.45 |
|
1.6 |
2.7 |
| Outside laboratory (semi-ambient particle) |
1.2×10⁴ |
53 |
1.4×10⁴ |
|
|
|
|
|
|
48.0 |
50.6 |
| Outside building (ambient particle) |
1.1×10⁴ |
40 |
1.5×10⁴ |
|
|
|
|
|
|
43.6 |
52.4 |
SMPS, scanning mobility particle sizer; DiSCmini, miniature diffusion size
classifier; NSAM, nanoparticle surface area monitor; GM, geometric mean of number
concentration; size, particle diameter; Peak, peak concentration; GSD, geometric
standard deviation; SA, alveolar-deposited surface area; Unit, GM: particles/cc,
size: nm, SA: µm2/cc, Peak: particles/cc
Particle number concentration increased compared to the background number concentration
during the handling of nanosilica, operation of the filter press, ultrasonic cleaning of
the filter, and during the night, when the Thermo-Hygrostat was off. The particle size by
SMPS measurement, 62 nm, observed in the background concentration estimation prior to
operation was abruptly reduced to 24 nm when simultaneously handling nanosilica and
operating the vacuum cleaner, and abruptly increased to 76, 93 nm during the operation of
the filter press and ultrasonic cleaner, respectively (Fig. 2, Table 2). While the DM
measurements showed similar particle sizes to those of the SMPS measurements in each work
process, the results of particle number concentration measurements were slightly
different, with DM results showing somewhat higher general values than SMPS values (range:
−12%–+81, average: +33%) and even as much as 270% higher, when the number concentration of
nanoparticles rose to the peak value during the handling of silica (Table 2). Figure 3
depicts the SMPS-measured particle size distribution in each work process, wherein a
multi-modal distribution (15, 30, and 150 nm) is shown during the handling of silica. This
is attributable to the agglomeration of silica particles in air whereas primary silica
particles measure 7 nm.
2) Comparison of results of the personal samples and the area samples
Table 3.
Summary of results in personal sample and area sample measured by two sets of
DiSCmini
|
Number concentration |
|
Mode diameter |
|
Surface area |
| Personal |
Area |
|
Personal |
Area |
|
Personal |
Area |
| GM |
3,131 |
2,692 |
|
42 |
49 |
|
7 |
7 |
| Min |
108 |
568 |
|
10 |
13 |
|
1.4 |
1.7 |
| Max |
134,154 |
82,736 |
|
300 |
79 |
|
120.6 |
58.1 |
GM, geometric mean of number concentration; GM, geometric mean; Unit, number
concentration: particles/cc, mode diameter: nm, surface area:
µm2/cc
The particle number concentration of the personal samples (except during the night) had
an arithmetic mean (AM) of 7,054 particles/cc, a geometric mean (GM) of 3,131
particles/cc. The average particle diameter had an AM of 45 nm and a GM of 42 nm; while
their surface area has an AM of 12 µm2/cc, and a GM of 7
µm2/cc. The particle number concentration observed in the
personal samples was higher than that of the area sample by 1.6 times (GM 1.2 times), and
the peak was also 1.6 times higher (Fig 4, Table 3).
In the case of the personal samples, the worker’s assigned activity was shown to greatly
affect the exposure to nanoparticles. In area sampling, it is difficult to consider
operations that are performed sporadically, such as opening and closing of the drying
machine and bagging, or sampling that is performed at a long distance from the measurement
instrument.
3) Assessment of background concentration
The background concentration inside the workplace was about 10 times lower compared to
that outside the workplace. This is explained by the use of a HEPA-filtered
Thermo-Hygrostat in the workplace, which provides air circulation, which enhances the
filtering of nanoparticles through the HEPA filter. The background concentration at other
workplaces and outside the building showed similar levels.
4) Results of filter sample assessment
Table 4.
Results of mass concentration on filter and FTIR analysis
| Sampling day |
Sampling duration |
Total dust concentration |
Detection of amorphous silica in FTIR analysis |
| 1st |
570 |
0.047 |
YES |
| 2nd |
73 |
0.045 |
NO |
FTIR, fourier-transform infrared-spectroscopy; Unit, sampling duration: min; total
dust concentration, mg/m−3.
The particle concentration on the filter was 0.047 mg/m3 on the first day and
0.045 mg/m3 on the second day. The FTIR analysis showed, however, that
amorphous silica was detected in the sample only on the first day (Table 4). The mass concentrations in the filter on the 1st and
2nd days are similar: 0.047 and 0.045, respectively. However, on the 2nd day, silica
powders were not treated, and consequently, the FTIR analysis detected silica only on the
1st day (Table 4). This result suggests that
the exposure assessment of amorphous silica nanoparticles can be performed using
assessment methods for crystalline silica such as NIOSH 7500 and 7602.
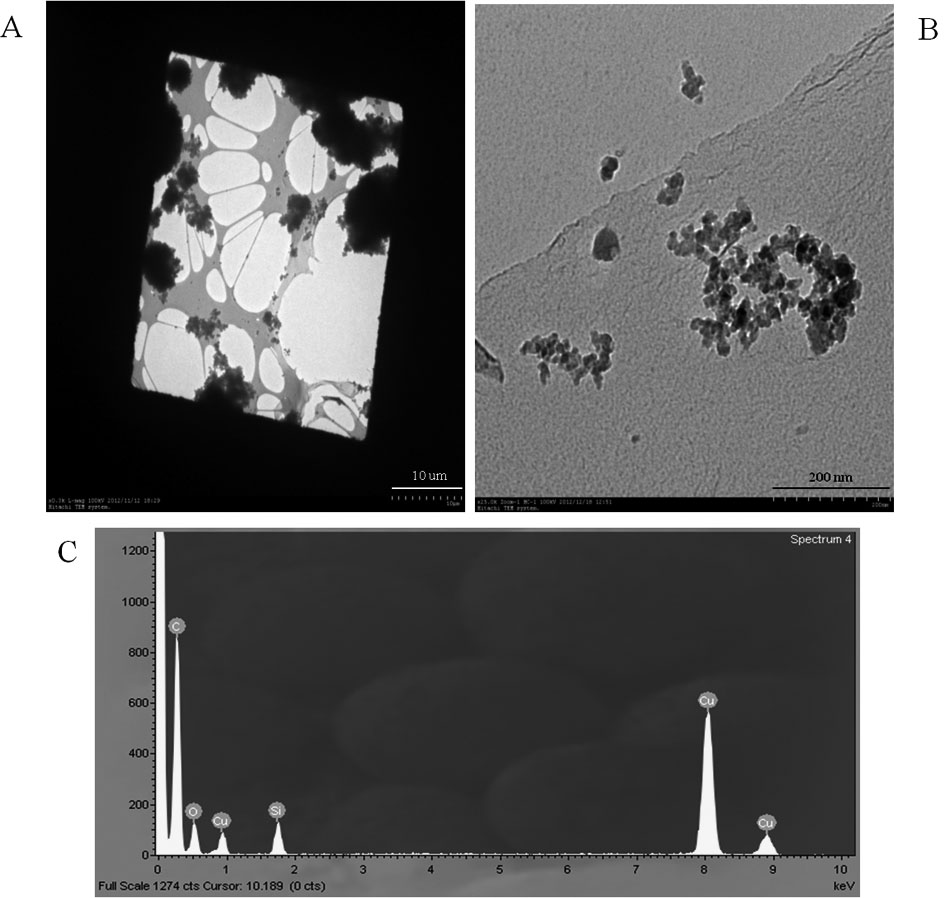
5) Results of TEM analysis
Measurements collected during pouring of nanosilica into the container exhibit a wide
variation in silica particle sizes, ranging from several nm to several
µm. However, particles extracted near the air outlet of the vacuum
cleaner were mostly small, ranging from 20 nm to 200 nm (Fig. 5). No nanosilica particles were detected during the operation
of filter press, ultrasonic cleaning, and bagging.
Results of assessment with the vacuum cleaner
Experimental conditions (1) and (2) confirmed that nanoparticles are not produced by the
vacuum cleaner itself (the concentrations before and after the usage of vacuum cleaner
were the same). When nanosilica is poured into the container, the size of the entrained
particles was 154 nm and the concentration was 523,879 particle/cc, which is a 25-fold
increase in the concentration compared to the background concentration. On the other hand,
when the nanosilica particles were suctioned, the size of the particles measured at the
exhaust vent of the vacuum cleaner was 11.5 nm and their concentration was 67,437
particle/cc, three times more than the background concentration (Fig. 6).
The nanoparticles were confirmed to be produced only one of the several exhaust vent.
Thus, the nanoparticles that entered the chamber through the inlet at high speed were
observed to be discharged between the back cover/back housing (where leakage occurs),
without going through the HEPA filter.
Temperature, humidity, and wind speed
The average temperature was 27.6°C (SD 4.0°C), and the humidity, 39.9% (SD 12.9%). The
wind speed was 10 m/s at the vacuum cleaner inlet (The flow volume was 0.0158
m3/s), 3 m/s at the outlet, and less than 0.5 m/s at the table (3 m from the
vacuum cleaner).
Discussion
Compact type instruments recently developed
The recently developed SMPS 3910 and DM are compact type portable devices suitable for
workplace assessment. In particular, DM can also be used for collecting personal
samples.
However, not enough assessment cases exist that has used these devices in workplaces, and
concerns may be raised regarding their performance level in comparison with conventional
devices. In our study, SMPS 3910 clearly displayed multi-modal distribution during the
silica treatment process in which number concentration of nanoparticles was high
(>105 particles/cc) and thus proved its suitability for workplace
application. Nevertheless, because the size channel of SMPS 3910 is only 13, its accuracy
of measuring the particle size distribution and particle size may be occasionally lower
than the conventional multi-channel SMPS, despite its advantage of shorter measuring time.
Moreover, according to our experience, it is necessary to regularly clean and check the
device to prevent occasional flow and pulse errors, especially after the use in a
high-concentration workplace.
In this study, the mean particle number concentration measured with DM showed an
approximately 30% higher average value than that measured with SMPS, presumably on account
of the different measurement ranges of the two devices. However, DM measures were 270%
higher than SMPS measures during the handling of silica. The exact reason for this result
is not clear, but Mills et al. (2013) reported that DM’s accuracy
decreases in the presence of particles exceeding 300 nm in diameter, yielding too high
measures with an error range up to +101%, and during the handling of nanosilica in the
workplace of this study, the particle agglomerates showed sub-micron sizes exceeding
300 nm and even several microns (Fig. 5).
On the contrary, while Fierz et al. (2011) reported that DM clearly
tended to overestimate particle diameters in broader particle size distributions
(GSD>2), the GSD in our study was less than 2 in all work processes. Table 2 shows that the particles sizes measured by
SMPS and DM in our workplace are similar.
Personal sampling and area sampling using real-time instruments
Because of the lack of appropriate real-time measurement tools for the assessment of
nanoparticles in personal samples, however, most assessments were performed on the area
samples. Collection and analysis of personal samples are required in order to precisely
measure the degree of worker exposure to nanoparticles13).
Our study performed a simultaneous assessment and comparison of personal samples and area
samples by using two DM instruments. The results revealed that the particle number
concentration was 1.6 times higher and that some tasks were not covered in the area
sampling. This is due to the limited mobility of the area samples and the consequent
impossibility to reflect all varying concentration depending on worker activities, given
the distance between the measurement spot and working area. The workplace where we
conducted the study was of a scale (104 m2) small enough such that the distance
between the measurement spot and each operation was within 1–3 m (except for the drying
machine). The possibility of underestimating the particle concentration in area sampling
increases in proportion to the increase in the size of the workplace, the distance to the
measurement spot, and the distance of movement to carry out the activities.
Particle size
It is very important to identify the aerosol characteristics in nanomaterial handing
process, because particle size is a key metric affecting the risks of manufactured
nanomaterials. The mode calculated while transferring nanosilica into the container was
154 nm in our study as well. The mode of the nanosilica emitted through the vacuum
cleaner, however, was 11.5 nm, which is close to the primary size (7 nm). This may be
because the rapid suctioning of nanoparticles into the vacuum cleaner reduced the
coagulation between particles and increased the dustiness. Dustiness is a major
determinant of worker exposure while handling powder14). The dustiness of fumed oxides, including nanosilica, is
one of the highest among nanoparticles15). Despite their primary size of 100 nm or less, most
nanoparticles grow to over 100 nm by the time they are emitted to the air due to the
coagulation among particles. For example, a typical CNF measures 200–400 nm (SMPS mode
size)16); 200 nm (ELPI
mode size)17), CNTs, over 1
µm (microscopy size)18, 19); metal oxides, 0.1–1.0 µm (microscopy
size)20); carbon black
over 1 µm (SMPS mode size)21); and Silver (Ag), 150 nm (SMPS mode size)22). Various results from dustiness
tests on carbon fiber and metallic nanoparticles also reported that all nanoparticles
measured over 300 nm in mode15). The particle size distribution was reported to be
300–600 nm during a bag-emptying activity of somewhat bigger nanosilica (primary size
12 nm, surface area200 g/m3) than that used in our study23).
Filter sampling and nanosilica analysis
In recent years, battery-powered small real-time instruments capable of measuring the
particle number concentration of nanoscale particles have been developed, thus
facilitating the assessment of nanoparticles in personal samples. Nevertheless, the
limitation of particle number concentration measurement remains because it is impossible
to differentiate between operation-generated nanoparticles and background nanoparticles.
Therefore, many studies emphasize the mass concentration assessment through filter-based
sampling20, 24, 25). Data available on occupational exposure of
nanosilica is not sufficient: the total dust concentration in a factory that manufactures
fumed silica was 0.61–6.5 mg/m3, and the respirable dust concentration
0.2–2.1 mg/m3. In a factory that manufactures nanosilica using a wet process,
a total dust concentration of 1.0–8.8 mg/m3 and a respirable dust concentration
of 0.5–2.1 mg/m3 were observed26). These results reveal that workers are exposed to a high
concentration of nanosilica in a nanosilica manufacturing factory, but the difference in
concentration relative to the manufacturing method cannot be ascertained clearly. However,
those studies assessed only the mass concentration of micro particles, and there is a need
for assessment of nanoparticles. In order to analyze the mass concentration of silica,
which is a metal oxide; assessment can be performed by means of filter sampling, followed
by XRD or FTIR. NIOSH 7501 is a representative XRD method for the assessment of amorphous
silica12). The FTIR
method has the disadvantage of sensitivity to interference materials, but unlike XRD, it
analyzes amorphous silica directly. Care should be taken with respect to reference
material selection, too, because XRD and FTIR show different reaction values depending on
particle size. Uncontaminated nanosilica used in workplace is considered the most suitable
reference material. As shown in the present study, the mass concentration on the filter on
the first and second day was similar, but on the second day, no silica was detected in the
FTIR analysis. Therefore, XRD or FTIR analysis lends itself well to the nanosilica
exposure assessment. Another important observation is that the detection limit of XRD or
FTIR method is 0.01 mg/m3(assuming a sampling of 8 h at flow volume of 1l of
general SMPS). Moreover, after converting this concentration into a particle number
concentration in accordance with the results reported by Broekhuizen et
al. (2012)27),
analysis can be performed only at concentration exceeding 954,930 particles/cc when the
nanosilica size is 20 nm, and 7,639 particles/cc when the nanosilica size is 100 nm.
Vacuum cleaner as a source of particle emission
In the present study, the vacuum cleaner analysis was performed in 4 steps as described
in the Methods section. The 1st step was the SMPS measurement of background concentration,
and in the 2nd step, the measurement was made when only the vacuum cleaner was on. While
no significant difference was observed in SMPS particle size distributions between the 1st
and 2nd stages, a conspicuous difference was demonstrated in the number
concentration/particle size distribution between the measurement at the vacuum cleaner
outlet and that of the ambient air during the off-state of the vacuum cleaner, as shown in
the 3rd and 4th step experiments. From this, it can be inferred that the leak occurred in
the vacuum cleaner. In particular, since the SMPS measurement was performed in the
immediate vicinity of the vacuum clear outlet with a very strong outflow of air, there was
hardly any possibility of other particles being measured than those leaking from the
vacuum cleaner.
Vacuum cleaners are known to be sources of fine and ultrafine particles. A HEPA filter
refers to a filter capable of capturing more than 99.97% of 0.3 µm sized
particles. In other words, HEPA-filtered vacuum cleaners can capture almost all particles
bigger than 0.3 µm28). The most-penetrating particle size, MPPS, being 0.3
µm, particles smaller than this size will have an even higher rate of
capture according to the single-fiber filtration theory. The result of the assessment on
p100 filter mask under the same conditions as on the HEPA filter showed very low values of
MPPS (30–60 nm) and a 0.009% penetration rate29).
The vacuum inlet speed measured in the present study was 10 m/s and the outlet speed was
3 m/s, which is very rapid. The rate of capture decreases as the speed increases30, 31). In particular, if the speed exceeds 0.5 m/s,
particularly, particles hit the fiber and bounce, continuing to pass through the
filter31). There are few
objective data, if any, regarding this aspect of a vacuum cleaner.
Summing up the results of our study described above, the high concentration of
nanoparticles caused by the vacuum cleaner is rather attributable to the leakage in the
vacuum cleaner than to the nanoparticles that passed through the HEPA filter. Willeke
et al. (2001)28) reported the occurrence of leakage, caused by an inadequate
sealing between bag housing and bag cover (which was large with a long perimeter), of the
particles that did not pass through the HEPA filter. Additionally, there are some related
reports that found nanomaterial releases from a vacuum cleaner in carbon nanotube handling
process32, 33).
On the other hand, the structure of the vacuum cleaner itself caused leakage of
109 ultrafine particles/min due to the abrasion of the commutator and the
carbon brush of the motor34).
In our study, however, no increase of nanoparticles was observed while the vacuum cleaner
was on. The reason is that recent models of vacuum cleaners use brushless motors and hence
cannot cause leakage of carbon ultrafine particles.
Limitation
We are aware that a comparative assessment of many different vacuum cleaners under various
conditions, as performed in a study by Knibbs et al. (2012)4), can enhance the value of this
study, but the focus of our study was on the vacuum cleaner analysis in a real job setting
of a real-life workplace. Therefore, the results of this study cannot be generalized,
because this study was conducted at one workplace and the size and concentration of the
nanoparticles emitted from the vacuum cleaner depend on the type of nanoparticles and the
state of the vacuum cleaner. Therefore, further study is required in better designed
conditions. Nevertheless, this study is meaningful as the first experiment conducted in real
job setting that generate nanoparticles.
Conclusion
Exposure monitoring was performed in a workplace handling nanosilica under simultaneous use
of real-time measurement instruments and traditional filter measurement method.
Exposure to nanosilica emitted to the air occurred while pouring nanosilica into the
container or transferring the container. The use of a vacuum cleaner with leakage also
caused the emission of nanosilica within the workplace. The sizes of nanosilica particles
emitted into the air in occupational environments where nanosilica is treated exceeded
100 nm, or were of micro-scale due to the coagulation of particles, but the nanosilica that
leaked out of the vacuum cleaner had smaller sizes close to the primary size. Nanoparticles
were generated also during the operation of the filter press and ultrasonic cleaning, but
they were oil particles and water particles, respectively.
The area sample measurement resulted in 20% (60% in terms of peak concentration) less than
the personal sample measurement. The area sample measurement was limited when the activities
were carried out at a longer distance or were of short duration.
The use of HEPA-filtered Thermo-Hygrostat in the workplace reduced the concentration of
nanoparticles and lowered the background concentration.
To conclude, high-concentration nanoparticles are emitted to the air while pouring and
transferring nanosilica. Therefore, a respirator capable of capturing nanoparticles must be
worn, and activities must be carried out within the HEPA-filtered hood. A regular check on
the vacuum cleaner is necessary to prevent leakage of nanoparticles. Additionally, wet
cleaning is safer in reducing exposure risk.
Acknowledgements
We thank two anonymous reviewers for their helpful comments that improved an earlier
version of this article. and thank Dr. Sewan Oh (Ministry of Employment and Labor) for his
support.
References
- 1) National Institute of Environmental
Research (NIER) Report on the investigation for nanomaterial circulation
in 2010. Incheon, Korea: 2012 (in Korean).
- 2) Napierska
D, Thomassen
LC, Lison
D, Martens
JA, Hoet
PH (2010)
The nanosilica hazard: another variable entity.
Part Fibre Toxicol 7, 39.
- 3) Murashov
V, Schulte
P, Geraci
C, Howard
J (2011)
Regulatory approaches to worker protection in nanotechnology industry in
the USA and European union. Ind
Health 49, 280–96.
- 4) Knibbs
LD, He
C, Duchaine
C, Morawska
L (2012)
Vacuum cleaner emissions as a source of indoor exposure to airborne
particles and bacteria. Environ Sci
Technol 46, 534–42.
- 5) NIOSH (2012)
General safe practices for working with engineered nanomaterials in research laboratories.
National Institute for Occupational Safety and Health, Washington.
- 6) Clark
K, Tongeren
M,
Christensen
F, Brouwer
D, Nowack
B, Gottschalk
F, Micheletti
C, Schmid
K, Gerritsen
R, Aitken
R, Vaquero
C, Gkanis
V, Housiadas
C, Ipiña
J, Riediker
M (2012)
Limitations and information needs for engineered nanomaterial-specific
exposure estimation and scenarios: recommendations for improved reporting
practices. J Nanopart Res 14,
970.
- 7) Fierz
M, Houle
C, Steigmeier
P, Burtscher
H (2011)
Design, calibration, and field performance of a miniature diffusion size
classifier. Aerosol Sci Technol 45,
1–10.
- 8) Ono-Ogasawara
M, Serita
F, Takaya
M (2009)
Distinguishing nanomaterial particles from background airborne
particulate matter for quantitative exposure assessment. J
Nanopart Res 11, 1651–9.
- 9) Kuhlbusch
TA, Asbach
C, Fissan
H, Göhler
D, Stintz
M (2011)
Nanoparticle exposure at nanotechnology workplaces: a
review. Part Fibre Toxicol 8,
22.
- 10) Ramachandran
G, Ostraat
M, Evans
DE, Methner
MM,
O’Shaughnessy
P, D’Arcy
J, Geraci
CL, Stevenson
E, Maynard
A, Rickabaugh
K (2011)
A strategy for assessing workplace exposures to
nanomaterials. J Occup Environ Hyg 8,
673–85.
- 11) Brouwer
D, Berges
M, Virji
MA, Fransman
W, Bello
D, Hodson
L, Gabriel
S, Tielemans
E (2012)
Harmonization of measurement strategies for exposure to manufactured
nano-objects; report of a workshop. Ann Occup
Hyg 56, 1–9.
- 12) NIOSH (2003)
Manual of analytical methods (NMAM). 4th Ed., silica, amorphous. National Institute for
Occupational Safety and Health, Cincinnati.
- 13) Kim
B, Lee
JS, Choi
BS, Park
SY, Yoon
JH, Kim
H (2013)
Ultrafine particle characteristics in a rubber manufacturing
factory. Ann Occup Hyg 57,
728–39.
- 14) Brouwer
DH, Links
IH, De Vreede
SA,
Christopher
Y (2006)
Size selective dustiness and exposure; simulated workplace
comparisons. Ann Occup Hyg 50,
445–52.
- 15) Evans
DE, Turkevich
LA, Roettgers
CT, Deye
GJ, Baron
PA (2013)
Dustiness of fine and nanoscale powders. Ann
Occup Hyg 57, 261–77.
- 16) Ku
BK, Emery
MS, Maynard
AD,
Stolzenburg
MR, McMurry
PH (2006)
In situ structure characterization of airborne carbon nanofibres by a
tandem mobility-mass analysis.
Nanotechnology 17,
3613–21.
- 17) Evans
DE, Ku
BK, Birch
ME, Dunn
KH (2010)
Aerosol monitoring during carbon nanofiber production: mobile
direct-reading sampling. Ann Occup
Hyg 54, 514–31.
- 18) Maynard
AD, Baron
PA, Foley
M, Shvedova
AA, Kisin
ER,
Castranova
V (2004)
Exposure to carbon nanotube material: aerosol release during the handling
of unrefined single-walled carbon nanotube material. J Toxicol
Environ Health A 67, 87–107.
- 19) Cena
LG, Peters
TM (2011)
Characterization and control of airborne particles emitted during
production of epoxy/carbon nanotube nanocomposites. J Occup
Environ Hyg 8, 86–92.
- 20) Curwin
B, Bertke
S (2011)
Exposure characterization of metal oxide nanoparticles in the
workplace. J Occup Environ Hyg 8,
580–7.
- 21) Kuhlbusch
TA, Neumann
S, Fissan
H (2004)
Number size distribution, mass concentration, and particle composition of
PM1, PM2.5, and PM10 in bag filling areas of carbon black production.
J Occup Environ Hyg 1,
660–71.
- 22) Lee
JH, Kwon
M, Ji
JH, Kang
CS, Ahn
KH, Han
JH, Yu
IJ (2011)
Exposure assessment of workplaces manufacturing nanosized TiO2 and
silver. Inhal Toxicol 23,
226–36.
- 23) Brouwer
D,
Duuren-Stuurman
B, Berges
M, Jankowska
E, Bard
D, Mark
D (2009)
From workplace air measurement results toward estimates of exposure?
Development of a strategy to assess exposure to manufactured
nano-objects. J Nanopart Res 11,
1867–81.
- 24) Dahm
MM, Evans
DE,
Schubauer-Berigan
MK, Birch
ME, Fernback
JE (2012)
Occupational exposure assessment in carbon nanotube and nanofiber primary
and secondary manufacturers. Ann Occup
Hyg 56, 542–56.
- 25) Lee
JH, Ahn
KH, Kim
SM, Jeon
KS, Lee
JS, Yu
IJ (2012)
Continuous 3-day exposure assessment of workplace manufacturing silver
nanoparticles. J Nanopart Res 14,
1134.
- 26) IARC (1997)
Monographs on the evaluation of carcinogenic risk of chemicals to humans. Vol. 68. Silica
Lyon, France: International Agency for Research on Cancer.
- 27) van
Broekhuizen
P, van Veelen
W, Streekstra
WH, Schulte
P, Reijnders
L (2012)
Exposure limits for nanoparticles: report of an international workshop on
nano reference values. Ann Occup
Hyg 56, 515–24.
- 28) Willeke
K, Trakumas
S, Grinshpun
SA, Reponen
T, Trunov
M, Friedman
W (2001)
Test methods for evaluating the filtration and particulate emission
characteristics of vacuum cleaners.
AIHAJ 62, 313–21.
- 29) Rengasamy
S, Eimer
BC, Shaffer
RE (2009)
Comparison of nanoparticle filtration performance of NIOSH-approved and
CE-marked particulate filtering facepiece respirators. Ann Occup
Hyg 53, 117–28.
- 30) Mostofi
R, Wang
B, Haghighat
F, Bahloul
A, Jaime
L (2010)
Performance of mechanical filters and respirators for capturing
nanoparticles—limitations and future direction. Ind
Health 48, 296–304.
- 31) Hinds
W (1999) Aerosol
technology: properties, behavior, and measurement of airborne particles. 2nd Ed. John
Wiley and Sons, New York.
- 32) Mills
JB, Park
JH, Peters
TM (2013)
Comparison of the DiSCmini aerosol monitor to a handheld condensation
particle counter and a scanning mobility particle sizer for submicrometer sodium
chloride and metal aerosols. J Occup Environ
Hyg 10, 250–8.
- 33) Ogura
I, Sakurai
H, Mizuno
K, Gamo
M (2011)
Release potential of single-wall carbon nanotubes produced by
super-growth method during manufacturing and handling. J
Nanopart Res 13, 1265–80.
- 34) Lioy
PJ, Wainman
T, Zhang
J, Goldsmith
S (1999)
Typical household vacuum cleaners: the collection efficiency and
emissions characteristics for fine particles. J Air Waste Manag
Assoc 49, 200–6.