Abstract
This study aimed to investigate the reliability and construct validity of a new version
of the Brief Job Stress Questionnaire (New BJSQ), which measures an extended set of
psychosocial factors at work by adding new scales/items to the current version of the
BJSQ. Additional scales/items were extensively collected from theoretical job stress
models and similar questionnaires in several countries. Scales/items were field-tested and
refined through a pilot internet survey. Finally, an 84-item questionnaire (141 items in
total when combined with the current BJSQ) was developed. A nationally representative
survey was administered to employees in Japan (n=1,633) to
examine the reliability and construct validity. Most scales showed acceptable levels of
internal consistency and test-retest reliability. Principal component analyses showed that
the first factor explained 50% or greater proportion of the variance in most scales. A
scale factor analysis and a correlation analysis showed that these scales fit the
theoretical expectations. These findings provided a piece of evidence that the New BJSQ
scales are reliable and valid. Although more detailed content and construct validity
should be examined in future study, the New BJSQ is a useful instrument to evaluate
psychosocial work environment and positive mental health outcomes in the current
workplace.
Introduction
In Japan, the number of workers with mental health problems is increasing1) and thus primary prevention of mental health
problems is a high priority for both employers and employees. Previous studies have shown
that “assessing and improving work environment” effectively reduces mental health
problems2, 3); thus, the Brief Job Stress Questionnaire (BJSQ)4) and Job Stress Assessment Diagram
(JSAD)5) have been developed with an aim
to assess and improve work environment in Japan. The BJSQ and JSAD have been widely used in
research and practice in the field of mental health in the workplace in Japan6, 7).
However, more than 10 years have passed since the development of these tools and since
then, the field of prevention of job stress and workplace mental health has developed
rapidly. First, in addition to the traditional job demands-control model8), the effort-reward imbalance (ERI) model has
been proposed9) and found to be associated
with various health problems, such as poor mental health and cardiovascular diseases
(CVD)10,11,12,13). Second, recent research in this field has focused on higher-level
organizational factors, such as organizational justice (i.e., the extent to which employees
perceive workplace decision-making procedures and interactions to be fair)14) and workplace social capital (i.e., shared
values, attitudes, and norms of trust and reciprocity as well as practices of collective
action in their work unit)15). These
organizational factors were also found to be associated with poor mental health and CVD12, 16,17,18).
Third, advancing research on work-family interference has indicated that both negative and
positive spillovers from work life to non-work life are important factors in worker mental
health19,20,21). Fourth, with the
introduction of the positive psychology to this field, positive attitude at work, such as
work engagement22), has received an
increased attention as an alternative mental health and well-being outcome among workers.
Finally, workplace bullying or harassment at work has become a prominent problem in
occupational health23, 24). However, these newly-proposed factors and outcomes cannot
be measured by the current BJSQ; thus, they should be measured with a short questionnaire
that would easily assess psychosocial workplace environments as well as their employees
(i.e., health-related) and organizational (i.e., business-related) outcomes in the
practice.
Such multidimensional and comprehensive assessment of these traditional and newly-proposed
psychosocial factors and outcomes complies with psychosocial risk management framework in
European countries, such as Psychosocial Risk Management-European Framework (PRIMA-EF)25) and the UK Health and Safety Executive’s
(HSE) Management Standards for work related stress26). PRIMA-EF is a part of the World Health Organization’s Healthy
Workplaces Framework27) which proposes the
healthy workplace model: a comprehensive way of thinking and acting that addresses
work-related physical and psychosocial risks; promotion and support of healthy behaviors;
and broader social and environmental determinants. On the other hand, the UK HSE Management
Standards cover six primary sources of stress at work, such as demands, control, support
(managerial support and peer support), relationship (conflict and unacceptable behavior),
role (role ambiguity and role conflict), and change (preparedness to organizational
changes),which are associated with poor health and well-being, lower productivity, and
increased sickness absence.
Therefore, the purpose of the present study was to develop a new version of the Brief Job
Stress Questionnaire (New BJSQ), which can assess job demands and job resources as well as
employee and organizational outcomes multidimensionally and comprehensively by adding its
scales/items to the current version of the BJSQ.
Methods
Development of an item pool
1) Review of the current BJSQ scales
First, we reviewed the current BJSQ scales to assess what scales should be newly added.
The BJSQ is a 57-item questionnaire developed in Japan4). The items of the scales are measured on a four-point
Likert-type response option and assess a wide range of psychosocial work environments,
stress reactions, and buffering factors based on the job stress model proposed by the
group of researchers from the US National Institute for Occupational Safety and Health
(NIOSH)28). Regarding job stressors,
the instrument measures quantitative job overload (three items), qualitative job
overload (three items), physical demands (one item), job control (three items), skill
(under) utilization (one item), interpersonal conflict (three items), poor physical
environment (one item), suitable jobs (one item), and intrinsic rewards (one item). For
buffering factors, supervisor support (three items) and coworker support (three items)
as well as support from family and friends (three items) are measured. An 18-item scale
measures five aspects of psychological distress or mood: vigor (three items),
anger-irritability (three items), fatigue (three items), anxiety (three items), and
depression (six items). Another 11-item scale is prepared to measure physical complaints
or physical stress reactions. The BJSQ also measures job satisfaction and life
satisfaction (one item for each). All of these scales have been proven to show
acceptable or high levels of internal consistency reliability and factor-based
validity4). We concluded that the
current BJSQ measured basic elements of task-level psychosocial work environment based
on the job demands-control and demand-control-support models8, 29) as well as
psychological and physical health outcomes while it did not measure workgroup- or
organizational-level factors or positive mental health outcomes.
2) Collection of scales and items based on recent theories on job stress
We collected scales and items related to “job demands (i.e., physical, social, or
organizational job aspects that require sustained physical and/or psychological effort
and are associated with certain physiological and/or psychological costs)”, “job
resources (i.e., physical, psychological, social, or organizational job aspects that may
be functional in achieving work-related goals; reduce job demands and the associated
physiological and psychological costs; and stimulate personal growth and development)”,
or “outcomes” and evaluated suitability of these for the New BJSQ based on three
sources: recent theories of job stress, already-established questionnaires of job
stress, and a series of meetings with stakeholders. We first reviewed the relevant
literature to find recent theories on job stress and their measures that were developed
in the last 10 years but not used in the current BJSQ. This work indentified several
theories, including ERI model9),
emotional demands30), bullying and
mobbing23, 24), organizational justice (procedural justice and interactional
justice)31,32,33), and workplace social
capital15) as job demands and
resources; and work engagement22) as a
potential outcome. Although a large part of these scales and items have been reported
their reliability and validity, our original items were partly included in the item
pool. The established scales for these constructs were also reviewed and their items
were included in the item pool of the New BJSQ. Each “job resources” scale was
classified into three levels, i.e., “task-level”, “workgroup-level”, and
“organizational-level” in order to indicate targets of a relevant intervention. Some
proposed scales were combined because of their conceptual overlap (e.g., role ambiguity
and role clarity).
3) Collection of scales and items from previous questionnaires
We also reviewed questionnaires and/or published guidance of job stress and related
variables, which were used in practice. These included PRIMA-EF25), which provided a list of wide range of psychosocial
work environments that could be related to worker mental health. The UK HSE Management
Standards for work related stress26)
developed a questionnaire to measure six aspects of work environment mentioned earlier:
demands, control, support, relationship, role, and change. The second version of the
Copenhagen Psychosocial Questionnaire (COPSOQ II)34) was designed to measure a wide range of psychosocial factors,
but the instrument was particularly unique in that it measures emotional demands,
predictability, possibilities for development, quality of leadership, social community
at work and trust (as a part of workplace social capital), justice and respect, and
family-work (im) balance. The Korean Occupational Stress Scale (KOSS)35), developed in an Asian country, was
also used as a reference. It measures eight dimensions of psychosocial work environment:
physical environment, job demand, insufficient job control, interpersonal conflict, job
insecurity, organizational system, lack of reward, and occupational climate. We compared
the scales included in these questionnaires to cover all these concepts in the New
BJSQ.
4) Proposal of additional scales from stakeholder meetings
We held a series of stakeholder meetings, which were held twice a year attended by
researchers from five institutes/departments of occupational safety and health,
occupational health staffs (physicians, nurses, and hygienists), and representatives of
two employer associations and one employee association. Based on group discussions in
the meetings, several new concepts of job resources were proposed. (1) “Workplace where
people compliment each other” measures a workplace in which workers are appropriately
appreciated and comprises items that may overlap with items of reward at work to some
extent even though the reward scale did not specifically intend to measure this aspect
of work. (2) “Workplace where mistakes are acceptable” assesses a workplace in which
workers have a chance to recover even if they failed or made a mistake at work. (3)
“Diversity” concerns worker diversity, particularly in terms of psychological
differences by gender, age, and employment status. These aspects of organizational
characteristics were added to the scale/item pool to create the New BJSQ.
Candidate scales/items for the pilot study
Through the process described above, we developed the trial version of the New BJSQ
comprising 34 scales (129 items). These were “quantitative job overload”, “emotional
demands”, “role conflict”, “work-self balance (negative)”, and “workplace harassment”
classified as “job demands” (five scales, 14 items); “meaningfulness of work”, “job
control”, “role clarity”, “career opportunity”, “novelty”, and “predictability” classified
as “task-level job resources” (six scales, 19 items); “monetary/status reward”, “esteem
reward”, “job security”, “leadership”, “interactional justice”, “workplace where people
compliment each other”, “workplace where mistakes are acceptable”, “collective efficacy
(i.e., team members’ believe that they can successfully organize and execute the courses
of action required to accomplish given goals)36)”, and “workplace social capital” classified as “workgroup-level
job resources” (nine scales, 38 items); “trust with management”, “preparedness for
change”, “procedural justice”, “respect for individuals”, “fair personnel evaluation”,
“diversity”, “career development”, and “work-self balance (positive)” classified as
“organizational-level job resources” (eight scales, 33 items); and “work engagement”,
“performance of a duty”, “realization of creativity”, “active learning”, “work
performance”, and “others” classified as “outcomes” (six scales, 25 items).
A pilot internet survey
On March 17, 2010, Japanese employees aged 15 yr or older who registered with Yahoo!
Research monitors were invited to complete an anonymous web-based self-administered
questionnaire including the current BJSQ and a trial version of the New BJSQ. On the same
day, the number of respondents reached 1,000 (687 men and 313 women) and the survey was
terminated. Based on the data from these 1,000 respondents, we further reduced the number
of items and developed a final “standard” version of the New BJSQ. We calculated
Cronbach’s alpha coefficient and item-total correlation coefficients (ITCs) for each
candidate scale, and if possible, limited the number of items to two or three, five at
maximum, in reference to opinion of occupational health staffs (e.g., occupational
physicians, occupational health nurses, and clinical psychologists). Finally, the final
“standard” version of the New BJSQ comprised 30 scales and 84 items (49 scales and 141
items in total when combined with the current 57-item BJSQ) (Table 1). All New BJSQ scales are available at
http://www.jstress.net (only in Japanese language).
Table 1.
Scales and the number of items on the Brief Job Stress Questionnaire (BJSQ) and
New BJSQ
| Scales † |
BJSQ (B) or
New BJSQ (N) |
Number of items
(BJSQ + New BJSQ) |
| Job demands |
|
|
| 1. Quantitative job overload |
B |
3 |
| 2. Qualitative job overload |
B |
3 |
| 3. Physical demands |
B |
1 |
| 4. Interpersonal conflict |
B |
3 |
| 5. Poor physical environment |
B |
1 |
| 6. Emotional demands |
N |
3 |
| 7. Role conflict |
N |
3 |
| 8. Work-self balance (negative) |
N |
2 |
| Job resources: task-level |
|
|
| 9. Job control |
B |
3 |
| 10. Suitable jobs |
B |
1 |
| 11. Skill utilization |
B |
1 |
| 12. Meaningfulness of work |
B/N ‡ |
3 |
| 13. Role clarity |
N |
3 |
| 14. Career opportunity |
N |
3 |
| 15. Novelty |
N |
3 |
| 16. Predictability |
N |
3 |
| Job resources: workgroup-level |
|
|
| 17. Supervisor support |
B |
3 |
| 18. Coworker support |
B |
3 |
| 19. [Support from family and friends] |
B |
3 |
| 20. Monetary/status reward |
N |
2 |
| 21. Esteem reward |
N |
2 |
| 22. Job security |
N |
3 |
| 23. Leadership |
N |
3 |
| 24. Interactional justice |
N |
3 |
| 25. Workplace where people compliment each other |
N |
3 |
| 26. Workplace where mistakes are acceptable |
N |
2 |
| 27. Collective efficacy |
N |
3 |
| Job resources: organizational-level |
|
|
| 28. Trust with management |
N |
3 |
| 29. Preparedness for change |
N |
3 |
| 30. Procedural justice |
N |
3 |
| 31. Respect for individuals |
N |
3 |
| 32. Fair personnel evaluation |
N |
3 |
| 33. Diversity |
N |
3 |
| 34. Career development |
N |
5 |
| 35. Work-self balance (positive) |
N |
2 |
| Outcomes |
|
|
| 36. Vigor |
B |
3 |
| 37. Anger-irritability |
B |
3 |
| 38. Fatigue |
B |
3 |
| 39. Anxiety |
B |
3 |
| 40. Depression |
B |
6 |
| 41. Physical stress reaction |
B |
11 |
| 42. Job satisfaction |
B |
1 |
| 43. [Satisfaction with family life] |
B |
1 |
| 44. Workplace harassment |
N |
2 |
| 45. Workplace social capital |
N |
3 |
| 46. Work engagement |
N |
2 |
| 47. Performance of a duty |
N |
3 |
| 48. Realization of creativity |
N |
3 |
| 49. Active learning |
N |
3 |
| Total number of items |
|
141 |
† [ ] indicates non-work environment or outcome. ‡ A three-item scale was constructed
for the New BJSQ by adding two items to its one-item BJSQ scale on intrinsic
reward.
To test reliability and validity and obtain normative scores of the New BJSQ, we
conducted cross-sectional and one-year prospective studies of a nationally
representative sample of workers in Japan. In November 2010, a self-administered
questionnaire was mailed to 5,000 Japanese people aged 20–60 years selected by a
two-stage random sampling. More specifically, we firstly selected 100 municipalities
randomly by considering the population size and then selected 50 residents randomly from
each municipality using the population registry. If the selected municipality did not
allow us to access population registry, we randomly selected another municipality. By
February 2011, we received 2,400 completed questionnaires, of which 2,384 were valid
(response rate, 47.7%). Among the respondents, 1,633 respondents (847 men and 786 women)
were classified as being employed. Out of these 1,633 employed respondents, 479 agreed
to participate in a follow-up survey. In November 2011, the same questionnaires were
sent to these participants and 417 questionnaires (202 men and 215 women) were returned
by December 2011 (response rate, 87.1%). Detailed characteristics of participants are
shown in Table 2. The Ethics Committee of
the Graduate School of Medicine/Faculty of Medicine, The University of Tokyo reviewed
and approved aims, designs, and procedures of the internet-based pilot study, the
cross-sectional and prospective studies, as well as the aforementioned pilot internet
survey (No. 2953).
Table 2.
Demographic characteristics among employees who participated in the baseline
survey (
N = 1,633) and one-year follow-up survey
(
N = 417)
| Demographic characteristics |
Baseline |
|
One-year follow-up |
| n (%) |
Average (SD) |
n (%) |
Average (SD) |
| Gender |
|
|
|
|
|
|
Men |
847 (51.9) |
|
202 (48.4) |
|
| Women |
786 (48.1) |
|
215 (51.6) |
|
| Age |
|
|
|
|
|
29 yr old or less |
254 (15.6) |
|
41 (9.8) |
|
| 30–39 yr old |
450 (27.6) |
|
107 (25.7) |
|
| 40–49 yr old |
464 (28.4) |
|
129 (30.9) |
|
| 50–59 yr old |
426 (26.1) |
|
129 (30.9) |
|
| 60 yr old or more |
39 (2.4) |
|
11 (2.6) |
|
| Occupation |
|
|
|
|
|
Managers |
152 (9.3) |
|
42 (10.1) |
|
| Professionals and Technicians |
363 (22.2) |
|
95 (22.8) |
|
| Clerks |
301 (18.4) |
|
75 (18.0) |
|
| Sales workers |
171 (10.5) |
|
40 (9.6) |
|
| Service workers |
165 (10.1) |
|
50 (12.0) |
|
| Transportation and telecommunications |
70 (4.3) |
|
14 (3.4) |
|
| Production workers and laborers |
252 (15.4) |
|
55 (13.2) |
|
| Others |
147 (9.0) |
|
45 (10.8) |
|
| Unknown |
12 (0.7) |
|
1 (0.2) |
|
| Employment contract |
|
|
|
|
|
Company president and executives |
37 (2.3) |
|
7 (1.7) |
|
| Permanent employees |
1,051 (64.4) |
|
256 (61.4) |
|
| Temporary employees |
39 (2.4) |
|
7 (1.7) |
|
| Contract employees |
99 (6.1) |
|
29 (7.0) |
|
| Part-time workers |
383 (23.5) |
|
113 (27.1) |
|
| Others |
20 (1.2) |
|
5 (1.2) |
|
| Unknown |
4 (0.2) |
|
– (0.0) |
|
| Working hours in the past month |
|
172.3 (55.9) |
|
168.0 (53.7) |
| Company size (number of employees) |
|
|
|
|
|
1–20 |
282 (17.3) |
|
64 (15.3) |
|
| 21–49 |
156 (9.6) |
|
39 (9.4) |
|
| 50–99 |
134 (8.2) |
|
46 (11.0) |
|
| 100–299 |
243 (14.9) |
|
50 (12.0) |
|
| 300–499 |
106 (6.5) |
|
33 (7.9) |
|
| 500–999 |
126 (7.7) |
|
39 (9.4) |
|
| 1,000 or more |
441 (27.0) |
|
100 (24.0) |
|
| Civil service |
113 (6.9) |
|
39 (9.4) |
|
| Unknown |
32 (2.0) |
|
7 (1.7) |
|
The self-administered questionnaires at baseline and follow-up included all scales of
the current BJSQ and New BJSQ.
3) Statistical analysis
Based on the baseline cross-sectional data (1,633 employees), a national average and
standard deviation of each scale of the current BJSQ and New BJSQ were calculated for
the total sample. Unlike calculating a scale score as a sum of the item scores, in this
analysis, a scale score was calculated as an average item score (i.e., a sum of the item
scores divided by the number of items) ranging from 1 to 4 for all the scales of current
BJSQ and New BJSQ after converting all item scores so that higher scores indicated
better status (e.g., a higher score of job demands means lower job demands and a higher
score of psychological stress reaction means low level of psychological distress; on the
other hand, a higher score of job resources means higher job resources; for novelty, the
score was transformed that the higher score means greater frequency of encountering new
things at work). This procedure allowed us to standardize averages and ranges of scores
across scales and to interpret scale scores easier, making the comparison of the scale
scores more convenient.
Cronbach’s alpha coefficient for each scale was calculated to evaluate internal
consistency reliability. A proportion of variance explained by the first factor was
calculated for scales with more than one item to examine their factor-based validity.
Furthermore, based on the data from 417 respondents who completed the one-year
follow-up, Pearson’s correlation coefficients were calculated to evaluate one-year
test-retest reliability. For these analyses, a pair-wise deletion of cases rather than
list-wise deletion was used when items had a missing response.
Using 1,442 respondents who completed all the 34 psychosocial work environment scales
(excluding “support from family and friends” scale because of non-work environment),
exploratory and confirmatory factor analyses were conducted for 34 scales to see whether
the factor structure fit the job demands-resources (JD-R) model37), in which psychosocial work environment can be
classified into job demands and task-, workgroup-, and organizational-level job
resources. For exploratory factor analysis, the principal factor method with Oblimin
rotation was used to extract the number of factors based on the scree test criterion.
The scree test involves plotting the eigenvalues in descending order of their magnitude
against their factor numbers and determining where they level off. The break between
steep slope and leveling off indicates the number of meaningful factors. For
confirmatory factor analysis, model fit was assessed using fit indices including the
goodness of fit index (GFI), adjusted goodness of fit index (AGFI), comparative fit
index (CFI), and root mean square error of approximation (RMSEA) estimated by the
maximum likelihood method. To examine whether the data fit the JD-R model37), in which job demands predict negative
emotional reactions (such as burnout) while job resources, including task-level,
workgroup-level, and organizational-level, predict both negative and positive emotional
reactions (such as work engagement), polychoric correlation coefficients were calculated
between 35 scales (including “support from family and friends” scale) of psychosocial
work environment and selected outcomes (psychological and physical stress reactions,
work engagement, workplace social capital, and workplace harassment) using 1,398
respondents who completed all scales.
All the analyses were conducted using the IBM SPSS Statistics and Amos version 19.
Results
National average of the New BJSQ scores
For a nationally representative sample of 1,633 employees, average scores for most scales
of the current BJSQ and New BJSQ fell between 2.0 and 3.0, with an average of 2.6 (Table 3). The average score was higher for
workplace harassment (3.58), depression (3.27), and physical stress reactions (3.22) and
lower for work-self balance (positive), respect for individuals, quantitative job
overload, and fair personnel evaluation (2.10–2.15). More detailed information about the
national average scores by gender, occupation, employment type, and industry is available
at http://www.jstress.net (only in Japanese language).
Table 3.
Averages (and standard deviations, SDs) of the BJSQ and New BJSQ scores obtained
from a nationally representative survey of employees of Japan in 2010/2011 †
| Scales ‡ |
Number of items |
Average |
(SD) |
| 1. Quantitative job overload |
3 |
2.14 |
0.76 |
| 2. Qualitative job overload |
3 |
2.16 |
0.71 |
| 3. Physical demands |
1 |
2.49 |
1.08 |
| 4. Interpersonal conflict |
3 |
2.88 |
0.66 |
| 5. Poor physical environment |
1 |
2.78 |
0.99 |
| 6. Emotional demands |
3 |
2.65 |
0.82 |
| 7. Role conflict |
3 |
2.78 |
0.77 |
| 8. Work-self balance (negative) |
2 |
2.78 |
0.86 |
| Job demands summary |
|
2.58 |
0.51 |
| 9. Job control |
3 |
2.53 |
0.74 |
| 10. Suitable jobs |
1 |
2.92 |
0.80 |
| 11. Skill utilization |
1 |
3.00 |
0.85 |
| 12. Meaningfulness of work |
3 |
3.09 |
0.67 |
| 13. Role clarity |
3 |
3.16 |
0.59 |
| 14. Career opportunity |
3 |
2.68 |
0.81 |
| 15. Novelty |
3 |
2.78 |
0.80 |
| 16. Predictability |
3 |
2.46 |
0.73 |
| Task-level job resources summary |
|
2.90 |
0.49 |
| 17. Supervisor support |
3 |
2.37 |
0.75 |
| 18. Coworker support |
3 |
2.68 |
0.70 |
| 19. [Support from family and friends] |
3 |
3.31 |
0.68 |
| 20. Monetary/status reward |
2 |
2.41 |
0.79 |
| 21. Esteem reward |
2 |
2.72 |
0.67 |
| 22. Job security |
3 |
2.46 |
0.75 |
| 23. Leadership |
3 |
2.18 |
0.77 |
| 24. Interactional justice |
3 |
2.55 |
0.80 |
| 25. Workplace where people compliment each other |
3 |
2.42 |
0.82 |
| 26. Workplace where mistakes are acceptable |
2 |
2.26 |
0.78 |
| 27. Collective efficacy |
3 |
2.49 |
0.74 |
| Workgroup-level job resources summary |
|
2.45 |
0.54 |
| 28. Trust with management |
3 |
2.53 |
0.71 |
| 29. Preparedness for change |
3 |
2.48 |
0.72 |
| 30. Procedural justice |
3 |
2.27 |
0.73 |
| 31. Respect for individuals |
3 |
2.12 |
0.72 |
| 32. Fair personnel evaluation |
3 |
2.15 |
0.77 |
| 33. Diversity |
3 |
2.52 |
0.70 |
| 34. Career development |
5 |
2.19 |
0.74 |
| 35. Work-self balance (positive) |
2 |
2.10 |
0.78 |
| Organizational-level job resources summary |
|
2.29 |
0.56 |
| 36. Vigor |
3 |
2.26 |
0.79 |
| 37. Anger-irritability |
3 |
2.70 |
0.85 |
| 38. Fatigue |
3 |
2.70 |
0.88 |
| 39. Anxiety |
3 |
2.87 |
0.80 |
| 40. Depression |
6 |
3.27 |
0.67 |
| Psychological stress reaction (total) |
18 |
2.85 |
0.61 |
| 41. Physical stress reaction |
11 |
3.22 |
0.54 |
| 42. Job satisfaction |
1 |
2.60 |
0.85 |
| 43. [Satisfaction with family life] |
1 |
3.06 |
0.81 |
| 44. Workplace harassment |
2 |
3.58 |
0.67 |
| 45. Workplace social capital |
3 |
2.74 |
0.69 |
| 46. Work engagement |
2 |
2.52 |
0.77 |
| 47. Performance of a duty |
3 |
2.98 |
0.57 |
| 48. Realization of creativity |
3 |
2.67 |
0.72 |
| 49. Active learning |
3 |
2.55 |
0.72 |
† The number of respondents varied from 1,590 to 1,627 because of missing values. ‡ [
] indicates non-work environment or outcome. Each scale score was converted so that
the higher score indicates better state and ranges from 1 to 4. See text for more
details on scoring.
Almost all scales showed high internal consistency reliability (Cronbach’s alpha>0.70)
(Table 4). The Cronbach’s alpha coefficients
were moderate for interpersonal conflict, role clarity, predictability, job security, and
diversity (0.60–0.69). Furthermore, among 417 workers who completed one-year follow-up,
one-year test-retest reliability as measured by Pearson’s correlation coefficient was high
(0.50 or greater) for most scales while it was slightly lower for skill utilization, role
clarity, predictability, workplace harassment, and performance of a duty.
Table 4.
Internal consistency, one-year test-retest reliability, and factor based
validity of the BJSQ and New BJSQ scales
| Scales † |
n |
Cronbach’s alpha
coefficient |
Proportion explained
by the first factor (%) |
One-year test-retest
(Pearson’s correlation coefficient)
n = 373–389 |
| Job demands |
|
|
|
|
| 1. Quantitative job overload |
1,621 |
0.770 |
69.0 |
0.655*** |
| 2. Qualitative job overload |
1,617 |
0.741 |
66.3 |
0.716*** |
| 3. Physical demands |
– |
NC |
– |
0.699*** |
| 4. Interpersonal conflict |
1,610 |
0.690 |
61.8 |
0.563*** |
| 5. Poor physical environment |
– |
NC |
– |
0.637*** |
| 6. Emotional demands |
1,624 |
0.860 |
78.2 |
0.628*** |
| 7. Role conflict |
1,623 |
0.791 |
70.6 |
0.633*** |
| 8. Work-self balance (negative) |
1,624 |
0.885 |
89.7 |
0.616*** |
| Job resources: task-level |
|
|
|
|
| 9. Job control |
1,618 |
0.717 |
63.9 |
0.653*** |
| 10. Suitable jobs |
– |
NC |
– |
0.659*** |
| 11. Skill utilization |
– |
NC |
– |
0.428*** |
| 12. Meaningfulness of work |
1,624 |
0.813 |
74.0 |
0.720*** |
| 13. Role clarity |
1,626 |
0.646 |
59.4 |
0.426*** |
| 14. Career opportunity |
1,618 |
0.848 |
76.8 |
0.691*** |
| 15. Novelty |
1,621 |
0.781 |
69.5 |
0.575*** |
| 16. Predictability |
1,625 |
0.691 |
62.0 |
0.424*** |
| Job resources: workgroup-level |
|
|
|
|
| 17. Supervisor support |
1,612 |
0.808 |
72.3 |
0.611*** |
| 18. Coworker support |
1,615 |
0.781 |
69.6 |
0.541*** |
| 19. [Support from family and friends] |
1,619 |
0.832 |
74.9 |
0.599*** |
| 20. Monetary/status reward |
1,622 |
0.728 |
78.8 |
0.633*** |
| 21. Esteem reward |
1,618 |
0.706 |
77.4 |
0.613*** |
| 22. Job security |
1,620 |
0.639 |
58.1 |
0.620*** |
| 23. Leadership |
1,607 |
0.787 |
70.6 |
0.654*** |
| 24. Interactional justice |
1,616 |
0.905 |
84.3 |
0.566*** |
| 25. Workplace where people compliment each other |
1,624 |
0.905 |
84.2 |
0.595*** |
| 26. Workplace where mistakes are acceptable |
1,619 |
0.774 |
81.6 |
0.588*** |
| 27. Collective efficacy |
1,616 |
0.913 |
85.2 |
0.524*** |
| Job resources: organizational-level |
|
|
|
|
| 28. Trust with management |
1,618 |
0.851 |
77.2 |
0.693*** |
| 29. Preparedness for change |
1,615 |
0.771 |
68.7 |
0.555*** |
| 30. Procedural justice |
1,611 |
0.792 |
70.7 |
0.584*** |
| 31. Respect for individuals |
1,609 |
0.845 |
76.4 |
0.616*** |
| 32. Fair personnel evaluation |
1,606 |
0.859 |
78.2 |
0.626*** |
| 33. Diversity |
1,611 |
0.685 |
61.5 |
0.654*** |
| 34. Career development |
1,609 |
0.889 |
69.6 |
0.733*** |
| 35. Work-self balance (positive) |
1,623 |
0.796 |
83.1 |
0.625*** |
| Outcomes |
|
|
|
|
| 36. Vigor |
1,616 |
0.899 |
83.3 |
0.614*** |
| 37. Anger-irritability |
1,618 |
0.910 |
84.7 |
0.547*** |
| 38. Fatigue |
1,624 |
0.891 |
82.2 |
0.541*** |
| 39. Anxiety |
1,623 |
0.773 |
69.1 |
0.603*** |
| 40. Depression |
1,618 |
0.885 |
63.9 |
0.630*** |
| Psychological stress reaction (total) |
1,590 |
0.929 |
46.4 |
0.692*** |
| 41. Physical stress reaction |
1,610 |
0.839 |
39.4 |
0.689*** |
| 42. Job satisfaction |
– |
NC |
– |
0.642*** |
| 43. [Satisfaction with family life] |
– |
NC |
– |
0.580*** |
| 44. Workplace harassment |
1,624 |
0.707 |
78.7 |
0.478*** |
| 45. Workplace social capital |
1,626 |
0.852 |
77.2 |
0.620*** |
| 46. Work engagement |
1,622 |
0.752 |
80.2 |
0.664*** |
| 47. Performance of a duty |
1,617 |
0.781 |
70.2 |
0.480*** |
| 48. Realization of creativity |
1,620 |
0.869 |
79.3 |
0.603*** |
| 49. Active learning |
1,620 |
0.839 |
75.7 |
0.547*** |
*** p<0.001. NC: Not calculated because of one-item scale. † [ ]
indicates non-work environment or outcome.
For most scales, the variance explained by the first factor in the principal component
analysis exceeded 50% (Table 4). The variance
explained was lower (30–50%) for psychological stress reaction and physical stress
reaction scales of the current BJSQ.
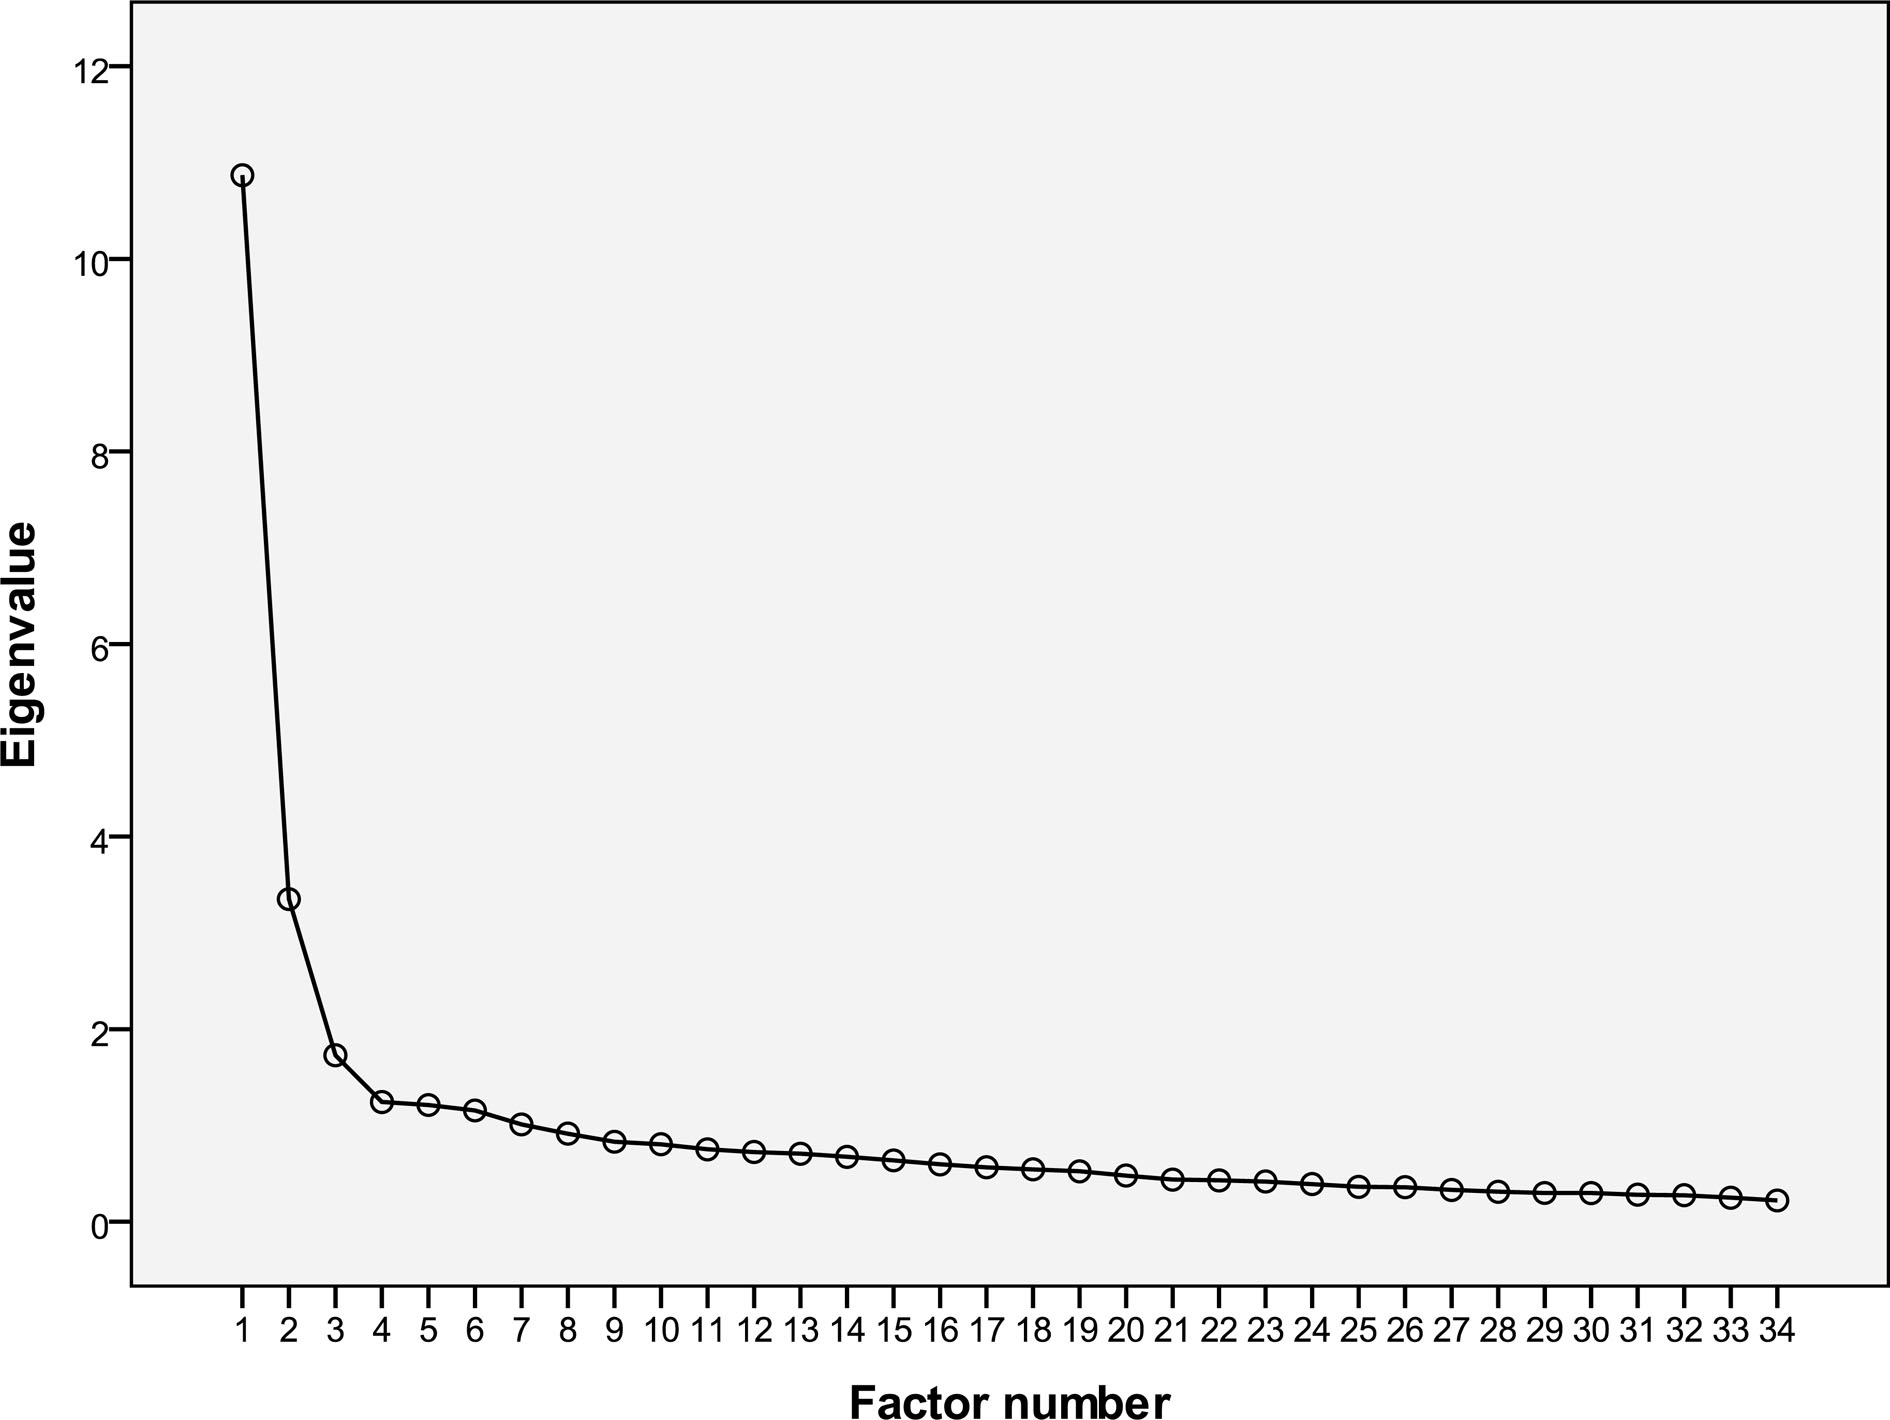
Scale factor analysis
Figure 1 shows the scree plot for the
exploratory factor analysis of 34 scales of the current BJSQ and New BJSQ, which measure
psychosocial work environment. According to the scree test criterion, three-factor
structure was thought to be meaningful because the break between the steep slope and
leveling off was between factor number three and four.
When we assumed the three-factor structure, most organizational-level job resources
scales showed high loadings on Factor 1 (>0.70) (Table 5). Most scales from workgroup-level job resources also showed moderate
factor loadings (>0.50) on this factor. Factor 1 could be interpreted as workgroup- and
organizational-level job resources. Most job demands scales showed higher factor loading
on Factor 2, possibly representing a job demands dimension. Three out of eight scales of
task-level job resources showed high loadings on Factor 3. Skill utilization and role
clarity did not load on any factor (<0.50) while highest factor loadings were shown in
Factor 3. Therefore, Factor 3 could be interpreted as task-level job resources. The
inter-factor correlation between Factor 1 and 2 was 0.20; between Factor 1 and 3 was 0.56;
and between Factor 2 and 3 was 0.09, respectively.
Table 5.
Exploratory factor analysis of 34 BJSQ and New BJSQ psychosocial work
environment scales †
| Scales |
Factor 1
(Workgroup- and organizational-level
job
resources) |
Factor 2
(Job demands) |
Factor 3
(Task-level job resources) |
| Job demands |
|
|
|
| 1. Quantitative job overload |
0.067 |
0.712 |
–0.080 |
| 2. Qualitative job overload |
–0.064 |
0.686 |
–0.274 |
| 3. Physical demands |
0.089 |
0.318 |
–0.032 |
| 4. Interpersonal conflict |
0.494 |
0.501 |
0.452 |
| 5. Poor physical environment |
0.363 |
0.250 |
0.291 |
| 6. Emotional demands |
0.255 |
0.673 |
0.247 |
| 7. Role conflict |
0.414 |
0.654 |
0.330 |
| 8. Work-self balance (negative) |
0.222 |
0.589 |
0.208 |
| Job resources: task-level |
|
|
|
| 9. Job control |
0.383 |
0.296 |
0.371 |
| 10. Suitable jobs |
0.348 |
0.184 |
0.634 |
| 11. Skill utilization |
0.232 |
–0.078 |
0.451 |
| 12. Meaningfulness of work |
0.483 |
–0.102 |
0.808 |
| 13. Role clarity |
0.407 |
0.156 |
0.422 |
| 14. Career opportunity |
0.579 |
–0.093 |
0.674 |
| 15. Novelty |
–0.172 |
0.431 |
–0.121 |
| 16. Predictability |
0.292 |
0.111 |
0.288 |
| Job resources: workgroup-level |
|
|
|
| 17. Supervisor support |
0.608 |
0.183 |
0.492 |
| 18. Coworker support |
0.410 |
0.156 |
0.432 |
| 20. Monetary/status reward |
0.588 |
0.252 |
0.379 |
| 21. Esteem reward |
0.654 |
0.244 |
0.506 |
| 22. Job security |
0.482 |
0.199 |
0.343 |
| 23. Leadership |
0.754 |
0.005 |
0.426 |
| 24. Interactional justice |
0.747 |
0.210 |
0.424 |
| 25. Workplace where people compliment each other |
0.727 |
0.166 |
0.420 |
| 26. Workplace where mistakes are acceptable |
0.692 |
0.056 |
0.490 |
| 27. Collective efficacy |
0.546 |
0.117 |
0.455 |
| Job resources: organizational-level |
|
|
|
| 28. Trust with management |
0.712 |
0.221 |
0.382 |
| 29. Preparedness for change |
0.763 |
0.154 |
0.367 |
| 30. Procedural justice |
0.714 |
0.140 |
0.304 |
| 31. Respect for individuals |
0.760 |
0.141 |
0.476 |
| 32. Fair personnel evaluation |
0.765 |
0.116 |
0.320 |
| 33. Diversity |
0.603 |
0.174 |
0.372 |
| 34. Career development |
0.792 |
0.027 |
0.435 |
| 35. Work-self balance (positive) |
0.528 |
0.141 |
0.521 |
† Data from 1,442 respondents who completed 34 scales from a national representative
survey of employees of Japan in 2010/2011. “19. Support from family and friends” scale
was excluded from the analysis because of non-work environment. Principal factor
method was used to extract factors with scree test criterion, and a rotated factor
structure with Oblimin method is shown. Factor loadings over 0.50 are underlined.
In the confirmatory factor analysis, assuming that there were four factors (i.e., job
demands and task-, workgroup-, and organizational-level job resources), fit indices were
0.79, 0.76, 0.78, and 0.08 for GFI, AGFI, CFI, and RMSEA, respectively. Factor loading for
each scale was all significant (p<0.001) (Table 6). When we conducted the same analysis assuming that
there were three factors, based on the result of the exploratory factor analysis, these
indices were 0.77, 0.74, 0.75, and 0.09, respectively. An additional analysis to compare
the four-factor structure and the three-factor structure based on the result of the
exploratory factor analysis indicated that the expected cross-validation index (ECVI) was
3.94 for the former model and 4.41 for the latter model, showing the former model had
better fit.
Table 6.
Confirmatory factor analysis of 34 BJSQ and New BJSQ psychosocial work
environment scales: factor loading for each scale in the four-factor structure (i.e.,
job demands and task-, workgroup-, and organizational-level job resources) †
| Scales |
Job demands |
Task-level
job resources |
Workgroup-level
job resources |
Organizational-level
job resources |
| 1. Quantitative job overload |
0.600*** |
|
|
|
| 2. Qualitative job overload |
0.481*** |
|
|
|
| 3. Physical demands |
0.318*** |
|
|
|
| 4. Interpersonal conflict |
0.627*** |
|
|
|
| 5. Poor physical environment |
0.364*** |
|
|
|
| 6. Emotional demands |
0.706*** |
|
|
|
| 7. Role conflict |
0.750*** |
|
|
|
| 8. Work-self balance (negative) |
0.599*** |
|
|
|
| 9. Job control |
|
0.411*** |
|
|
| 10. Suitable jobs |
|
0.580*** |
|
|
| 11. Skill utilization |
|
0.438*** |
|
|
| 12. Meaningfulness of work |
|
0.758*** |
|
|
| 13. Role clarity |
|
0.463*** |
|
|
| 14. Career opportunity |
|
0.772*** |
|
|
| 15. Novelty |
|
–0.238*** |
|
|
| 16. Predictability |
|
0.340*** |
|
|
| 17. Supervisor support |
|
|
0.689*** |
|
| 18. Coworker support |
|
|
0.459*** |
|
| 20. Monetary/status reward |
|
|
0.582*** |
|
| 21. Esteem reward |
|
|
0.693*** |
|
| 22. Job security |
|
|
0.477*** |
|
| 23. Leadership |
|
|
0.778*** |
|
| 24. Interactional justice |
|
|
0.804*** |
|
| 25. Workplace where people compliment each other |
|
|
0.787*** |
|
| 26. Workplace where mistakes are acceptable |
|
|
0.707*** |
|
| 27. Collective efficacy |
|
|
0.564*** |
|
| 28. Trust with management |
|
|
|
0.733*** |
| 29. Preparedness for change |
|
|
|
0.773*** |
| 30. Procedural justice |
|
|
|
0.751*** |
| 31. Respect for individuals |
|
|
|
0.794*** |
| 32. Fair personnel evaluation |
|
|
|
0.792*** |
| 33. Diversity |
|
|
|
0.613*** |
| 34. Career development |
|
|
|
0.812*** |
| 35. Work-self balance (positive) |
|
|
|
0.543*** |
***p<0.001. † Data from 1,442 respondents who completed 34 scales
from a national representative survey of employees of Japan in 2010/2011. “19. Support
from family and friends” scale was excluded from the analysis because of non-work
environment. Maximum likelihood method was used to estimate factor loadings. A blank
indicates that there was no path from a factor to a job demands/resources scale (i.e.,
zero factor loading) as hypothetically defined in the model38).
Polychoric correlation coefficients between psychosocial work environment and outcomes
were calculated using the data from 1,398 respondents who completed all scales (Table 7). In general, job demands scales
correlated strongly with psychological and physical stress reactions but modestly with
work engagement and workplace social capital. Job resources scales correlated with
psychological and physical stress reactions to a similar extent. However, these scales,
particularly workgroup- and organizational-level job resources, correlated with work
engagement and workplace social capital more strongly than did job demands. These findings
are consistent with the theoretical framework of the JD-R model37) in which job demands predict negative emotional
reactions (such as burnout) while job resources predict both negative and positive
emotional reactions (such as work engagement).
Table 7.
Polychoric correlation coefficients between psychosocial work environment (job
demands and job resources) and outcomes measured by using the BJSQ/New BJSQ scales: a
national representative sample of employees of Japan in 2010/2011 †
| Scales ‡ |
Psychological
stress reactions |
Physical stress
reactions |
Work
engagement |
Workplace
social capital |
Workplace
harassment |
| Job demands |
|
|
|
|
|
| 1. Quantitative job overload |
0.361** |
0.251** |
–0.050 |
0.072** |
0.207** |
| 2. Qualitative job overload |
0.240** |
0.174** |
–0.241** |
–0.056* |
0.147** |
| 3. Physical demands |
0.142** |
0.103** |
–0.110** |
0.022 |
0.126** |
| 4. Interpersonal conflict |
0.494** |
0.282** |
0.305** |
0.570** |
0.531** |
| 5. Poor physical environment |
0.268** |
0.179** |
0.259** |
0.337** |
0.240** |
| 6. Emotional demands |
0.583** |
0.384** |
0.172** |
0.251** |
0.419** |
| 7. Role conflict |
0.505** |
0.319** |
0.236** |
0.410** |
0.431** |
| 8. Work-self balance (negative) |
0.499** |
0.317** |
0.160** |
0.220** |
0.275** |
| Job resources: task-level |
|
|
|
|
|
| 9. Job control |
0.329** |
0.190** |
0.290** |
0.241** |
0.219** |
| 10. Suitable jobs |
0.411** |
0.171** |
0.610** |
0.361** |
0.254** |
| 11. Skill utilization |
0.142** |
0.092** |
0.326** |
0.193** |
0.157** |
| 12. Meaningfulness of work |
0.331** |
0.142** |
0.738** |
0.455** |
0.183** |
| 13. Role clarity |
0.245** |
0.103** |
0.328** |
0.394** |
0.153** |
| 14. Career opportunity |
0.300** |
0.150** |
0.578** |
0.425** |
0.162** |
| 15. Novelty |
–0.141** |
–0.096** |
0.151** |
0.017 |
–0.098** |
| 16. Predictability |
0.208** |
0.124** |
0.229** |
0.220** |
0.091** |
| Job resources: workgroup-level |
|
|
|
|
|
| 17. Supervisor support |
0.360** |
0.209** |
0.395** |
0.409** |
0.314** |
| 18. Coworker support |
0.305** |
0.180** |
0.321** |
0.459** |
0.264** |
| 19. [Support from family and friends] |
0.196** |
0.105** |
0.175** |
0.210** |
0.164** |
| 20. Monetary/status reward |
0.337** |
0.241** |
0.331** |
0.427** |
0.223** |
| 21. Esteem reward |
0.390** |
0.237** |
0.438** |
0.511** |
0.341** |
| 22. Job security |
0.361** |
0.248** |
0.306** |
0.332** |
0.326** |
| 23. Leadership |
0.299** |
0.170** |
0.429** |
0.461** |
0.184** |
| 24. Interactional justice |
0.376** |
0.211** |
0.420** |
0.503** |
0.362** |
| 25. Workplace where people compliment each other |
0.342** |
0.189** |
0.434** |
0.454** |
0.302** |
| 26. Workplace where mistakes are acceptable |
0.322** |
0.177** |
0.480** |
0.458** |
0.240** |
| 27. Collective efficacy |
0.320** |
0.165** |
0.482** |
0.518** |
0.188** |
| Job resources: organizational-level |
|
|
|
|
|
| 28. Trust with management |
0.366** |
0.200** |
0.421** |
0.547** |
0.329** |
| 29. Preparedness for change |
0.341** |
0.159** |
0.393** |
0.501** |
0.247** |
| 30. Procedural justice |
0.303** |
0.209** |
0.354** |
0.477** |
0.245** |
| 31. Respect for individuals |
0.373** |
0.246** |
0.514** |
0.510** |
0.235** |
| 32. Fair personnel evaluation |
0.307** |
0.193** |
0.396** |
0.505** |
0.205** |
| 33. Diversity |
0.285** |
0.156** |
0.342** |
0.447** |
0.222** |
| 34. Career development |
0.302** |
0.181** |
0.477** |
0.545** |
0.211** |
| 35. Work-self balance (positive) |
0.435** |
0.244** |
0.662** |
0.417** |
0.190** |
* p<0.05, ** p<0.01. No asterisk means
p>0.05. † Based on data from 1,398 respondents who completed all
the scales. Note that all scale scores were converted so that higher scores indicate a
better status. See text for more detail. ‡ [ ] indicates non-work environment.
Discussion
In the present study, we developed the New BJSQ, which can assess an extensive set of job
demands, job resources, and outcomes, by adding items/scales to the current version of the
BJSQ. Most scales of the New BJSQ as well as the current BJSQ showed acceptable levels of
internal consistency and test-retest reliability over one year. Principal component analyses
of scale items showed that the first factor explained 50% or more of variance for most
scales, suggesting factor-based validity of these scales. Exploratory factor analysis of the
current BJSQ/New BJSQ scales of psychosocial work environment indicated that the
three-factor structure (i.e., job demands, task-level job resources, and combined factor for
workgroup- and organizational-level job resources) is meaningful while confirmatory factor
analysis showed better mode fit for the firstly assumed four-factor structure rather than
the three-factor structure based on the result of the exploratory factor analysis. A
correlation analysis showed that job demands and job resources were associated with mental
and physical health while job resources were also associated with positive outcomes, such as
work engagement and workplace social capital, as predicted by the JD-R model37). These findings provided evidence that the
New BJSQ scales are reliable and valid and fit expectations from the JD-R model.
As introduced earlier, the principal aim of the New BJSQ is to assess psychosocial
workplace environments and their employee (i.e., health-related) and organizational (i.e.,
business-related) outcomes in an extensive way. By using the national average scores as well
as information about their distributions by gender, occupation, employment type, and
industry, as norms, the New BJSQ scales can be used to assess psychosocial work environment
and related outcomes to prevent stress at work and promote positive mental health at work.
Newly added scales can be used to assess psychological work environment with a broader range
of theoretical models of job stress, such as ERI and organizational justice, and a boarder
range of outcomes, such as work engagement, perceived workplace social capital, and
workplace harassment. The New BJSQ followed the tradition of the current BJSQ, assessing
psychosocial work environment and outcomes simultaneously, which is also used in the
PRIMA-EF approach25). An additional unique
feature of the New BJSQ is that it includes a scale of perceived workplace social capital as
an organizational outcome summarizing influence of psychosocial job resources. This approach
may have some merits. While outcomes are a primary indicator of the need for an
intervention, measuring psychosocial work environment could provide information on
components of work environment, which should be a target of the intervention. The
information provided by this approach on the association between psychosocial work
environment and outcomes, which may vary depending on workplace, occupation, and industry,
could be also useful for planning an intervention. Furthermore, outcomes assessed by the New
BJSQ are supposed to predict further distal employee outcomes, such as satisfaction and
well-being, and organizational outcomes, such as productivity and innovation, which need to
be addressed in the future research.
The present study has some limitations that should be considered. First, the response rate
in the present study was only 47.7% and employees engaged in large-sized enterprises (number
of employees≥1,000) seemed overrepresented (Table
2). In addition, out of these respondents (n=1,633), only 479
participated in the follow-up survey. Although we calculated national average of each scale
of the current BJSQ and New BJSQ using these 1,633 respondents, it should be noted that the
national average scores of the present study (Table
3) is only preliminary and may be affected by a selection bias to some extent.
Further research using larger sample with higher response rate should be conducted to
calculate more precise national average scores. Second, we exhaustively reviewed the
relevant literature to find recent theories on job stress and their measures. Accordingly,
we selected new scales/items according to the questionnaires and/or published job stress and
related variables used in foreign studies, which may provide a piece of content validity of
the New BJSQ. However, a more detailed content validity could not be examined. Similarly,
the present study provided a partial support for construct validity of the New BJSQ by
calculating a proportion of variance explained by the first factor and conducting factor
analyses and correlation analyses between psychosocial work environment and outcomes.
However, convergent and discriminant validities using other reliable and valid measurements
(e.g., Job Content Questionnaire [JCQ]39),
General Health Questionnaire [GHQ]40),
Center for Epidemiologic Studies Depression [CES-D] Scale41), World Health Organization Health and Work Performance
Questionnaire [WHO-HPQ]42), etc.) could
not be examined. Thus, more detailed content and construct validities should be examined in
a future study. Third, a few scales of the New BJSQ showed only modest internal consistency
and test-retest reliability, particularly for role clarity scale. Further review of these
items is needed to achieve higher measurement accuracy. Fourth, since the confirmatory
factor analysis did not reach the recommended acceptable level for model fit (i.e., GFI,
AGFI, and CFI>0.90 and RMSEA<0.05)43), further study on factor structure of the New BJSQ is needed.
Finally, as mentioned earlier, the standard version of the New BJSQ has 141 items in total
when combined with the current 57-item BJSQ, which may be acceptable in practice due to
large number of items. However, a recommended set of scales and a short version were also
developed. A future study should examine the reliability and validity of these versions.
Although the New BJSQ remains a matter of further revisions, it can assess a broader set of
psychosocial factors at work compared to the current BJSQ.
Acknowledgements
The present study was supported by a Health Labour Sciences Research Grant 2009–2011 “Study
on the dissemination of primary prevention of mental health problems among workers”
(H21-rodo-ippan-001) from the Ministry of Health Labour and Welfare, Japan. The preparation
of the manuscript was partially supported by a Health Labour Sciences Research Grant 2013
“Study on risk assessment methods in promoting mental health measures in the workplace”
(H25-rodo-ippan-009) from the Ministry of Health Labour and Welfare, Japan.
References
- 1) Ministry of Health Labour
and Welfare, Japan (2013) Survey on State of Employees’ Health 2012, Ministry
of Health, Labour and Welfare, Japan, Tokyo. (in Japanese).
- 2) Kawakami
N (2002)
[Improvement of work environment]. Sangyo
Eiseigaku Zasshi 44,
95–9 (in
Japanese).
- 3) Semmer
NK (2006)
Job stress interventions and the organization of work.
Scand J Work Environ Health 32,
515–27.
- 4) Shimomitsu
T, Haratani
T, Nakamura
K, Kawakami
N, Hayashi
T, Hiro
H, Arai
M, Miyazaki
S, Furuki
K, Ohya
Y, Odagiri
Y (2000) Final
development of the Brief Job Stress Questionnaire mainly used for assessment of the
individuals. In: The Ministry of Labor sponsored grant for the prevention of work-related
illness, FY 1999 report, Kato M (Ed.), 126–64, Tokyo Medical University, Tokyo. (in
Japanese).
- 5) Kawakami
N (2000) Final
development of the Job Stress Assessment Diagram and investigation of its usefulness in
practice. In: The Ministry of Labor sponsored grant for the prevention of work-related
illness, FY 1999 report, Kato M (Ed.), 12–26, Tokyo Medical University, Tokyo. (in
Japanese).
- 6) Kobayashi
Y, Kaneyoshi
A, Yokota
A, Kawakami
N (2008)
Effects of a worker participatory program for improving work environments
on job stressors and mental health among workers: a controlled trial.
J Occup Health 50,
455–70.
- 7) Umanodan
R, Kobayashi
Y, Nakamura
M,
Kitaoka-Higashiguchi
K, Kawakami
N, Shimazu
A (2009)
Effects of a worksite stress management training program with six
short-hour sessions: a controlled trial among Japanese employees.
J Occup Health 51,
294–302.
- 8) Karasek
RA (1979)
Job demands, job decision latitude and mental strain: implications for
job redesign. Adm Sci Q 24,
285–308.
- 9) Siegrist
J (1996)
Adverse health effects of high-effort/low-reward
conditions. J Occup Health Psychol 1,
27–41.
- 10) Tsutsumi
A, Kawakami
N (2004)
A review of empirical studies on the model of effort-reward imbalance at
work: reducing occupational stress by implementing a new theory.
Soc Sci Med 59, 2335–59.
- 11) van
Vegchel
N, de Jonge
J, Bosma
H, Schaufeli
W (2005)
Reviewing the effort-reward imbalance model: drawing up the balance of 45
empirical studies. Soc Sci Med 60,
1117–31.
- 12) Kivimäki
M, Virtanen
M, Elovainio
M, Kouvonen
A, Väänänen
A, Vahtera
J (2006)
Work stress in the etiology of coronary heart disease—a
meta-analysis. Scand J Work Environ
Health 32, 431–42.
- 13) Siegrist
J (2010)
Effort-reward imbalance at work and cardiovascular
diseases. Int J Occup Med Environ
Health 23, 279–85.
- 14) Greenberg
J (1987)
A taxonomy of organizational justice theories.
Acad Manage Rev 12,
9–22.
- 15) Kawachi
I (1999)
Social capital and community effects on population and individual
health. Ann N Y Acad Sci 896,
120–30.
- 16) Fujishiro
K, Heaney
CA (2009)
Justice at work, job stress, and employee health.
Health Educ Behav 36,
487–504.
- 17) Murayama
H, Fujiwara
Y, Kawachi
I (2012)
Social capital and health: a review of prospective multilevel
studies. J Epidemiol 22,
179–87.
- 18) Ndjaboué
R, Brisson
C, Vézina
M (2012)
Organisational justice and mental health: a systematic review of
prospective studies. Occup Environ
Med 69, 694–700.
- 19) Shimazu
A, Bakker
AB, Demerouti
E, Peeters
MC (2010)
Work-family conflict in Japan: how job and home demands affect
psychological distress. Ind Health 48,
766–74.
- 20) Shimazu
A, Demerouti
E, Bakker
AB, Shimada
K, Kawakami
N (2011)
Workaholism and well-being among Japanese dual-earner couples: a
spillover-crossover perspective. Soc Sci
Med 73, 399–409.
- 21) Shimada
K, Shimazu
A, Bakker
AB, Demerouti
E, Kawakami
N (2010)
Work-family spillover among Japanese dual-earner couples: a large
community-based study. J Occup
Health 52, 335–43.
- 22) Schaufeli
WB, Salanova
M,
González-Romá
V, Bakker
AB (2002)
The measurement of engagement and burnout: a confirmative analytic
approach. J Happiness Stud 3,
71–92.
- 23) Leymann
H (1996)
The content and development of mobbing at work.
Eur J Work Organ Psychol 5,
165–84.
- 24) Einarsen
S, Hoel
H, Zapf
D, Cooper
CL (2003) The
concept of bullying at work: the European tradition. In: Bullying and emotional abuse in
the workplace: international perspectives in research and practice, Einarsen S, Hoel H,
Zapf D, Cooper CL (Eds.), 3–30, Taylor & Francis, London.
- 25) Leka
S, Cox
T, Zwetsloot
G (2008) The
European Framework for Psychosocial Risk Management (PRIMA-EF). In: The European Framework
for Psychosocial Risk Management: PRIMA-EF, Leka S and Cox T (Eds.), 1–16, I-WHO
Publications, Nottingham.
- 26) Cousins
R, Mackay
CJ, Clarke
SD, Kelly
C, Kelly
PJ, McCaig
RH (2004)
‘Management Standards’ and work-related stress in the UK: practical
development. Work Stress 18,
113–36.
- 27) Burton
J (2010) WHO
Healthy Workplace Framework and Model: Background and Supporting Literature and Practices,
World Health Organization, Geneva.
- 28) Hurrell
JJ, McLaney
MA (1988)
Exposure to job stress—a new psychometric instrument.
Scand J Work Environ Health 14 Suppl 1, 27–8.
- 29) Johnson
JV, Hall
EM (1988)
Job strain, work place social support, and cardiovascular disease: a
cross-sectional study of a random sample of the Swedish working
population. Am J Public Health 78,
1336–42.
- 30) Hochschild
AR (1979)
Emotion work, feeling rules, and social structure.
Am J Sociol 85, 551–75.
- 31) Thibaut
J, Walker
L (1975)
Procedural justice: a psychological analysis, Erlbaum, Hillsdale.
- 32) Leventhal
GS (1980) What
should be done with equity theory? New approaches to the study of fairness in social
relationships. In: Social exchange: advances in theory and research, Gergen K, Greenberg
M, Willis R (Eds.), 27–55, Plenum Press, New York.
- 33) Bies
RJ, Moag
JS (1986)
Interactional justice: communication criteria of fairness. In: Research on negotiation in
organizations, vol. 1, Lewicki RJ, Sheppard BH, Bazerman MH (Eds.), 43–55, JAI Press,
Greenwich.
- 34) Pejtersen
JH,
Kristensen
TS, Borg
V, Bjørner
JB (2010)
The second version of the Copenhagen Psychosocial
Questionnaire. Scand J Public
Health 38 Suppl,
8–24.
- 35) Chang
SJ, Koh
SB, Kang
D, Kim
SA, Kang
MG, Lee
CG, Chung
JJ, Cho
JJ, Son
M, Chae
CH, Kim
JW, Kim
JI, Kim
HS, Roh
SC, Park
JB, Woo
JM, Kim
SY, Kim
JY, Ha
M, Park
J, Rhee
KY, Kim
HR, Kong
JO, Kim
IA, Kim
JS, Park
JH, Huyun
SJ, Son
DK (2005)
Developing an occupational stress scale for Korean
employees. Korean J Occup Environ
Med 17, 297–317.
- 36) Bandura
A (1997) Self
efficacy: the exercise of control, W.H. Freeman and Company, New York.
- 37) Schaufeli
WB, Bakker
AB (2004)
Job demands, job resources, and their relationship with burnout and
engagement: a multi-sample study. J Organ
Behav 25, 293–315.
- 38) Everitt
B, Hothorn
T (2011)
Confirmatory factor analysis and structural equation models. In: An introduction to
applied multivariate analysis with R, Everitt B and Hothorn T (Eds.), 201–24, Springer,
New York.
- 39) Karasek
R (1985) Job
Content Questionnaire and User’s Guide, University of Massachusetts at Lowell,
Lowell.
- 40) Goldberg
D (1972) The
detection of psychiatric illness by questionnaire: a technique for the identification and
assessment of non-psychotic psychiatric illness, Oxford University Press,
London.
- 41) Radloff
LS (1977)
The CES-D scale: a self-report depression scale for research in the
general population. Appl Psychol
Meas 1, 385–401.
- 42) Kessler
RC, Barber
C, Beck
A, Berglund
P, Cleary
PD, McKenas
D, Pronk
N, Simon
G, Stang
P, Üstün
TB, Wang
P (2003)
The World Health Organization Health and Work Performance Questionnaire
(HPQ). J Occup Environ Med 45,
156–74.
- 43) Hu
L, Bentler
PM (1999)
Cutoff criteria for fit indexes in covariance structure analysis:
conventional criteria versus new alternatives. Struct Equ
Modeling 6, 1–55.
