Planning Strategies and Design Concepts
Purchasing behavior and awareness during COVID-19-related panic buying
A case study conducted in three Japanese cities
2022 Volume 10 Issue 2 Pages 1-18
Details
2022 Volume 10 Issue 2 Pages 1-18
The COVID-19 pandemic is now a global crisis, and fear of the pandemic or anxieties about unstable social condition (e.g., urban lockdown or rumors spreading) caused panic buying in many countries. To prevent future cases, it is of urgent need to understand what happens during panic buying to provide useful insight for policy makers. This study aims to examine the individual purchasing behaviors in the panic buying of toilet paper in Japanese cities in early 2020. We focused on the three cities that have different urban characteristics and pandemic progress conditions. Using online questionnaires, two main aspects were analyzed: 1) the spatio-temporal concentration of shopping behaviors and 2) customers’ inconvenience while shopping. The major results are as follows. Information spreading immediately caused consumers’ temporal concentration. Especially, people who felt the situation was serious tended to shop, and rushing to the same stores caused the spatial concentration. Although regional disparities were also seen, according to their urban characteristics and pandemic progress condition, most customers' store choices during panic buying seem to be an extension of their normal purchasing behaviors. However, their spatio-temporal concentration inconvenienced many people since they failed to obtain enough toilet paper in the stores or felt irritated by other consumers. Our results suggest the importance of preventing customers’ concentration to reduce inconvenience and suggest countermeasures by controlling demand in the current condition of regional space by guiding people’s behavior.
“Panic buying” (PB) involves people rushing to stores to buy large quantities of daily necessities, exhausting stock in many stores. Most PB is triggered by trivial news or rumors during unstable social conditions. People tend to trust these types of information due to the anxiety that they might not obtain the items they need (e.g., Smelser, 1963; Hirose, 1985; Li et al., 2020). Moreover, people are often agitated by the purchasing behaviors of others under such conditions (Smith et al., 2007) Previously, PB has often occurred, even in developed countries in the oil shocks or during natural disasters (e.g., Hagiwara, 2011; Sekiya, 2018; Fung & Yuen Loke, 2010).
In 2020’s COVID-19 pandemic, PB occurred in many countries. Widespread anxiety about the extraordinary situation, suddenly increasing demand for masks and disinfectant, and stockpiling of daily necessities for urban lockdowns, and information about other case of PB spreading via media reports or SNS made people rush to stores (e.g., Makwana & Dave, 2020; Kostev & Lauterbach, 2020; Arafat et al., 2020; Naeem, 2021).
In late February 2020 in Japan, rumors that stocks of toilet paper (TP) would run out caused PB of TP in many cities. At that time, COVID-19 cases and fear about the pandemic began to increase. Meanwhile, information about PB cases in other countries was spreading. Ahead of time, stocks of masks were depleted in all over Japan. This heightened the credibility of the rumors and deepened anxiety, leading consumers to PB. Customers employed different purchasing behaviors than usual. Modified behaviors often caused unexpected problems between customers, or between stores and customers (The Asahi Shimbun Company, 2020a).
Literature review and the study aimPeople’s behaviors in PB are more particular, therefore it is difficult to explain with ordinal theory (Billore & Anisimova, 2021). To prevent such problems in the future, advancing PB behavior studies is required. We assumed that focusing on the following viewpoints is important; 1) the mechanism underlying PB, 2) characteristics of consumers’ purchasing behaviors, and 3) the features of problems caused as a result of PB.
Several Japanese studies have focused on PB cases from before the pandemic. Hagiwara (2011) analyzed the anxiety that caused stockpiling behavior after the 2011 earthquake. Additionally, Sekiya (2018) revealed that less than half of people changed their purchasing behavior during a PB, implying that stock disruptions were caused by customers’ spatio-temporal concentrations at the same stores. However, except for a brief survey (Research and Innovation Co., Ltd, 2020), few studies have focused on COVID-19 pandemic related PB in Japan. Therefore, examining Japanese experiences has great value.
Contrastingly, many studies have been conducted in other countries. Yau et al. (2020), Rajkumar (2021) and Loxton et al. (2020) discuss the mechanism of COVID-19 related PB on the basis of general discourse and the findings of existing PB studies. Moreover, several studies evaluated people’s psychological state during the pandemic (e.g., Lehberger, Kleih, & Sparke, 2021; Islam et al., 2021; Ahmad & Murad, 2020). The common findings of these studies are that anxieties about the infection or urban lockdown, and fear of future unavailability of items lead to PB. Social big data (e.g., tweets, Google search data) also played an important role by demonstrating changes in consumers’ psychology (Prentice, Chen, & Stantic, 2020; Leung et al., 2021; Keane & Neal, 2021). Further, time series data helped with estimating the effect of governments’ national or domestic policies. However, these studies did not sufficiently focus on consumers behavior and underlying problems of PB.
Against this, several studies focused on actual consumers’ behavior under during the COVID-19 related PBs. For example, Kostev and Lauterbach (2020) and Hall et al. (2020) analyzed consumer spending pattern. They revealed that characteristic spending pattern changes were found in conjunction with the pandemic situations and the policies introduced by local governments. People’s behavior varied according to characteristics where they lived (e.g., distribution of stores and population, or major transportation modes), or the degree of the pandemic progress (Islam et al., 2021). When trying to understand what happened a given region and consider appropriate countermeasures, the variety of individual attributes and behaviors should not be ignored.
Yoshizaki et al. (2020) and Wang and Na (2020) identified the characteristics of customers who hoarded, and provided useful suggestions for local governments to make regional countermeasures. However, the studies above did not focus on consumers’ spatio-temporal behaviors, such as store choice and decision making process, or analyze the problems caused as a result of PB. People-oriented planning has become increasingly important for ensuring quality of life, and space-time behavior researched will help inform urban planning (Zhang et al., 2016).
Therefore, for a more detailed understanding of the mechanism of PB, this research focused on three Japanese cities that experienced PB of TP during the COVID-19 pandemic. We aimed to examine individual spatial purchasing behavior, changes (e.g., store choice, travel range, or transportation mode) from usual decision-making patterns, and difficulties people faced. Specifically, two research questions (RQs) were posed: 1) how and why did a spatio-temporal concentration of customers occur? And, 2) as a result, who was inconvenienced while buying TP?
Answering these RQs will be useful for taking regional countermeasures to control supply and demand in the current conditions of regional urban space. In particular, the results will be useful for guiding or regulating people’s behaviors to prevent problems related to PB. Because this research compared several cities, we can examine regional differences according to urban characteristics or the degree of pandemic progress.
Our study also contributes useful knowledge that can be applied internationally. Sharing Japanese experiences of COVID-19 related PB will help promote the understanding of the phenomenon in other developed countries. By comparing several areas, we can distinguish generally applicable and region-specific results, which can be applied directly to cities that have similar structures or population characteristics.
An online questionnaire survey was conducted in April 2020. We collected 600 answers from three regions with different features and different levels of COVID-19 infections in late February 2020 (Figure 1). All respondents were members of consumer panels of a research company (My Voice Communications, Inc.; http://www.myvoice.co.jp/). All respondents were aged 18-79 years; 150 were from Morioka in Iwate Prefecture (the prefectural capitals of a provincial city that had no inflections). Kanazawa in Ishikawa Prefecture (the prefectural capitals of a provincial city where the epidemic had begun to spread) had 200 respondents, and 250 respondents came from Toshima in Tokyo (a metropolitan city where the epidemic was well-established).
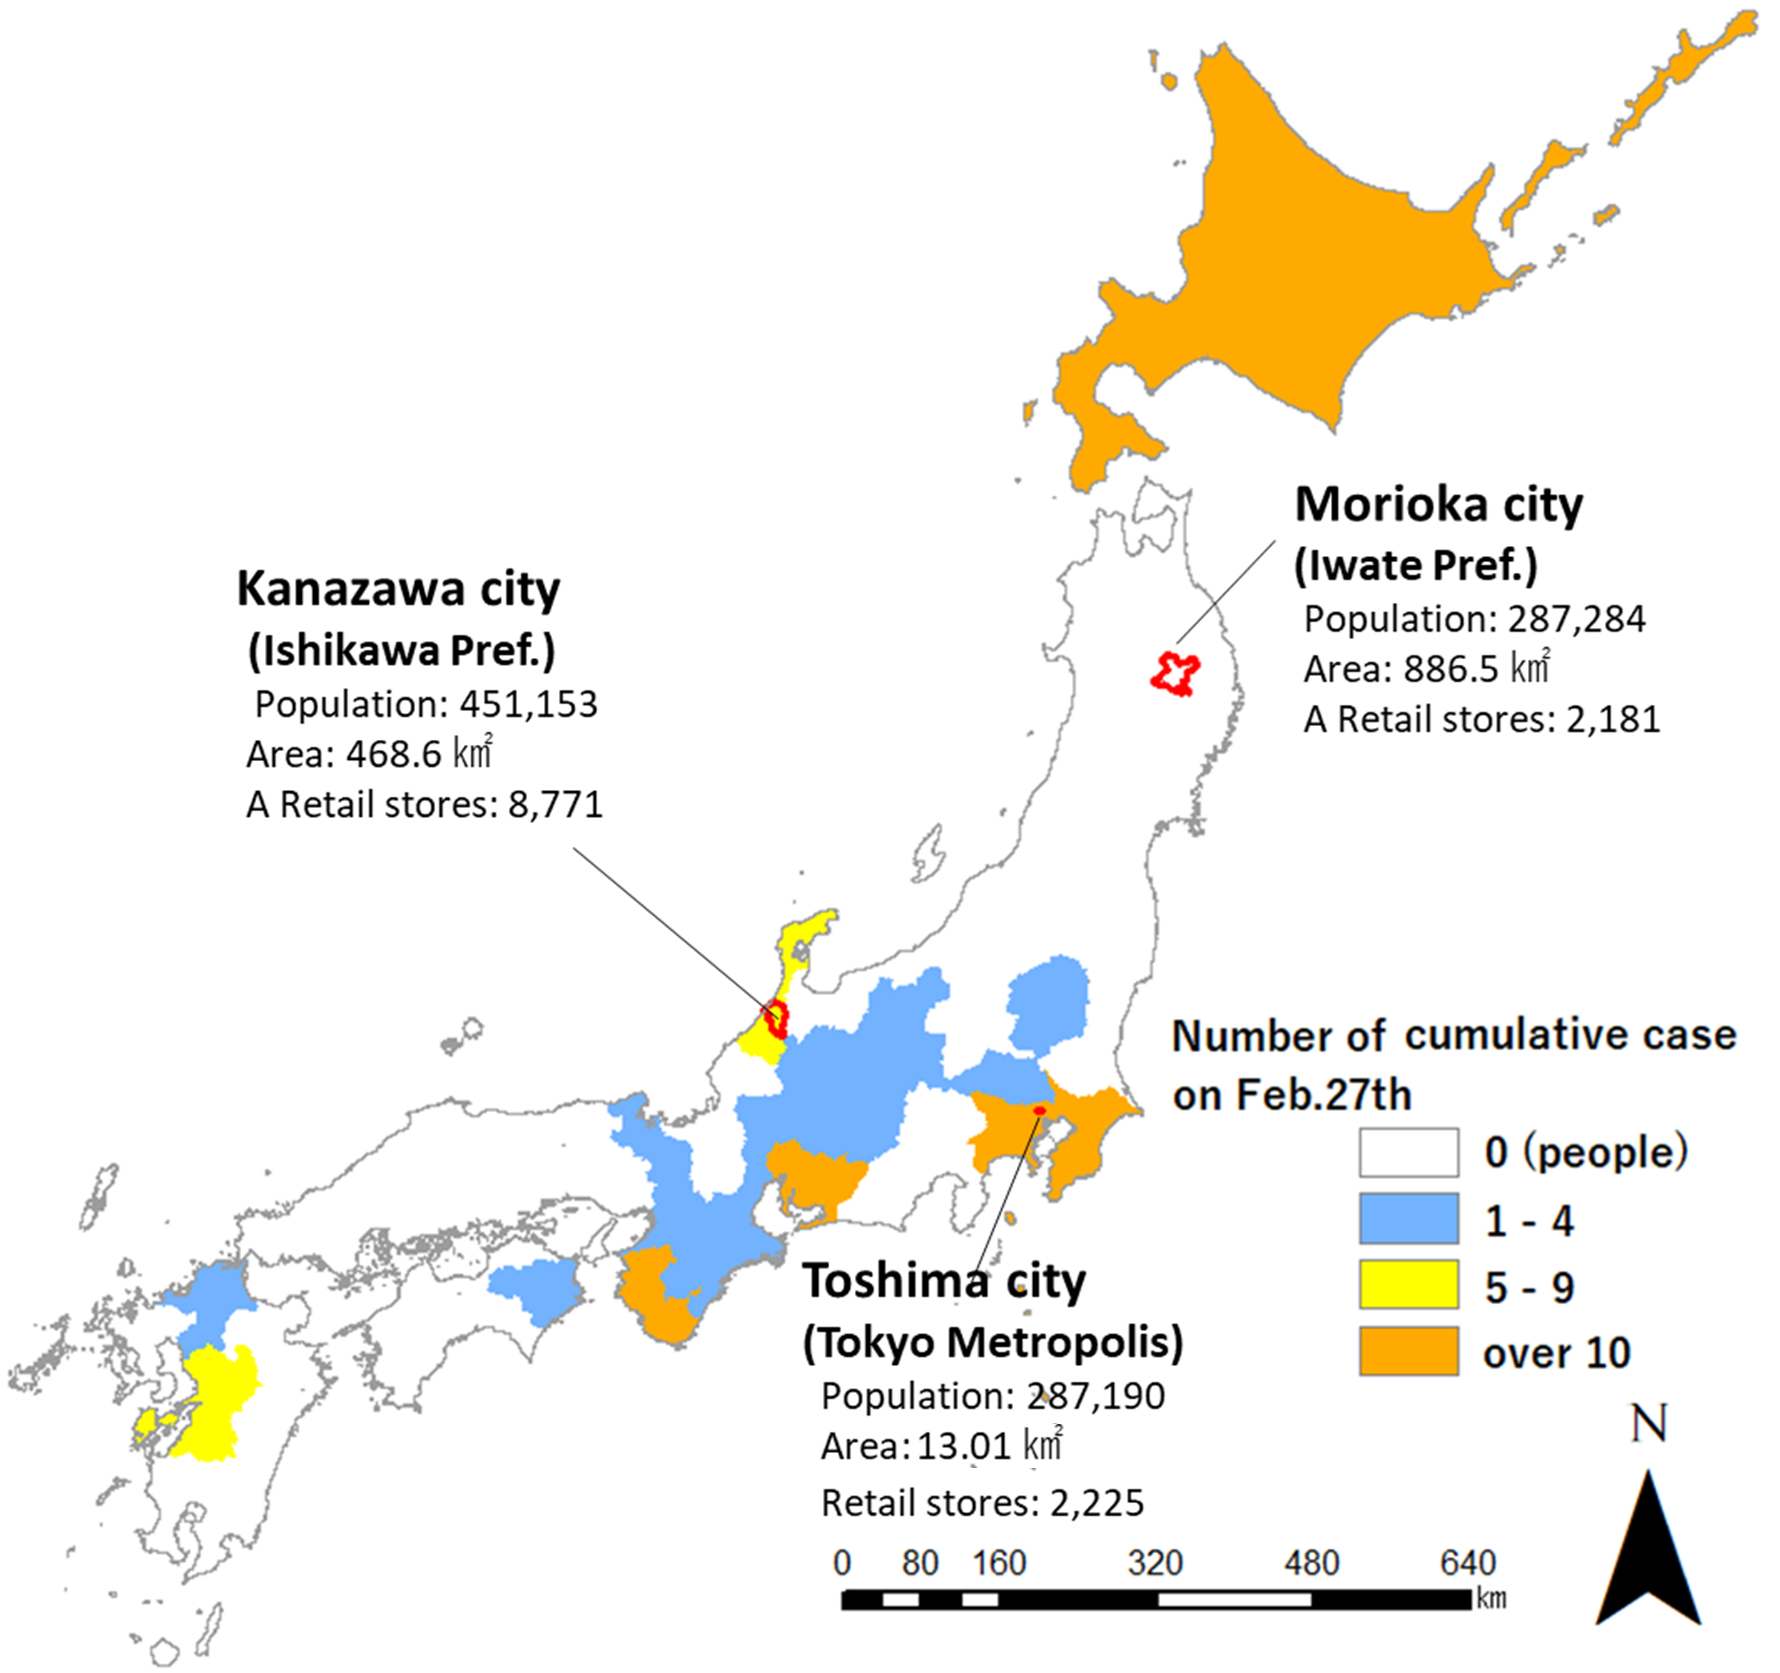
Figure 1. Study area features, included cumulative COVID-19 cases on Feb. 27th, 2020
(Source: The Asahi Shimbun Company (2020b))
Before the survey, we briefly explained the current PB situation to respondents. In the survey, respondents were firstly asked when and how they heard about the situation. Then we asked 1) whether respondents had gone shopping for TP and 2) why they had done so. Respondents who had been shopping for TP were asked about first purchasing behavior (i.e., moment of shopping, number of stores visited on the day, and information about the stores, transportation mode, and required time) after hearing about the PB. They were also asked about their shopping experience (i.e., whether they could obtain enough TP, the degree of inconvenience on a 4-point Likert scale, and details of encountered inconvenience (free response). The word “inconvenience” here is interpreted as a comprehensive evaluation of consumers’ difficulties or dissatisfactions, such as the inaccessibility of each store, visiting multiple stores, and the difficulty of purchasing TP in the store. Additionally, for comparison, all respondents were asked for information about the store that they would usually use.
MethodologyOur analysis was mainly conducted from three viewpoints1) individuals’ shopping-related decision-making, 2) spatio-temporal concentration of purchasing behaviors, and 3) outcomes of TP shopping.
We first examined the reasons for individuals’ decisions to go shopping. A binary logistic regression analysis was conducted to grasp the characteristics of people who shopped for TP. The explanation of both the dependent and independent variables is shown in Table 1 (column “T2”). The results help us to understand what caused PB.
The second analysis can be sub-divided into two sections. First, we examined the temporal concentration, analyzing the relationship between the moments of recognizing the PB situation and actually going shopping, to identify when the concentration happened. Then we analyzed the spatial concentration of customers in specific stores. Compared with usual conditions, we focused on individual’s store choice from two viewpoints: store type and travel distance.
The third set of analyses targeted prevention of PB inconvenience. We first used binary logistic regression analysis to examine respondents who could not get enough TP. Failing to obtain TP was a major factor of inconvenience. The explanation of both the dependent and independent variables are shown in Table 1 (column “T7”). Moreover, considering that even people who could get enough TP may have faced difficulties or inconvenience while shopping, we conducted another binary logistic regression analysis to examine respondents who had faced any inconvenience. The explanation of both the dependent and independent variables are shown in Table 1 (column “T8”). Then, by combining with respondents’ free descriptions of inconvenience, we clarified its factors.
Table 1. Variables for a series of regression analyses
|
Variable name ※D :Dummy variable |
Explanation
|
T2 | T7 | T8 |
|---|---|---|---|---|
| Go shopping_D | If a respondent shopped: 1 , otherwise: 0 | Y | ||
| Fail to obtain TP_D | If a respondent failed to obtain enough TP: 1 , otherwise: 0 | Y | ||
| Inconvenient_D | If a respondent felt inconvenienced while shopping: 1, otherwise: 0 | Y | ||
| Toshima_D, Kanazawa_D | If a respondent lives in each area: 1, otherwise: 0 (M:Living in Morioka) | 〇 | 〇 | 〇 |
| Male_D |
If a respondent’s gender is male: 1 otherwise: 0 |
〇 | 〇 | 〇 |
|
Age 65_74_D Age over 75_D |
If a respondent belongs each age group: 1, otherwise: 0 | 〇 | 〇 | 〇 |
| Family_65over_D | If a respondent has a family member(s) who belong(s) to each group: 1, otherwise: 0 | 〇 | 〇 | 〇 |
| Fam._under J.H.S. student _D | ||||
| Fam._under H.S. student_D | ||||
| Aware _before Feb.26_D | If a respondent was aware the situation of PB during each period: 1, otherwise: 0 (M:Not aware) | 〇 | 〇 | 〇 |
| Aware_Feb.27_Mar.1_D | ||||
| Aware_ Mar.2_8_D | ||||
| Aware_ after Mar.9_D | ||||
| Style_after depletion of stockpile_D |
If a respondent’s shopping style applies to each conditions: 1, otherwise: 0 (M: Purchase at any time to need) |
〇 | - | - |
| Style_just before stockpile depletion_D | ||||
| Style_always keep sufficient stockpile_ D | ||||
| Stock condition | 1: sufficient, 2: somewhat sufficient, 3: neither, 4: somewhat insufficient, 5: insufficient | 〇 | - | - |
|
U_supermarket/co-op_D, U_dragstore_D, U_convenience storeD, U_Internet, delivery shopping D |
If a respondent usually used each store: 1, otherwise: 0 (M:Other) | 〇 | - | - |
|
Supermarket/coop_D, Dragstore_D, Convenience storeD, Internet, delivery shopping D |
If a respondent used each store during PB situation: 1, otherwise: 0 (M:Other) | - | 〇 | 〇 |
|
U_walk_D, U_bike_D, U_car_D, U_pub.transport._D |
If a respondent usually used each transportation mode to the store: 1, otherwise: 0 (M:Others) | 〇 | - | - |
|
Walk_D, Bike_D, Car_D, Pub.transport._D |
If a respondent used each transportation mode to the store during PB situation: 1, otherwise: 0 (M:Other) | - | 〇 | 〇 |
| U_ Time to store | Time to the store that a respondent uses in each situation | 〇 | - | - |
| D_Time to store | - | 〇 | 〇 | |
| The number of visited stores | The number of stores visited in a day by each respondent | - | 〇 | 〇 |
| Purchase Restriction D | If TP purchase restrictions were in place in the store: 1, otherwise: 0 | - | 〇 | 〇 |
| Inadequate acquisition of TP_D | If sufficient TP was acquired: 1, otherwise: 0 | - | - | 〇 |
| AM 9-12 D | If a respondents went to the store during the relevant time: 1, otherwise: 0 (M: Went to the store during PM 12~15) | - | 〇 | 〇 |
| PM15-18 D | ||||
| 18~21 D | ||||
| ~AM9・PM21~ D |
Note: “Y” indicates dependent variables and “〇” indicates independent variable in the each analysis. If each variable has these signs at each column, it is used in the analysis whose result is shown at the corresponding table (T2: Table 2, T7: Table 7, T8: Table 8).
In Toshima, Kanazawa, and Morioka, 40.4%, 33.0%, and 30.0% of respondents bought TP, respectively. Therefore, over half did not go shopping even during PB. However, PB and various related problems still occurred. To prevent their recurrence, it is important to understand the characteristics of people who shopped during this PB. Table 2 shows results of a binary logistic regression analysis to examine this.
Table 2. Characteristics of people who shopped for TP
| Variable Name | B | S.E. | Wald | p | Exp(B) | 95% CI (Exp(B)) | |
|---|---|---|---|---|---|---|---|
| Min. | Max. | ||||||
| Toshima_D | 1.000 | .290 | 11.852 | .001*** | 2.717 | 1.538 | 4.800 |
| Aware _before Feb.26_D | .740 | .257 | 8.261 | .004*** | 2.095 | 1.265 | 3.469 |
| Stock condition | .865 | .095 | 82.529 | .000*** | 2.375 | 1.970 | 2.862 |
| U_drugstore_D | .440 | .195 | 5.078 | .024 ** | 1.553 | 1.304 | 4.068 |
| U_car_D | .834 | .290 | 8.260 | .004 *** | 2.303 | 1.059 | 2.278 |
| Constant | -3.588 | .362 | 98.420 | .000*** | .028 | ||
Note: Nagelkerke
Respondents who lacked sufficient TP at home tended to have shopped, suggesting the importance of maintaining daily stockpiles as recommended by governments (Ministry of Economy & TradeandIndustry, 2020). By region, more respondents in Toshima went shopping. Although the moderator variable is the Morioka_D, Toshima’s population density is much higher than other two regions. This high population density made many people anxious that stocks of TP would be temporarily unavailable, and fear of infection led to greater PB than in other two regions.
Usual purchasing behavior also affected decision-making. People who typically bought TP in drugstores tended to go shopping. During COVID-19-driven PB, other medical supplies were also in high demand. We assume that people worried about TP being bought alongside those products. In addition, respondents who usually drive to buy TP also tended to go shopping. Generally, not many stores were located within walking distance for these respondents; they worried they would have to go to a more distant store to get TP if there was none at their usual stores. Furthermore, respondents who obtained information earlier also tended to go shopping. They assumed it was a good moment to buy TP as many people were still unaware of the PB.
Figure 2 shows the reasons for respondents’ decision-making. As for those who shopped, there were three predominant reasons: “few stocks at home,” “usual purchase timing,” and “preparing for long-term difficulties in obtaining.” During PB, both those who were preparing for long-term stock disruptions and those who needed TP for their daily life cycle went shopping. Although they would eventually shop even if PB was not occurring, the news about PB also caused their shopping. On the other hand, the main reason people did not go shopping was that “they have sufficient stock of TP.”
Moreover, regional decision-making differences existed. In Toshima, fewer respondents shopped because it was their usual time of purchase; more people worried about long-term difficulties in obtaining TP. Moreover, in Toshima, fewer respondents answered “I think that I shouldn't believe the rumors.” We assume that Toshima’s much higher population density meant that more people were concerned about future difficulties in obtaining TP, thinking the rumors were true, and actually went to buy TP.

Figure 2. Reasons for decision-making about shopping
These results suggest two important findings to prevent future PB. Firstly, rumors related to PB were received differently by region. In densely populated regions, people tend to view rumors as more credible. Secondly, encouraging people to stock up on daily necessities on daily basis can help prevent PB.
Temporal concentrationTable 3 shows the ratio of respondents who shopped during different periods. The period was expressed as the duration between recognizing by PB and the decision to go shopping.
Assuming that people’s recognition began at the beginning of the main week of PB, 98 respondents shopped within that week. That number represents nearly half of respondents who shopped during PB. At least 61.2% of them shopped immediately after the information was spread by rumors or via SNS and media (i.e., on Feb. 27th and 28th), suggesting the news accelerated purchasing behavior. This temporal concentration of customers can be regarded as one of the main factors of PB.
Table 3. Relationship between the moment of recognition and actual shopping date (%)
| N |
Same day |
Weekday of the same week | Weekend of the same week | Weekday of the next week | Weekend of the next week | Later | |
|---|---|---|---|---|---|---|---|
| Before Feb.26 | 47 | 21.3 | 17.0 | 8.5 | 21.3 | 2.1 | 29.8 |
| Feb.27-28 | 80 | 23.8 | 20.0 | 26.3 | 7.5 | 1.3 | 21.3 |
|
Feb. 29- Mar. 1 |
42 | 4.8 | 9.5 | 33.3 | 9.5 | 9.5 | 33.3 |
| Mar. 2-6 | 21 | 4.8 | 9.5 | 9.5 | 33.3 | 9.5 | 33.3 |
| Mar. 7-8 | 3 | 0.0 | 33.3 | 0.0 | 0.0 | 0.0 | 66.7 |
| After Mar. 9 | 10 | 20.0 | 0.0 | 10.0 | 10.0 | 10.0 | 50.0 |
| Unaware | 9 | 33.3 | 11.1 | 22.2 | 0.0 | 0.0 | 11.1 |
Note: Bold type indicates the time period that respondents are assumed to shop between Feb. 24th to Mar. 1st.
Spatial concentrationRespondents’ spatial concentration was analyzed from the view of store choice. If numerous customers go to the same store at the same time, especially in densely populated regions, the concentration can easily exceed stores' capacity. Table 4 shows the transportation modes that respondents used to go shopping, comparing their usual and PB situations.
Table 4. Transportation modes in the usual and the PB situations (%)
| Region | Situation | N | Walk | Bicycle | Car | Bus | Train | Others |
|---|---|---|---|---|---|---|---|---|
| Toshima | Usual | 250 | 64.8 | 19.2 | 3.6 | 0.0 | 2.8 | 9.6 |
| Panic buying | 101 | 78.2 | 11.9 | 4.0 | 1.0 | 4.0 | 1.0 | |
| Kanazawa | Usual | 200 | 15.5 | 7.0 | 72.5 | 0.5 | 0.0 | 4.5 |
| Panic buying | 69 | 8.7 | 1.4 | 85.5 | 0.0 | 2.9 | 1.4 | |
| Morioka | Usual | 150 | 16.0 | 9.3 | 68.0 | 0.0 | 0.0 | 6.7 |
| Panic buying | 49 | 13.3 | 13.3 | 73.3 | 0.0 | 0.0 | 0.0 |
The overall tendencies were similar regardless of situation. Cars were the main transportation mode in Morioka and Kanazawa. During PB, car-use ratio increased slightly, possibly because cars make it easier to visit multiple stores on one trip. Contrastingly, in Toshima, many respondents shopped on foot: most Tokyo residents seldom use cars due to dense public transport networks, and many stores are located within walking distance.
Several respondents changed transportation mode (Toshima: 15.9%, Kanazawa: 12.1%,Morioka: 8.9%). Especially in Toshima, respondents who usually use internet shopping or delivery services (included in “others”) tended to go to stores. This might be because they failed to obtain TP in their usual ways. This change would become a factor of the spatial concentration.
The chosen store type was also examined. Figure 3 compares respondents’ store choices between the usual and the PB situations.
In usual life, respondents mainly bought TP in local supermarkets/co-ops and drugstores. Drugstores were chosen more than supermarkets, because sales floor space for TP is usually larger. Although the usual and PB situations appear to be similar at first glance, when focusing in detail, several large differences emerge. First, in all regions, approximately 40% (Toshima: 46.2%, Kanazawa: 42.9%,Morioka: 37.8%) of respondents chose a different store than normal.

Figure 3. Chosen store types: usual and PB situations
In addition, as Table 5 shows, a considerable number of respondents changed store type. Among those who changed store type, many changed between drugstores and supermarkets (i.e., people who usually used drugstores went to supermarkets and vice versa; Toshima: 76.9%, Kanazawa: 64.3%, Morioka: 37.5%, respectively). These types of stores are both smaller than, department stores/shopping centers or discount shops, and can be located around residential areas.
Table 5. Change of store choice in each area
(a)Toshima (b) Kanazawa
| SM | Drug | Net/ deliver | Others | SM | Drug | Net/ deliver | Others | ||||
|---|---|---|---|---|---|---|---|---|---|---|---|
| SM | 22 | 7 | 0 | 3 | SM | 7 | 4 | 0 | 0 | ||
| Drug | 13 | 33 | 0 | 1 | Drug | 5 | 36 | 0 | 3 | ||
| Net/ deliver | 3 | 1 | 0 | 4 | Net/ deliver | 0 | 0 | 0 | 0 | ||
| Other | 1 | 1 | 0 | 1 | Other | 1 | 1 | 0 | 6 | ||
(c) Morioka
| SM | Drug | Net/ deliver | Others | |
|---|---|---|---|---|
| SM | 12 | 0 | 0 | 3 |
| Drug | 3 | 15 | 0 | 1 |
| Net/ deliver | 0 | 1 | 0 | 0 |
| Other | 0 | 0 | 0 | 6 |
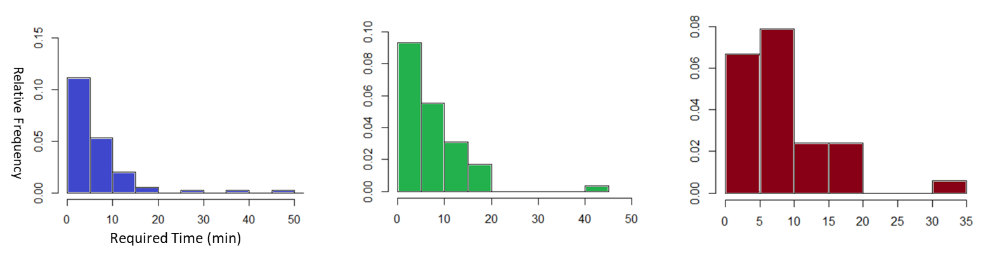
Travel time may indicate why these changes in store choice occurred. Figure 4 shows the distribution of travel time to stores by most major transportation modes (i.e., Toshima: Walking; Kanazawa/Morioka: car).
In all regions, more than 70% chose stores within 10 minutes’ travel. Less than 5% chose stores requiring more than 20 minutes’ travel. Moreover, the distribution pattern of travel time during PB is not significantly different from usual conditions in all regions (examined by Kolmogorov-Smirnov’s test), indicating that people’s first store choice range did not drastically change even during PB.
However, respondents in Morioka had a slightly different tendency: the ratio of store choice change between drugstores and supermarkets is lower. The histogram shape also shows more difference between PB and usual conditions.

(a) normal
(b) panic buying
Figure 4. Travel time to stores
To explain this, we first classified respondents into five groups according to their travel time in usual conditions, and calculated the rate of respondents who shopped during PB (Table 6).
Table 6. The ratio of respondents who shopped in each classified group by travel time (%)
| Region | 0-5 min | 5-10 min | 10-15min | 15-20min | Over 20 min |
|---|---|---|---|---|---|
| Toshima | 38.8 | 37.5 | 43.6 | 57.1 | 43.8 |
| Kanazawa | 28.9 | 38.1 | 32.6 | 33.3 | 26.3 |
| Morioka | 16.0 | 24.4 | 28.9 | 42.9 | 57.1 |
In Morioka, the ratio of respondents who shopped during PB is lower among those who usually use stores within 10 minutes’ travel. Contrastingly, this ratio is higher among those who usually use more distant stores. This is because Morioka had no cumulative cases at the time and people’s pandemic fears were weaker. Therefore, in Morioka, those who usually travelled further to stores were more worried about the inconvenience of TP stock disruptions and went shopping, unlike other regions where many people were worried and shopped regardless of store distance. In Morioka, respondents who usually travel more than 20 minutes to stores tend to live in the Morioka’s suburbs. Many of them used home centers or discount stores, which tend to be located in suburb. Therefore, in Morioka, these store types were used more even in during PB, as shown Figure 3.
To sum up these results, we can conclude that customers' store choice changes were an extension of their normal behaviors.
Inconvenience during the panic buyingAs shown previously, spatio-temporal concentration of customers at stores occurred during the PB. This led to TP stock disruptions and caused many customers’ inconvenience.
The ratio of respondents who were inconvenienced differed among regions (Toshima: 83.2%,Kanazawa: 60.6%, Morioka: 48.9%). In Toshima, more customers’ rushing to stores caused TP stock disruption, which inconvenienced many people. Contrastingly, in Morioka, where there were no infections and lower concentrations in stores, less people felt inconvenience.
We assumed that failure to obtain TP was one of the main factors of inconveniences. Among those who failed to obtain TP, 88.2% felt inconvenienced(p<0.001, χ-squared test), significantly exceeding the ratio who felt inconvenienced even though they obtained sufficient TP (55.9%). Table 7 shows the characteristics of the respondents who failed to obtain enough TP.
Table 7. Respondents who failed to obtain enough TP
| Variable Name | B | S.E. | Wald | p | Exp(B) | 95% CI (Exp(B)) | |
|---|---|---|---|---|---|---|---|
| Min. | Max. | ||||||
| Aware _before Feb.26_D | -.840 | .396 | 4.494 | .034** | .432 | 0.199 | 0.939 |
| The number of visited stores | .733 | .159 | 21.296 | .000*** | 2.081 | 1.524 | 2.840 |
| Purchase Restriction D | -.636 | .313 | 4.129 | .042 ** | 0.530 | 0.287 | 0.978 |
| Constant | -1.175 | .373 | 9.895 | .002*** | .309 | ||
Note: Nagelkerke
One important factor was the moment of noticing PB. People who noticed PB before the news could obtain enough TP. However, after the information spread, it become difficult to get enough TP. The more stores respondents visited, the more difficulties they had obtaining TP. If customers obtained enough TP at the first store, they finished shopping. This result suggests that a considerable number of customers visited several stores until they could find (enough) TP, or gave up shopping. Moreover, respondents who used stores that established purchasing restrictions also tended to fail to get enough TP.
Who was inconvenienced while looking for TP? Are there additional reasons for inconvenience other than failing to obtain TP? The Table 8 shows the characteristics of respondents who felt inconvenienced.
Table 8. Respondents who felt inconvenienced
| Variable Name | B | S.E. | Wald | p | Exp(B) | 95%CI(Exp(B)) | |
|---|---|---|---|---|---|---|---|
| Min. | Max. | ||||||
| Inadequate acquisition of TP_D | 1.256 | .416 | 9.113 | .003*** | 3.513 | 1.554 | 7.942 |
| Toshima_D | 1.344 | .364 | 13.655 | .000*** | 3.835 | 1.880 | 7.822 |
| Male_D | -.677 | .355 | 3.638 | .056* | 0.508 | 0.253 | 1.019 |
| The number of visited stores | .789 | .251 | 9.888 | .002 *** | 2.201 | 1.346 | 3.599 |
| Constant | -1.018 | .423 | 5.802 | .016** | .361 | ||
Note: Nagelkerke
Firstly, failure to obtain sufficient TP tended to cause the inconvenience. Relatedly, respondents in Toshima tended to feel greater inconvenience. For these variables, the odds ratio (the value of Exp[B]) is much higher. Therefore, customers who met these conditions tended to feel inconvenienced.
In addition, women tended to feel more inconvenienced; in general, the average consumption of TP between the gender. In general, women consume four times as much TP as men (Japanese Toilet Association, 2020). Additionally, more women (44.8%) were unable to obtain sufficient TP than men (35.5%), even though the ratio of men and women among the three regions does not differ greatly. Once more, customers who visited multiple stores are more likely to feel inconvenienced.
Additionally, contents of respondents’ free descriptions of inconvenience could be roughly classified into several types. First, the inconvenience of not being able to get enough TP, represented by comments such as “TP is out of stock and I could not obtain it” or “I’m worried how long this situation will continue.” Second, limited choices of available amounts and brands of TP also became an inconvenience factor. Third, people also felt inconvenienced by the fact that they were forced to change their usual purchasing behaviors. Finally, inconvenience was derived from other customers using the same stores during the same period. Respondents were fed up with crowded stores, or complained about people buying all the TP following media agitation. To prevent the occurrence of stressful situations in future, it would be important to take measures at the local level that mitigate customers inconvenience, based on these results.
Customer visiting multiple storesThe number of stores visited affected both whether respondents could obtain sufficient TP, and whether they felt inconvenienced. Understanding the characteristics of those who visited many stores is important for preventing an excessive concentration of customers and inconvenience. If each customer visits multiple stores in a day, each store has numerous customers.
Out findings showed that approximately 90% or more of all respondents used three or fewer stores (Toshima; 92.1%, Kanazawa; 87.9%, Morioka; 100%). Moreover, the more stores visited in a day, the more respondents felt inconvenienced (Table 9).
Fortunately, in all regions, nearly half or more finished their shopping for TP within one store. However, there were differences between Toshima and the other regions (Toshima; 48.5%, Kanazawa; 54.5%, Morioka; 71.1%). Among those who used only one store in Kanazawa and Morioka, few respondents failed to obtain enough TP. Contrastingly, in Toshima, nearly half who visited only one store failed to obtain TP. This suggests that many customers in Toshima gave up shopping after visiting the first store. This regional difference might explain Toshima’s higher ratio of inconvenience.
Table 9. Ratio of failure to obtain enough TP by number of visited stores (%)
| Region | 1 store | 2 stores | 3stores | ≧ 4 stores |
|---|---|---|---|---|
| Toshima | 48.0 | 57.9 | 100.0 | 87.5 |
| Kanazawa | 13.9 | 66.7 | 71.4 | 50.0 |
| Morioka | 15.6 | 28.6 | 100.0 |
The average number of visited stores in Toshima, Kanazawa, and Morioka were 1.9 stores, 1.8 stores, and 1.4 stores, respectively. Assuming that people who shopped were distributed uniformly in the region, when multiplying these values to the ratio of respondents who shopped in each area, it indicates approximately 75%, 60%, and 40% of households in Toshima, Kanazawa, and Morioka, respectively, went to the stores located within 20 minutes of their residence. Such large numbers of customers visiting specific types of stores on the same day caused overcrowding and various other problems.
An ordered logistic regression was conducted to analyze customers who visited several stores in a day, to help prevent such problems in future (Table 10). Respondents were classified according to whether they visited one, two, three and more stores, representing the dependent variable. Independent variables were the same as the analysis in Table 8. However, some variables (Convenience storeD, Internet, delivery shopping D, Walk_D, Pub.transport_D, Kanazawa_D, and Aware_Feb.27_Mar.1_D) were excluded to avoid multi-collinearity (i.e., The value of variance inflation factor of all explanatory variable is less than 10.0).
Table 10. Ordered logistic regression
| Variables | B | S.E. | Wald | p | 95%CI of B | |
|---|---|---|---|---|---|---|
| Min. | Max | |||||
|
Threshold 1 store | 2 store |
2.061 | .818 | 6.339 | .012** | .230 | 3.273 |
|
Threshold 2 store | ≧3 store |
3.172 | .835 | 14.434 | .000*** | 1.305 | 4.407 |
| Toshima_D | 1.258 | .791 | 13.031 | .017** | .226 | 2.289 |
| Variables | B | S.E. | Wald | p | 95%CI of B | |
| Min. | Max | |||||
| Male_D | -.080 | .292 | .075 | .784 | -.653 | 0.493 |
| Age 65_74_D | -.686 | .519 | 1.748 | .186 | -1.703 | 0.331 |
| Age over 75_D | -.586 | .736 | .633 | .426 | -2.209 | 0.857 |
| Family_65over_D | -.118 | .374 | .100 | .751 | -.851 | .614 |
|
Fam._under J.H.S. student _D |
.222 | .371 | .358 | .550 | -.506 | .950 |
|
Aware _before Feb.26_D |
-.473 | .361 | 1.717 | .190 | -1.181 | .235 |
| Aware_ Mar.2_8_D | .122 | .454 | .072 | .789 | -.769 | 1.012 |
| Aware_ after Mar.9_D | -.088 | .667 | .018 | .894 | -1.395 | 1.218 |
| AM 9-12 D | .887 | .417 | 4.525 | .033** | .070 | 1.305 |
| PM15-18 D | .583 | .445 | 1.717 | .190 | -.289 | 1.455 |
| 18~21 D | .570 | .551 | 1.068 | .301 | -.511 | 1.651 |
| ~AM9・PM21~D | 1.435 | .531 | 7.305 | .007*** | .394 | 2.475 |
| Supermarket/co-op_D | .246 | .435 | .320 | .572 | -.607 | 1.099 |
| Drugstore_D | .367 | .409 | .808 | .369 | -.434 | 1.169 |
| Bike_D | .032 | .520 | .004 | .951 | -.987 | 1.051 |
| Car_D | .942 | .539 | 3.053 | .081* | -.115 | 1.998 |
| Purchase Restriction D | -.309 | .291 | 1.130 | .288 | -.878 | 0.261 |
Note: Nagelkerke
As individual attributes, family structure, and type of store were not significantly related to the number of stores visited. Respondents who drove when shopping tended to visit more stores, because it is easier to move between stores even in lower-store-density regions. Moreover, timing of shopping also affected number of stores visited. Respondents who shopped between 09:00-12:00 or before 09:00/ after 21:00 significantly visited more stores. Here, when focusing on the respondents who shopped before 09:00 and after 21:00, 19 of 22 respondents shopped before 09:00. This implies that customers tended to visit more stores if they went out for shopping in the morning. If they could not buy sufficient amount of TP from each store due to purchase restriction or other reasons, they could take more time, and visit multiple stores to obtain sufficient quantities. Finally, respondents in Toshima, where many could not obtain TP at the first store visited, tended to visit more stores. Many thought that they had to prepare for long-term difficulties in obtaining TP, owing to fears around the looming urban lockdown, so visited more distant stores even if they could not obtain TP in the stores. We assume that people's sense of urgency pushed them to adopt such purchasing behaviors.
To prevent future PB and associated problems at the regional scale, we proposed two RQs and examined them using quantitative analyses focusing on individual purchasing behavior: RQ1) how and why did the spatio-temporal concentration of customers occur? and RQ2) as a result, who felt inconvenienced while buying TP? Answering these RQs and sharing Japanese experiences Sharing Japanese experiences of COVID-19 related PB will help promote the understanding of the phenomenon in other developed countries.
Firstly, the characteristics of customers who shopped for TP and their decision-making were analyzed. Those who shopped included: 1) people worried about stock disruptions, and 2) people who would have difficulties if they failed to obtain TP. The results indicated that having sufficient stocks is an important factor to avoid PB. People should be encouraged to maintain sufficient stocks of everyday items at all times.
Although only less than half of respondents shopped, PB occurred due to the excessive concentration of customers in specific periods and stores. The spread rumors and information made people to go shopping simultaneously.
Additionally, spatial concentration happened at the same time. One of the factors was customers’ travel range. Most customers used stores within their daily living areas. In addition, many customers chose drugstores and local supermarkets for buying TP. These store types have plenty item choice for their size, and they tend to be located in or around residential areas. Therefore, customers concentrated in them. Furthermore, a considerable number of customers used a different store type than usual. We assume they were concerned about the possibility that their usual stores might have no TP stocks. As such, during PB there are likely to be customers who lack an understanding of the usual service of the store. To reduce problems between customers, or customers and stores, it is important that stores help unfamiliar customers.
Meanwhile, we found that PB purchasing behaviors were an extension usual purchasing behaviors. This indicates that PB purchasing behaviors may be predicted from normal purchasing behaviors. Therefore, it is useful to conduct periodic, regional surveys.
As for RQ2, we analyzed people who felt inconvenienced while shopping for TP. We found that differences of required amount of TP by gender and having to visit multiple stores are important inconveniencing factors, in addition to failing to obtain sufficient TP, visiting multiple stores was an inefficient way to obtain enough TP. During PB, people should be prevented from visiting multiple stores, which inconveniences others. Moreover, irritation to other consumers in the store also causes inconvenience. Since these factors of inconvenience fundamentally seem to derive from the spatio-temporal concentration, it would mitigate people’s inconvenience would be mitigated if the concentration is resolved.
This study provides a new viewpoint to understand PB. By focusing on individual purchasing behavior, it enables us to understand the phenomenon and related problems to consider a more detailed resolution. The results suggest countermeasures for controlling supply and demand in the current condition of regional space by guiding or regulating people’s behavior. For example, our results support the importance of real-time mapping of stock items across regional stores. Moreover, in Japan, several local governments bought items from regional stores and supplied citizens gradually (e.g., Nikkei Inc, 2020). Our results also offer guidance on identifying priorities for where to begin supplying items in a given region.
This study also showed that there are regional disparities based on urban characteristics or the degree of the pandemic’s progress by examining cases in several regions. Our results can help local governments or decision-makers estimate what will happen during future PB in each region. In regions with high population density and seriousness of pandemic, such as Toshima, more people believed the rumors and visited multiple stores, but many customers failed to obtain the TP and were inconvenienced. On the other hand, in Morioka, people’s pandemic fears were weaker. Fewer people believed the rumors, and many customers maintained regular shopping routines. People who have poor accessibility to their usual stores tend to shop during PB. Therefore, the concentration of customers is not as high, and fewer people were inconvenienced during PB.
It is anticipated that we will continue to live with COVID-19 for the foreseeable future. The epidemic has begun to re-emerge globally, resulting in new PB (Reuters, 2020). We hope this study will contribute to preventing or solving PB and associated problems.
LimitationsFirstly, the number of respondents was very small compared with total population, as we prioritized rapid completion of data collection. Although our sample size passed the standard to check the overfitting of regression models (i.e., the ratio of the sample size to the number of variables in the regression models≧10, Mikolajczyk, DiSilvesto, & Zhang, 2008), samples should be 1.5~2.6 times larger based on the population of each area (Nagata, 2003). Larger samples would enable us not only ensure statistical validity but also conduct other analysis. For example, if the relationship between store features (e.g., location, size, product variety) and the number of customers visited by each individual store category were clarified, it would provide more detail for preventing customers’ spatial concentration.
Secondly, PB of other items should be analyzed. Customers’ store choices could change if different items were required; therefore, by conducting analyses for other items, we may clarify the similarities and differences.
Finally, surveys and analyses from the supply side are also necessary, to supplement our demand-side data. Supply-side analyses would deepen clarify understanding of the difficulties each store had and the appropriate services during PB are. Combining such information with our results would deepen our understanding of PB and the best measures to prevent it.
This research was funded by supported by JSPS KAKENHI, grant numbers, JP17K14785, and JP20K14901.