Abstract
Urban green spaces play a substantial role in alleviation of multiple environmental challenges caused by intensified urbanization. However, urban forests themselves are prone to degradation from unsustainable human activities. The forests of Delhi Ridge provide myriad of essential ecosystem services to the citizens of Delhi, though it is under immense anthropogenic pressure. This study is carried out for identifying the overall land use/land cover dynamics in the four different parts of Delhi Ridge in light of rampant urbanization in the area. Variations were estimated for the period of three decades (1989-2020) with the intervening gap of 5 years and Landsat data has been analyzed for this period. All the four parts of Delhi Ridge exhibit overall increase in the green cover with maximum percentage change in area in moderately dense forest class has been observed in Central Ridge (494.31%). On the contrary, there is also an increase in built-up area at the boundaries and also within the Ridge forest depicting severe human interference with maximum percentage change in built-up observed in Southern Ridge (339.28%). The present study provides baseline information on the spatio-temporal changes observed in the Delhi Ridge forest and also highlights the impact of urbanization. Such findings hold substantial implications in framing rational urban policies for ensuring long-term conservation of the fragile habitat of Delhi Ridge forest.
Introduction
Urbanization has become a global trend sustaining large human populations (Cohen, 2006). With enhanced industrialization and booming employment opportunities, urban centers have seen an unprecedented influx of populations from rural areas (Avtar, Tripathi et al., 2019). Proliferation in the urbanization phenomenon has put pressure on natural ecosystems within and periphery of the urban centers (Mundia and Murayama, 2010). Besides this, urban areas are prone to myriad of environmental problems ranging from air, water soil and noise pollution, urban heat island effect, greenhouse gas emission to land degradation, ground water depletion etc. (Livesley, McPherson et al., 2016; Uttara, Bhuvandas et al., 2012).
Planners, policymakers and conservationists across the globe stress on the need for the inclusion of urban green spaces in integrated sustainable development models and action plans (Sturiale and Scuderi, 2019; Vargas-Hernández, Pallagst et al., 2018). Urban forests play a pivotal role in sustaining biodiversity, groundwater recharge, pollution mitigation, carbon sequestration, recreational & aesthetic benefits along with providing other ecosystem services in urban landscapes (Heidt and Neef, 2008; Hirokawa, 2011). Alike the global perspectives, Indian cities are also increasingly realizing the importance of urban greens in maintaining the environmental balance (Ramaiah and Avtar, 2019). However, the growing human population and developmental activities have transgressed into these urban forests causing their degradation and fragmentation, altering the overall habitat quality and the tendency of ecosystems to produce various goods and services (Haddad, Brudvig et al., 2015; Matthews, 2014). An analytical examination of these anthropogenic drivers of change is thus crucial to find out the magnitude of degradation of natural ecosystems (Das and Das, 2019).
Forest ecosystems are quite dynamic in nature with large-scale variations in productivity and soil dynamics based on temperature, precipitation, etc. Tropical forests are a storehouse of biodiversity and provide habitat for a myriad of wildlife, however, they are negatively impacted by urbanization effects. Land use/land cover (LULC) analysis is one of the essential methods to determine and document the on-ground variations in vegetation cover and anthropogenic activities over a period of time (Smith, 2003; Thakur, Patel et al., 2020). Advancements in GIS and related technologies have proved quite effective in real-time monitoring of changes and disturbances over a large area (Rawat and Kumar, 2015).
Several studies examined the variations in land use/land cover brought by rapid urbanization (Al-Rashid, Nadeem et al., 2021; Alzamili, El-Mewafi et al., 2015; Ha, Tuohy et al., 2020; Han, H. and Lin, 2017; Mberego and Li, 2017; Yılmaz and Terzi, 2020). LULC studies are effective in providing valuable data needed for the assessment of qualitative and quantitative changes brought by human activities that have an adverse bearing on the forest ecosystems and biodiversity (Cheng, Chen et al., 2019; Kumne and Samanta, 2019; Sharma, Chaudhry et al., 2017; Srivastava, Singh et al., 2020). Hadagha, Farhi et al. (2021) investigated the impact of urbanization on palm groves and desert oasis ecosystems while Phan, Trung et al. (2021) reported a tenfold increase in urban areas across Vietnam which came at the expanse of the productive agricultural ecosystem. Some researchers have also used GIS as a tool to quantify the negative impact of urbanization on ecosystem services such as carbon sequestration (Han, Y., Kang et al., 2018), impact on land surface temperature (Hussain and Karuppannan, 2021) and habitat quality (He, Huang et al., 2017). Therefore, critical analysis of trends and status of urban ecosystems can help in shaping management framework and formulation of sustainable urban policies (Aksoy, Dabanli et al., 2022).
In India, the assessment of the impact of urbanization on land use/land cover dynamics has attracted substantial interest from researchers (Bhat, ul Shafiq et al., 2017; Pawe and Saikia, 2018; Prabu and Dar, 2018). Ahmad, Goparaju et al. (2017) carried out LULC analysis of Ranchi city, India using Markov chain predictive model which predicted that there will be 43% more urban expansion for the city in 2028 as when compared to the year 2015. Paul, Saxena et al. (2021) studied the urban expansion in peripheral regions of the Delhi region to find that an annual urban expansion rate of 38.64% has largely occurred in the scrubland of these areas. On the other hand, very few studies are available that quantify the impact of urbanization on urban green spaces (Dinda, Chatterjee et al., 2021; Rao and Puntambekar, 2014).
The capital of India- Delhi has seen a high rate of urbanization due to an increase in population pressure. The population of Delhi rose by 21.20% in between 2001 and 2011 (Economic Survey of Delhi, 2018-19). Delhi Ridge forest is an important natural ecosystem of the city. However, the forest of Delhi Ridge is under multiple pressures that include rapid urbanization, biological invasion by invasive species, conversion of forests into parks and introduction of non-native ornamental species, building of infrastructure- roads, metro rail line etc., dumping of construction waste, illegal encroachments etc. From the above perspective, it is essential to determine how the Delhi Ridge forest ecosystem is changing so that the findings can be integrated with decision-making and sustainable urban planning. The main objectives of this study are:
-
・
To analyze the spatio-temporal changes in vegetation pattern of the Delhi Ridge.
-
・
To determine drivers of change and also how expanding urbanization has impacted the region.
The present study is aimed to analyze key changes in Delhi Ridge from 1989 onwards when large-scale industrialization and infrastructure building were given administrative and policy push in the city. The supervised classification of satellite imageries is used to determine the changes in vegetation structure and also to recognize the key factors and driving forces that are causing LULC changes within and in periphery regions of Delhi Ridge forest. Moreover, the relation between classes is interpreted especially with built-up for deriving a general overview. The key findings of this study will have positive implications on the long-term management of the Delhi Ridge forests especially in minimizing the impact of urbanization through policy interventions.
Study Area
Delhi, the capital city of India, is one of the fastest growing urban conglomerations in the world with a population of nearly 20 million. The city lies in the subtropical zone with a semi-arid climate, having a short cold season and a long dry, hot season with moderately low annual rainfall (711cms) occurring predominantly in Monsoons which last from July to September.
Delhi has a rich historical legacy and has two distinct natural ecosystems- River Yamuna and Delhi Ridge. Delhi Ridge (Figure 1) is an extension of Aravalli Mountain Range- one of the ancient mountain chains of the world with an age of 1.5 billion years old. With its total length of 35 Kms, Delhi Ridge lies between 28o 12’ and 28o 53’ North and 76o 50’ and 77o 23’ East spanning from the Bhatti Mines area located in southeast Delhi to the Wazirabad area in Northeast Delhi. The geology of the region mainly comprises of quartzite stone, arkosic grit and micaceous schist (Sharma, Chaudhry et al., 2017).
Delhi Ridge was once more or less contiguous from Southeast to Northeast but because of the burgeoning population (Table 1) and enhanced urbanization, Ridge at present is divided into four distinct fragments- Northern Ridge (87 hectares), Central Ridge (864 hectares), South Central Ridge (626 hectares) and Southern Ridge (6200 hectares). Most of the Ridge falls under the category of the reserved forest, however, it is managed by multiple Government agencies including Forest Department, Delhi Development Authority (DDA), Municipal Corporation of Delhi (MCD), Army etc. The major part of Southern Ridge is protected through Asola Bhatti Wildlife Sanctuary which was carved out in the year 1986. Some parts of Southern Ridge were mined for extracting feldspar and red morrum used in building construction, however, this detrimental practice has now been stopped completely.

The main vegetation of Delhi Ridge is a tropical dry thorn forest with the predominance of Acacia sp. and other thorny species (Champion and Seth, 1968). The dominant native tree species of this area are Acacia catechu, Acacia modesta, Acacia leucophloea, Acacia senegal, Diospyros montana, Balanites aegyptiaca, Wrightia tinctoria, Butea monosperma, Prosopis cineraria, Salvadora persica and Ehretia laevis. One of the characteristic tree species of Aravalli forest -Anogeissus pendula, known to form pure patches in rocky cliffs, was once abundant throughout the Delhi Ridge but now this species is in retreat and only a few patches of Anogeissus forest can be found in the southern part of Delhi Ridge. The main shrub species present in the Ridge are Adhatoda vasica, Capparis sepiaria, Maytenus senegalensis, Carissa spinarum, Zizyphus nummularia and Grewia tenax.
Table 1.
Decadal Population growth and % growth (1981-2011)
| Year
|
Population (in millions)
|
Growth in Percentage
|
| 1981 |
6.220 |
53.00 |
| 1991 |
9.421 |
51.45 |
| 2001 |
13.851 |
47.02 |
| 2011 |
16.788 |
21.20 |
Most of the Ridge forest is an open type with a predominance of grasses and herbs during the rainy season. However, an invasive tree species called Prosopis juliflora from South America, has come to dominate the entire vegetation of Delhi Ridge. At present, all the four parts of Ridge are infested with Prosopis juliflora (Sharma and Chaudhry, 2018; Sinha, 2014). Several studies have reported that Prosopis julflora depict allelopathic effect, affecting the growth and establishment of native species in invaded areas (El-Shabasy, 2017; Mahdhi, Tounekti et al., 2018). Another tree species from South America called Leucaena leucocephala is spreading fast in parts of Delhi Ridge. A global invasive shrub – Lantana camara, has also formed dense thickets in the area. Entire Northern Ridge and parts of South-Central and Southern Ridge which fall under the jurisdiction of Delhi Development Authority are now being developed as Kamla Nehru Biodiversity Park, Aravalli Biodiversity Park, Neela Hauz Biodiversity Park Tuglakabad Biodiversity Park and Tilpath Valley Biodiversity Park (Delhi Biodiversity Foundation D.D.A., 2021). Here invasive Prosopis julflora is removed and native flora of Ridge is being re-introduced for ecological restoration of the area. Active plantation of native tree species is also undertaken by Forest Department, especially in Southern Ridge. (Delhi State Action Plan on Climate Change, 2019; Sharma and Chaudhry, 2018; The Indian Express, 2017a).
Materials and Methods
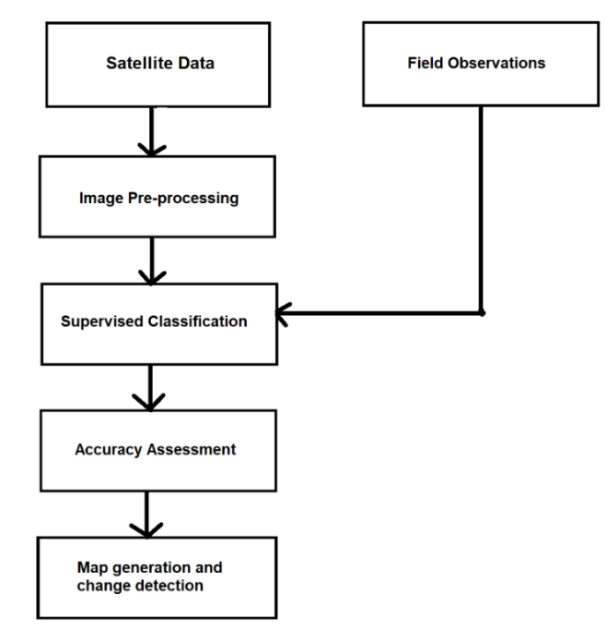
For studying the dynamics of changes in the vegetation of urban green spaces and expansion of the built-up, a study of LULC changes is required through satellite images. The methodological framework of this study encompasses two main parts. The first part monitors the forest cover area through spatiotemporal analysis using remote sensing and GIS. This involves data collection, image pre-processing, image classification, accuracy assessment followed by map generation and change detection. The second part discusses the relationship between LULC classes and drivers of changes in forest cover. The detailed overview of the research flow is represented in Figure 2.
Satellite data of Landsat MMS, Landsat TM, Landast ETM+ and Landsat OLI have been used to estimate the status of forest cover after every 5 years i.e., 1990,1995,2000,2005,2010,2015 and 2020. The main criteria behind this are to derive and analyze the changes in the vegetation pattern that may occur in an urban forest located amidst high human pressure. The spatial resolution of Landsat data is 30m*30m and has path 146/row 40. These satellite images are freely available and have been downloaded from USGS website (http://earthexplorer.usgs. gov/) for the month of October-November to determine spatiotemporal variations in forest coverage.
Topographic maps of the study area were obtained from the Geological survey of India of scale 1:50000. These maps were georeferenced to the Universal Transverse Mercator (UTM) coordinate system and digitized to create a shapefile, which was further used for sub-setting the area of interest (AOI) from the image. Some part of surrounding areas was also included in the study to determine the magnitude of changes caused by human interference. Pre‑processing of images includes creating a standard False colour composite (FCC) by over-layering the proper band combinations and image enhancement to increase the quality of images (Bera, Saha et al., 2020).
Satellite image classification is required to classify the image into several categories (Dinda, Chatterjee et al., 2021). In this study, pixel-based supervised classification was applied to classify the images into seven different land use land cover classes/land type classes namely- Moderate dense forest, open forest, scrub, build up & human settlement, water bodies and open area. A new class-mining affected area was used exclusively for LULC analysis of Southern Ridge as the area was subjected to mining. The advantage of using supervised classification with a maximum likelihood classification algorithm is that it is more accurate as it considers several training sites for each land type category (Rahman and Sumantyo, 2010). The field observations bring out important reference data for recognizing land types. The description of classes is given in Table 2. The output of this was used to generate land use land cover maps of all the four parts of Delhi Ridge and to determine the class-wise area from the images. After classifying the maps, the Raster Calculator tool was used to compute class-wise areas.
Table 2.
Description of classes used in LULC Analysis
| Class name
|
Description of class
|
| Moderately Dense Forest |
Forest with tree canopy density above 40 percent but less than 70 percent |
| Open Forest |
Forest with tree canopy density between 10 and 40 percent |
| Scrub |
Area with sparse vegetation and less than 10 percent tree canopy density |
| Built-Up and Human Settlement |
Urban Areas, Rural Areas, Farmhouses |
| Water Bodies |
Natural & Artificial ponds/lakes |
| Open Area |
Area with very low or no vegetation, rocky outcrops, barren land, abandoned land, stone processing areas etc. |
| Mining affected area |
Mining Activities, Stone Quarries |
To compute the rate of change in the forest coverage after every five years, a comparative analysis was done on the classified images that illustrate the net transformation taken place over time. The LULC maps of four ridges are shown in Figure 3 to 6. The mean overall accuracy and kappa analysis came out to be in the range of 0.84 to 0.90 respectively. The study was also supplemented with correlation analysis between the area obtained for various LULC classes to derive the positive and negative relationship between them.
Results
The variations observed in vegetation pattern are analyzed and the driving forces that result in LULC changes in Delhi Ridge forest have been identified through spatio-temporal analysis. Several changes have been observed in all the four parts of Delhi Ridge over the period of three decades (1989-2020). The spatial extent of the moderately dense forest has shown an incremental trend in all the four areas with the maximum percentage change in the area being observed in Central Ridge (494.31%). The ongoing and past plantation activities combined with protection of this region from illegal cutting through fencing, boundary walls and enhanced patrolling by various land-owning agencies namely- Forest Department, Delhi Development Authority (DDA), Municipal Corporation of Delhi (MCD), Delhi Biodiversity Foundation etc., has been instrumental in increasing the forest cover. However, the dominant tree species in all the four regions of Delhi Ridge is Prosopis juliflora which is an invasive alien species in this region and forms a majority of the vegetation cover (Sharma, Chaudhry et al., 2017; Sinha, 2014). On the flip-side, a decreasing trend was observed for open forest and scrub forest in these three decades. A similar trend is observed in the case of the built-up area indicating a steady increase in human-induced activities in and around the Delhi Ridge area.
Northern Ridge
In 1989 (Figure 3, Figure 4 and Table 3), scrub and open forest predominates the forest cover in the Northern Ridge covering 29.50% and 31.81% of the total area respectively while area under moderately dense forest was 21.72%. By 1995, there is slight decrease in scrub and open forest and moderately dense forest increased upto 25.26%. From year 2000, there is steady increase in moderately dense forest. In 2020, moderately dense forest has covered 57.35% of the total area. On the other hand, open forest and scrub has decreased from 1989 to 2020 especially scrub which has come down to occupy 5.74% in 2020. The area under open forest has also shown continuous decline with 31.81% in 1989 to 18.34% in 2020.
The area under built-up has increased steadily from 12.01% in 1989 to 16.41% in 2020. The area is crisscrossed by several roads now. Our study has also shown that there is decrease in water bodies from 0.91% to 0.48% in 2015 although it has remained steady from there till 2020. The similar trends can be observed in the case of open area.
As mentioned earlier, Northern Ridge is the smallest among all parts of Delhi Ridge and also surrounded by dense human habitation. It has been found that some parts of the area had been converted into park with walking path and other amenities for visitors in the past. However, in 2015, Northern Ridge has been designated as a Biodiversity Park and now the focus is to ecologically restore this area through native plants and also to ensure rain water harvesting and regeneration of aquifers (Delhi Biodiversity Foundation D.D.A., 2021).
Table 3.
Changes in LULC classes year wise in % for Northern Ridge
|
Year
|
| Area in %
|
| Class
|
1989
|
1995
|
2000
|
2005
|
2010
|
2015
|
2020
|
| Moderately Dense Forest |
21.727 |
25.268 |
35.247 |
40.075 |
42.543 |
52.629 |
57.350 |
| Open Forest |
31.813 |
30.579 |
27.521 |
26.824 |
26.395 |
23.176 |
18.348 |
| Scrub |
29.506 |
28.916 |
19.742 |
15.612 |
11.856 |
5.526 |
5.740 |
| Built-Up |
12.017 |
12.232 |
15.075 |
15.075 |
16.899 |
16.524 |
16.416 |
| Water Body |
0.912 |
0.912 |
0.751 |
0.805 |
0.590 |
0.483 |
0.483 |
| Open Area |
4.024 |
2.092 |
1.663 |
1.609 |
1.717 |
1.663 |
1.663 |
| Total Area (Sq. Kms.) |
1.67 |
Central Ridge
Figure 5, Figure 6 and Table 4 shows the land-use changes observed in the Central Ridge area. As observed in Northern Ridge, scrub and open forest was seen as the dominant form of vegetation in the Central Ridge in the year 1989 with each covering 40.04% and 37.47% respectively. A rapid decline in the area under the scrub category was observed which was found to be 39.17%, 23.55, 18.54%, 17.31%, 16.40% and 11.16% for the years 1995, 2000, 2005, 2010, 2015 and 2020 respectively. At the same time, a rapid increase in moderately dense forest was observed which incremented from just 10.64% in 1995 to 26.39% in the year 2000. By the year 2020, the area under moderately dense forest has covered 50.26% of the total area. The area under the open forest category registered a consistent decline from 1989 to 2020.

Figure 5.
LULC Variations in Central Ridge
Table 4.
Changes in LULC classes year wise in % for Central Ridge
|
|
Year
|
| Area in %
|
| Class
|
1989
|
1995
|
2000
|
2005
|
2010
|
2015
|
2020
|
| Moderately Dense Forest |
8.458 |
10.645 |
26.397 |
31.750 |
36.125 |
43.156 |
50.266 |
| Open Forest |
37.478 |
35.901 |
33.893 |
33.686 |
32.226 |
24.294 |
22.336 |
| Scrub |
40.040 |
39.179 |
23.550 |
18.549 |
17.318 |
16.401 |
11.165 |
| Built-Up |
6.679 |
6.947 |
8.413 |
9.364 |
9.263 |
11.814 |
11.948 |
| Water Body |
0.425 |
0.414 |
0.296 |
0.246 |
0.224 |
0.269 |
0.218 |
| Open Area |
6.920 |
6.914 |
7.451 |
6.405 |
4.844 |
4.067 |
4.067 |
| Total Area (Sq. Kms.) |
16.08 |
The area under waterbody decreased from 0.42% to 0.21% while open area also declined from 6.92% to 4.06%. In the case of built-up and human settlements, a proportional increase can be seen with major turnaround from 2010 onwards. A network of major arterial roads has fragmented the entire forest habitat of Central Ridge. Plans are in place now to remove invasive Prosopis juliflora in phase wise manner and replace it with native vegetation.
South-Central Ridge
The LULC analysis (Figure 7, Figure 8 and Table 5) of South-Central Ridge has revealed pattern as was observed in Northern and Central Ridge areas. There is a continuous increase in moderately dense forest which was only 13.12% in 1989 and rose to 14.10% in 1995, 22.61% in 2000, 24.17% in 2005, 28.46% in 2010, 38.28% in 2015 and finally 42.90% in 2020. Area under open forest category has initially registered an increase from 36.51% in 1989 to 40.03% in 1995, 45.68% in 2000 and 46.12% in 2005. From 2010 onwards it started shrinking and stood at 26.74% in 2020. Scrub area has witnessed a steeper decline from 35.45% in 1989 to 12.23% in 2020. There is almost 3 times increase in the area under built-up and human settlements which changed from 5.26% in 1989 to 15.26% in 2020. Open area class in this segment was represented by 7.32% area in 1989 which declined to a minimal 0.61% in 2020. The noticeable change was observed in the area under water bodies which initially shrunk from 2.31% in 1989 to 1.38% in 2010 but again increased to 2.23% in 2020. This has been probably due to active water management and harvesting practices introduced in this area by Delhi Development Authority (DDA) and a part of this area has been managed as Neela Hauz Biodiversity Park.

Table 5.
Changes in LULC classes year wise in % for South-Central Ridge
|
|
Year
|
| Area in %
|
| Class
|
1989
|
1995
|
2000
|
2005
|
2010
|
2015
|
2020
|
| Moderately Dense Forest |
13.129 |
14.106 |
22.610 |
24.178 |
28.469 |
38.284 |
42.909 |
| Open Forest |
36.511 |
40.031 |
45.683 |
46.120 |
37.050 |
25.925 |
26.747 |
| Scrub |
35.457 |
32.451 |
18.859 |
16.752 |
15.647 |
16.932 |
12.230 |
| Built-Up |
5.267 |
8.299 |
8.273 |
8.736 |
14.748 |
15.031 |
15.262 |
| Water Body |
2.312 |
2.184 |
1.773 |
1.593 |
1.387 |
2.184 |
2.235 |
| Open Area |
7.323 |
2.929 |
2.801 |
2.621 |
2.698 |
1.644 |
0.617 |
| Total Area (Sq. Kms.) |
3.50
|
Southern Ridge
Figure 9, Figure 10 and Table 6 shows area under each class for Southern Ridge for each period of analysis and magnitude of change. Drastic changes were observed in the forest cover of the region. In 1989, LULC analysis depicts the predominance of scrub and open area in the region, covering 68.43% of the total area. Although, mining was banned in the area in 1986 but our study has shown that the area affected by mining in 1989 was 0.97% of the total area. The area under open forest and moderately dense forest in 1989 was 22.20% and 3.43% respectively. By 1995, the moderately dense forest category rose to 6.05%, open forest reported an increment and stood at 27.03% while a decrease has been observed in the scrub category (44.77%). By the year 2000, active plantation of the Bhatti Mines area has been initiated by the Forest Department in association with Eco-Task Force.
However, that year the percentage of area in moderately dense forest, open forest and scrub was 7.52%, 25.82% and 43.45% respectively. From 2005 onwards, a steady increase in both moderately dense forest and open forest has been observed until 2015, whereafter a slight decrease in the moderately dense forest category has been observed in the year 2020. At the same time, a fall has been observed in the area under the scrub category till 2015 and a slight increase thereafter till 2020. A probable reason behind this can be removal of invasive plants such as Prosopis juliflora and Lantana camara and their replacement with the plantation of native tree species by the Forest Department (The Indian Express, 2017b).

Figure 9.
LULC Variations in Southern Ridge
As seen in other parts of Delhi Ridge, a continuous increase in built-up area from meagre 1.50% in 1989 to 6.60% in 2020 has been noticed. It must be mentioned that over the years, parts of agricultural land/fallow land/common land including pastures of surrounding villages of Southern Ridge like Asola, Bhatti and Maidangarhi have seen conversion into farmhouses and rampant encroachment cases have also been reported. The open area has witnessed a continuous decline while the area affected by mining has substantially reduced till the year 2000 and nullified thereafter because of active plantation undertaken by the Forest Department and invasion by Prosopis juliflora. The area under water bodies has seen a slight increase from 0.43% in 1989 to 0.49% in 2015 because of active rain water harvesting and water management techniques adopted by the Forest Department. On the other hand, it has seen a slight dip in the year 2020 (0.43%).

Table 6.
Changes in LULC classes year wise in % for Southern Ridge
|
|
Year
|
| Area in %
|
| Class
|
1989
|
1995
|
2000
|
2005
|
2010
|
2015
|
2020
|
| Moderately Dense Forest |
3.436 |
6.054 |
7.527 |
9.352 |
17.024 |
22.101 |
19.367 |
| Open Forest |
22.200 |
27.033 |
25.822 |
30.505 |
39.129 |
38.353 |
36.352 |
| Scrub |
46.237 |
44.774 |
43.458 |
41.919 |
33.193 |
27.602 |
29.837 |
| Built-Up |
1.504 |
2.591 |
3.085 |
3.606 |
3.610 |
4.965 |
6.608 |
| Water Body |
0.436 |
0.403 |
0.380 |
0.374 |
0.343 |
0.496 |
0.430 |
| Open Area |
25.209 |
18.700 |
19.568 |
14.173 |
6.701 |
6.482 |
7.406 |
| Mining |
0.977 |
0.444 |
0.159 |
0.072 |
0.000 |
0.000 |
0.000 |
| Total Area (Sq. Kms.) |
43.55
|
Correlation analysis has been carried out to understand the relationship between LULC classes (Table 6Table 7). In case of Northern Ridge it has been observed that strong negative relationship exists between moderately dense forest and open forest (r = -0.968) and moderately dense forest & scrub categories (r = -0.985), indicating that with increase in area under moderately dense forest the area under rest two classes has decreased. Similar result has been observed for Central Ridge and South-Central Ridge too except Southern Ridge where relationship between moderately dense forest & open forest were observed to be strongly positively correlated (r =0.952). In case of built-up, strong negative relationship was found between scrub & built-up and open area & built-up classes for all the four parts of Ridge, indicating the probability that the built-up has increased largely at the expanse of scrub and open area. Negative relationship was also observed between open forest & built-up classes in case of Northern Ridge (r = -0.800), Central Ridge (r = -0.964) and South-Central Ridge (r = -0.690).
Table 7.
Coefficient of Correlation (r) values for various LULC classes
| Part of Ridge
|
Moderately Dense Forest & Open Forest
|
Moderately Dense Forest & Scrub
|
Open Forest & Scrub
|
Open Forest & Built-up
|
Scrub & Built-up
|
Open Area & Built-up
|
Moderately Dense Forest & Open Area
|
| Northern Ridge |
-0.968 |
-0.985 |
0.915 |
-0.800 |
-0.944 |
-0.734 |
-0.680 |
| Central Ridge |
-0.907 |
-0.975 |
0.796 |
-0.96 |
-0.907 |
-0.873 |
-0.841 |
| South-Central Ridge |
-0.699 |
-0.852 |
0.240 |
-0.690 |
-0.777 |
-0.774 |
-0.780 |
| Southern Ridge |
0.9520 |
-0.996 |
-0.934 |
0.767 |
-0.857 |
-0.8280 |
-0.956 |
Discussion & Conclusion
All major urban development plans uphold the significance of the protection and conservation of urban green spaces to ensure sustainable development (Sathyakumar, Ramsankaran et al., 2020). Assessing the changes occurring within urban green spaces is a prerequisite to ensuring effective, long-term management of these areas (Kolcsár, Csikós et al., 2021). The present study has provided baseline information on the spatio-temporal changes observed in the vegetation of Delhi Ridge forest in the last three decades and has also highlighted the impact caused by urbanization in the region. Although the previous studies only focussed on a part of Delhi Ridge (Sharma, Chaudhry et al., 2017), this study has undertaken the spatio-temporal analysis of all the four segments of Delhi Ridge.
The results of the study confirm that Delhi Ridge has undergone dramatic transformations in terms of vegetation cover with changes occurring in quick succession in these decades. There is an increase in vegetation density in all the four parts of the Ridge with a simultaneous decrease in scrub and open area. Maximum percentage change in area in case of moderately dense forest class has been observed in Central Ridge (494.31%) followed closely by Southern Ridge (463.61%), South-Central Ridge (222.89%) and Northern Ridge (118.60%) from the period of 1989 to 2020. The efforts of greening agencies are reflected in overall increase in green cover across Delhi including the Delhi Ridge (Imam and Banerjee, 2016).
An increase in the human population through migration can directly impact the land use/land cover of the region (Nelson, Sander et al., 2010), and the same holds for Delhi as well. A continuous increase in built-up and human settlements in surrounding areas and within the limits of Ridge is of concern and have far-reaching implications as it increases habitat fragmentation and thus affects the movement of wildlife and the overall tendency of forest to sustain biodiversity (Liu, He et al., 2016). Maximum percentage change in area in case of the built-up class has been observed in Southern Ridge (339.28%) followed by South-Central Ridge (189.75%), Central Ridge (78.89%) and Northern Ridge (34%) from the period of 1989 to 2020. It has been observed that most of the built-up area observed in and around Delhi Ridge has come at the expanse of scrub and open area. Some previous studies carried out in Delhi/National Capital Region also confirm that scrubland, barren land and open spaces are major land-use types that get converted into built-up as urbanization progressed (Naikoo, Rihan et al., 2020; Paul, Saxena et al., 2021).
We have carried out field visits in all the four segments of Delhi Ridge along with thorough research of published material to ensure accuracy in the results. However, our study is based on publicly available data having a resolution of 30 metres which doesn’t take into account of some under canopy changes occurring in the region. Nevertheless, the study findings will be instrumental in designing a rational, region-specific policy framework which can be applied in the management of other important green infrastructures as well that is located in Delhi, given the fact that the city is already experiencing high population growth, land scarcity, massive consumption of resources, and high air pollution levels along with enhanced risk from climate change. The key management steps that can be immediately ensured include checking and removal of illegal encroachment along the boundaries of the Ridge, implementation of nature-based solutions such as ecological restoration in Ridge management rather than ornamental interventions which can drastically alter the habitat of the Ridge, incorporating prediction based modelling approaches in the development of regional and subregional masterplans so that future impact of urbanization on Delhi Ridge area can be quantified and preventive measures can be ensured beforehand. Moreover, there is an urgent need for the formulation of a separate action plan for each segment of Delhi Ridge taking into account patterns of urbanization in the neighbourhood region to ensure integrated management. It is recommended that comprehensive investigative research work mapping the impact of urbanization on the ecosystem services supply from the Delhi Ridge must be undertaken. The results of our study can provide suitable base for such assessments in the future.
Author Contributions
Conceptualization, B.C. and Y.S.C.K.; methodology, B.C. and B.S.; investigation, B.C. and B.S.; data curation, B.C. and B.S.; writing—original draft preparation, B.C.; writing—review and editing, B.C. and B.S.; supervision, Y.S.C.K. All authors have read and agreed to the published version of the manuscript.
Ethics Declaration
The authors declare that they have no conflicts of interest regarding the publication of the paper.
Acknowledgments
The authors would like to thank USGS for making the LANDSAT data available for download.
References
- Ahmad, F., Goparaju, L., et al. (2017). "Lulc Analysis of Urban Spaces Using Markov Chain Predictive Model at Ranchi in India". Spatial Information Research, 25(3), 351-359. doi: https://doi.org/10.1007/s41324-017-0102-x.
- Aksoy, T., Dabanli, A., et al. (2022). "Evaluation of Comparing Urban Area Land Use Change with Urban Atlas and Corine Data". Environmental Science and Pollution Research, , 1-21. doi: https://doi.org/10.1007/s11356-021-17766-y.
- Al-Rashid , M. A., Nadeem, M., et al. (2021). "An Integrated Approach to Analysing the Urban Growth Patterns: The Case of Sialkot, Punjab, Pakistan". International Review for Spatial Planning and Sustainable Development, 9(4), 116-138. doi: http://dx.doi.org/10.14246/irspsd.9.4_116.
- Alzamili , H. H., El-Mewafi, M., et al. (2015). "Monitoring Urban Growth and Land Use Change Detection with Gis and Remote Sensing Techniques in Al-Nasiriyah City in Iraq". International Journal of Scientific and Engineering Research, 6(7), 2229-5518.
- Avtar, R., Tripathi, S., et al. (2019). "Population–Urbanization–Energy Nexus: A Review". Resources, 8(3), 136. doi: https://doi:10.3390/resources8030136.
- Bera, B., Saha, S., et al. (2020). "Estimation of Forest Canopy Cover and Forest Fragmentation Mapping Using Landsat Satellite Data of Silabati River Basin (India)". KN-Journal of Cartography and Geographic Information, 70(4), 181-197. doi: https://doi.org/10.1007/s42489-020-00060-1.
- Bhat , P. A., ul Shafiq, M., et al. (2017). "Urban Sprawl and Its Impact on Landuse/Land Cover Dynamics of Dehradun City, India". International Journal of Sustainable Built Environment, 6(2), 513-521. doi: https://doi.org/10.1016/j.ijsbe.2017.10.003.
- Champion , H. G. and Seth , S. K. (1968). A Revised Survey of the Forest Types of India. Manager of publications, New Delhi, India.
- Cheng, R., Chen, W., et al. (2019). "Spatiotemporal Variation Characteristics of Ecosystems and Their Driving Forces in the Min Delta Urban Agglomeration". International Review for Spatial Planning and Sustainable Development, 7(1), 177-194. doi: https://doi.org/10.14246/irspsda.7.1_177.
- Cohen, B. (2006). "Urbanization in Developing Countries: Current Trends, Future Projections, and Key Challenges for Sustainability". Technology in society, 28(1-2), 63-80. doi: https://doi.org/10.1016/j.techsoc.2005.10.005.
- Das, M. and Das, A. (2019). "Dynamics of Urbanization and Its Impact on Urban Ecosystem Services (Uess): A Study of a Medium Size Town of West Bengal, Eastern India". Journal of Urban Management, 8(3), 420-434. doi: https://doi.org/10.1016/j.jum.2019.03.002.
- Delhi State Action Plan on Climate Change. (2019). "Department of Environment, Government of Nct of Delhi". Retrieved from http://web.delhi.gov.in/wps/wcm/connect/58632d00420a6bb5a265b328c2355f02/Delhi% |on 10 June, 2021.
- Delhi Biodiversity Foundation D.D.A. (2021). "Dda Biodiversity Parks of Delhi". Retrieved from https://www.delhibiodiversityparks.org/index.html, on 5 June, 2021.
- Dinda, S., Chatterjee , N. D., et al. (2021). "An Integrated Simulation Approach to the Assessment of Urban Growth Pattern and Loss in Urban Green Space in Kolkata, India: A Gis-Based Analysis". Ecological Indicators, 121, 107178. doi: https://doi.org/10.1016/j.ecolind.2020.107178.
- Economic Survey of Delhi. (2018-19). "Demographic Profile". Retrieved from http://delhiplanning.nic.in/sites/default/files/2%29%20Demographic%20Profile.pdf, on 7 October, 2021.
- El-Shabasy, A. (2017). "Study on Allelopathic Effect of Prosopis Juliflora on Mineral Content of Acacia Ehrenbergiana in Farasan Islands, Ksa". Journal of Medicinal Plant Studies 5(1), 130-134.
- Ha, T. V., Tuohy, M., et al. (2020). "Monitoring and Mapping Rural Urbanization and Land Use Changes Using Landsat Data in the Northeast Subtropical Region of Vietnam". The Egyptian Journal of Remote Sensing and Space Science, 23(1), 11-19. doi: https://doi.org/10.1016/j.ejrs.2018.07.001.
- Hadagha , F. Z., Farhi, A., et al. (2021). "New Tool to Improve the Oasis Ecosystem Using Qgis. Case Study: Biskra City in Algeria". Urbanism. Arhitectura. Constructii, 12(1), 45-66.
- Haddad , N. M., Brudvig , L. A., et al. (2015). "Habitat Fragmentation and Its Lasting Impact on Earth’s Ecosystems". Science advances, 1(2), e1500052. doi: https://doi.org/10.1126/sciadv.1500052.
- Han, H. and Lin, L. (2017). "Predicting Growth of City's Built-up Land Based on Scenario Planning". International Review for Spatial Planning and Sustainable Development, 5(2), 80-92. doi: https://doi.org/10.14246/irspsd.5.2_80.
- Han, Y., Kang, W., et al. (2018). "Mapping and Quantifying Variations in Ecosystem Services of Urban Green Spaces: A Test Case of Carbon Sequestration at the District Scale for Seoul, Korea (1975–2015)". International Review for Spatial Planning and Sustainable Development, 6(3), 110-120. doi: http://dx.doi.org/10.14246/irspsd.6.3_110.
- He, J., Huang, J., et al. (2017). "The Evaluation for the Impact of Land Use Change on Habitat Quality: A Joint Contribution of Cellular Automata Scenario Simulation and Habitat Quality Assessment Model". Ecological Modelling, 366, 58-67. doi: https://doi.org/10.1016/j.ecolmodel.2017.10.001.
- Heidt, V. and Neef, M. (2008). "Benefits of Urban Green Space for Improving Urban Climate". Ecology, Planning, and Management of Urban Forests (pp. 84-96). Springer. doi: https://doi.org/10.1007/978-0-387-71425-7_6.
- Hirokawa , K. H. (2011). "Sustainability and the Urban Forest: An Ecosystem Services Perspective". Natural resources journal, 51, 233-259.
- Hussain, S. and Karuppannan, S. (2021). "Land Use/Land Cover Changes and Their Impact on Land Surface Temperature Using Remote Sensing Technique in District Khanewal, Punjab Pakistan". Geology, Ecology, and Landscapes, 1-13. doi: https://doi.org/10.1080/24749508.2021.1923272.
- Imam , A. U. and Banerjee , U. K. (2016). "Urbanisation and Greening of Indian Cities: Problems, Practices, and Policies". Ambio, 45(4), 442-457. doi: https://doi.org/10.1007/s13280-015-0763-4.
- Kolcsár , R. A., Csikós, N., et al. (2021). "Testing the Limitations of Buffer Zones and Urban Atlas Population Data in Urban Green Space Provision Analyses through the Case Study of Szeged, Hungary". Urban Forestry & Urban Greening, 57, 126942. doi: https://doi.org/10.1016/j.ufug.2020.126942.
- Kumne, W. and Samanta, S. (2019). "Remote Sensing and Gis Application on Forest Resource Mapping and Monitoring in Bulolo District, Morobe Province". Journal of Geoscience and Environment Protection, 7(2), 37-48. doi: https://doi.org/10.4236/gep.2019.72003.
- Liu, Z., He, C., et al. (2016). "The Relationship between Habitat Loss and Fragmentation During Urbanization: An Empirical Evaluation from 16 World Cities". PLoS One, 11(4), e0154613. doi: https://doi.org/10.1371/journal.pone.0154613.
- Livesley, S., McPherson , E. G., et al. (2016). "The Urban Forest and Ecosystem Services: Impact on Urban Water, Heat, and Pollution Cycles at the Tree, Street, and City Scale". Journal of Environmental Quality, 45(1), 119-124. doi: https://doi.org/10.2134/jeq2015.11.0567.
- Mahdhi, M., Tounekti, T., et al. (2018). "Invasive Character of Prosopis Juliflora Facilitated by Its Allelopathy and a Wide Mutualistic Interaction with Soil Microorganisms". Journal of Biological Sciences, 18(3), 115-123. doi: https://doi:10.3923/jbs.2018.115.123.
- Matthews , T. J. (2014). "Analysing and Modelling the Impact of Habitat Fragmentation on Species Diversity: A Macroecological Perspective". Frontiers of Biogeography, 7(2), 60-68. doi: https://doi.org/10.21425/f57225942.
- Mberego, S. and Li, Y. (2017). "The Expansion of Densely Inhabited Districts in a Megacity-Case of Tokyo". International Review for Spatial Planning and Sustainable Development, 5(3), 116-133. doi: https://doi.org/10.14246/irspsd.5.3_116.
- Mundia , C. N. and Murayama, Y. (2010). "Modeling Spatial Processes of Urban Growth in African Cities: A Case Study of Nairobi City". Urban Geography, 31(2), 259-272. doi: https://doi.org/10.2747/0272-3638.31.2.259.
- Naikoo , M. W., Rihan, M., et al. (2020). "Analyses of Land Use Land Cover (Lulc) Change and Built-up Expansion in the Suburb of a Metropolitan City: Spatio-Temporal Analysis of Delhi Ncr Using Landsat Datasets". Journal of Urban Management, 9(3), 347-359. doi: https://doi.org/10.1016/j.jum.2020.05.004.
- Nelson, E., Sander, H., et al. (2010). "Projecting Global Land-Use Change and Its Effect on Ecosystem Service Provision and Biodiversity with Simple Models". PLoS ONE, 5(12), e14327. doi: https://doi.org/10.1371/journal.pone.0014327.
- Paul, S., Saxena , K. G., et al. (2021). "Tracing Land Use and Land Cover Change in Peri-Urban Delhi, India, over 1973–2017 Period". Environmental Monitoring and Assessment, 193(2), 1-12. doi: https://doi.org/10.1007/s10661-020-08841-x.
- Pawe , C. K. and Saikia, A. (2018). "Unplanned Urban Growth: Land Use/Land Cover Change in the Guwahati Metropolitan Area, India". Geografisk Tidsskrift-Danish Journal of Geography, 118(1), 88-100. doi: https://doi.org/10.1080/00167223.2017.1405357.
- Phan , D. C., Trung , T. H., et al. (2021). "First Comprehensive Quantification of Annual Land Use/Cover from 1990 to 2020 across Mainland Vietnam". Scientific reports, 11(1), 1-20. doi: https://doi.org/10.1038/s41598-021-89034-5.
- Prabu, P. and Dar , M. A. (2018). "Land-Use/Cover Change in Coimbatore Urban Area (Tamil Nadu, India)—a Remote Sensing and Gis-Based Study". Environmental monitoring and assessment, 190(8), 1-14. doi: https://doi.org/10.1007/s10661-018-6807-z.
- Rahman , M. M. and Sumantyo , J. T. S. (2010). "Mapping Tropical Forest Cover and Deforestation Using Synthetic Aperture Radar (Sar) Images". Applied Geomatics, 2(3), 113-121. doi: https://doi:10.1007/s12518-010-0030-0.
- Ramaiah, M. and Avtar, R. (2019). "Urban Green Spaces and Their Need in Cities of Rapidly Urbanizing India: A Review". Urban science, 3(3), 94. doi: https://doi.org/urbansci3030094.
- Rao, P. and Puntambekar, K. (2014). "Evaluating the Urban Green Space Benefits and Functions at Macro, Meso and Micro Level: Case of Bhopal City". International Journal of Engineering Research & Technology (IJERT), 3(6), 359-369.
- Rawat, J. and Kumar, M. (2015). "Monitoring Land Use/Cover Change Using Remote Sensing and Gis Techniques: A Case Study of Hawalbagh Block, District Almora, Uttarakhand, India". The Egyptian Journal of Remote Sensing and Space Science, 18(1), 77-84. doi: https://doi.org/10.1016/j.ejrs.2015.02.002.
- Sathyakumar, V., Ramsankaran, R., et al. (2020). "Geospatial Approach for Assessing Spatiotemporal Dynamics of Urban Green Space Distribution among Neighbourhoods: A Demonstration in Mumbai". Urban Forestry & Urban Greening, 48, 126585. doi: https://doi.org/10.1016/j.ufug.2020.126585.
- Sharma, V. and Chaudhry, S. (2018). "Vegetation Composition and Plant Diversity in Mining Disturbed Tropical Thorn Forest of Asola-Bhatti Wildlife Sanctuary, Northern India". Taiwania, 63(3), 267-280. doi: https://doi.org/10.6165/tai.2018.63.267.
- Sharma, V., Chaudhry, S., et al. (2017). "Monitoring Post Mining Forest Dynamics of the Tropical Thorn Forest in Asola Bhatti Wildlife Sanctuary, India Using Multi-Temporal Satellite Data". International Journal of Applied Environmental Sciences, 12(5), 1031-1044.
- Sinha , G. N. (2014). An Introduction to the Delhi Ridge. Department of Forests & Wildlife, Govt. of NCT of Delhi, New Delhi.
- Smith , J. H. (2003). "Land-Cover Assessment of Conservation and Buffer Zones in the Bosawas Natural Resource Reserve of Nicaragua". Environmental Management, 31(2), 0252-0262. doi: https://doi.org/10.1007/s00267-002-2774-8.
- Srivastava, R., Singh, S., et al. (2020). "Changes in Vegetation Cover Using Gis and Remote Sensing: A Case Study of South Campus Bhu, Mirzapur, India". Journal of Scientific Research, 64(2), 135-141. doi: https://doi.org/10.37398/JSR.2020.640219.
- Sturiale, L. and Scuderi, A. (2019). "The Role of Green Infrastructures in Urban Planning for Climate Change Adaptation". Climate, 7(10), 119. doi: https://doi.org/10.3390/cli7100119.
- Thakur , T. K., Patel , D. K., et al. (2020). "Land Use Land Cover Change Detection through Geospatial Analysis in an Indian Biosphere Reserve". Trees, Forests and People, 2, 100018. doi: https://doi.org/10.1016/j.tfp.2020.100018.
- The Indian Express. (2017a). "Tree Native to Mexico, Introduced by British: Bid Begins to Remove Vilayati Kikar, So Other Trees Also Stand a Chance". Retrieved from https://indianexpress.com/article/cities/delhi/tree-native-to-mexico-introduced-by-british-bid-begins-to-remove-vilayati-kikar-so-other-trees-also-stand-a-chance/, on 4 June, 2021.
- The Indian Express. (2017b). "New Delhi: Forest Dept Prepares to Replace Vilayati Kikar with Native Species". Retrieved from https://indianexpress.com/article/cities/delhi/new-delhi-forest-dept-prepares-to-replace-vilayati-kikar-with-native-species-4574107/M, on 4 June, 2021.
- Uttara, S., Bhuvandas, N., et al. (2012). "Impacts of Urbanization on Environment". International Journal of Research in Engineering and Applied Sciences, 2(2), 1637-1645.
- Vargas-Hernández , J. G., Pallagst, K., et al. (2018). "Strategic Management Innovation of Urban Green Spaces for Sustainable Community Development". Handbook of Engaged Sustainability. doi: https://doi.org/10.1007/978-3-319-53121-2_50-1.
- Yılmaz, M. and Terzi, F. (2020). "Characteristics of Spatio-Temporal Urban Growth Patterns Due to the Driving Forces of Urbanization: The Coastal City of Antalya, Turkey". International Review for Spatial Planning and Sustainable Development, 8(3), 16-33. doi: https://doi.org/10.14246/irspsd.8.3_1.


