Abstract
The issue of sustainability is an interesting discussion on every concept of development in all cities worldwide. One issue in urban development concerns urban sustainability. It is widely understood in urban development that the distribution of land use directly impacts the sustainability of cities. The history of the city always impacts the distribution of land use. This study examines the relationship between land use distribution and the spatial structure of the road network and their contribution to urban sustainability in Central Business District (CBD) zone-based areas having historical value. Cities planned during ancient times are used as research objects. Connectivity and depth are used as syntax space attributes. Malang, Melaka and Kanazawa cities are chosen for this study for their historical value. Comparative studies were carried out by calculating the connectivity and integration axial lines of three cities in the CBD zone. DepthMapX is a space syntax tool for calculating the space syntax attributes used for this study. The study results are expected to help determine the integration concerning specific city zones. Furthermore, it will be able to gauge the suitability of the distribution pattern of land use and the spatial configuration pattern for these historic cities.
Introduction
Urban areas face rapid urban development, causing the expansion of built-up land. In addition, these areas also witness urban expansion, which is expected to continue in suburban areas (Daunt, Inostroza et al., 2021; He, Ling et al., 2022). Based on such conditions, the government issued a land-use zoning (LUZ) regulation to control land expansion and maintain a balance with the environment. However, each city has different characteristics influenced by its history and formation.
This condition creates different LUZ rules for each city, requiring targeted maintenance of the shape aspects of the city. So, every development needs to comply with what is stated in the master plan and adhere to the LUZ regulations incorporated in the city master plan (Tutuko, Pindo and Shen, 2016). Several studies have discussed zoning regulation in areas with different urban forms because of their high historical value. Eldiasty, Hegazi et al. (2021) discussed maintaining the city's shape in parts with certain zones, such as trade-in Egypt. Renne and Listokin (2021) discussed districts with historical value related to urban population mobility in the US. These studies prove that cities with historical values tend to develop and maintain such values. Thus, land parcel regulations are an essential part for regional planners to limit land use and control city growth, one which addresses concerns about the historical value of the city (Bonifacius, Tutuko et al., 2021; Tutuko, Pindo, Bonifacius et al., 2021a; Tutuko, Pindo, Bonifacius et al., 2019). In addition, there are also several studies on historic colonial cities based on participatory, political, and economic approaches (Agrawal, 2010; Rodríguez-Alegría, Millhauser et al., 2013; Yi and Ryu, 2015). In its formation, Indonesia was a country colonised by the Dutch for approximately 350 years, creating several colonial cities. The Dutch had a political interest in approaching the kings, so there was a border between the palace area and the Dutch territory. They wanted to build the same city as in the Netherlands. Therefore, the architecture in colonial cities is very similar to building construction in the Netherlands (Coté, 2014; van Roosmalen, 2000).
Hence, studying the distribution pattern of land use in a city's spatial configuration of historical areas is necessary. Previous studies have also shown that urban development often occurs in the central business district (CBD) zone because it concerns the mobility centre of the city's residents. Various studies have been carried out about urban patterns (Bonifacius, Tutuko et al., 2021; Tutuko, Pindo, Bonifacius et al., 2021b; Tutuko, Pindo, Bonifacius et al., 2019) using a comparison ratio between colonial Indonesia and the countries that colonised it. The depth approach in the Justified Graph is usually selected to determine the hierarchy of relationships in syntactic space. University College London developed this study to assess the spatial structures of urban and other areas to obtain connectivity and depth information from zone arrangements in cities (Agirbas, 2020; Can and Heath, 2016; Karimi, 2018; Penn, A, 2001; Penn, Alan, Hillier et al., 1998; Prasertsubpakij and Nitivattananon, 2012).
This method extends previous research on city development patterns, especially for cities with historical value. This study requires the calculation of the essential zones comprising urban land use, especially in historic areas. The approach determines the land use distribution pattern in the spatial configuration of cities in Indonesia that the Dutch once colonised. Subsequently, a similar study was conducted on Kanazawa and Melaka, considering their historical value. The two cities were chosen by considering the scale and similarity in the characteristics of the relatively similar cities. The calculation is done using DepthMapX, a tool to calculate the space syntax attribute. The master plan or urban planning data related to the three cities was collected, and connectivity patterns were calculated.
Several previous studies have shown that CBD zones with historical value witness significant urban development. This study investigates the potential of CBD areas having historical significance that are maintained and trigger development in the surrounding area. This research aims to determine the CBD zone that has historical value. The CBD zone was chosen because it is an area that should have significant connectivity to other zones. Besides, this area has high development potential.
The approach analyses the suitability between the distribution pattern of land use and the spatial configuration pattern of the historic city using the spatial syntax attribute. The goal is to enrich the scientific knowledge concerning space syntax of specific land-use patterns. It will help designers, planners, and policymakers to determine urban planning conditions and land use in the context of historical value.
Literature Review
Land Use Zoning (LUZ)
City governments commonly need tools to facilitate and control their urban development. Land-use zoning (LUZ) helps control the provision of land and buildings (Mark and Goldberg, 1986). Local governments act as decision-makers and determine local land-use policies on housing provision and the integration of economic and environmental land use (Van Assche and Djanibekov, 2012). LUZ also transforms land use for developers to construct new housing and supporting facilities to benefit new entrants (Shahraki, Sauri et al., 2011; Sullivan, 1984; Tse, 2001; Weaver and Lawton, 2001). LUZ also addresses urban sprawl, which includes issues like city land use and its environmental effects like land degradation, ecological issues, and financing (Aguilar and Santos, 2011; Gennaio, Hersperger et al., 2009; Lestrelin, 2010; Nellis and Maca, 1986; Poelmans and Van Rompaey, 2009; Saint-Macary, Keil et al., 2010; Zhao, 2010; Zhong, Huang et al., 2011).
The study of cities with historical value using the space syntax attribute is carried out by studying the connectivity and integration of the road network, providing direction for the city’s development. Studies have also been conducted on urban mobility about LUZ and accessibility. Access is essential for the integration of land use with various transport networks. The influencing factors are interaction, sustainability component, intensity and relationship between urban land use and road transportation network in various subdivisions (Ahmadzai, 2020). In this study, LUZ becomes a necessary variable as a basis for determining high potential city areas. Here, office and trade functions in the CBD zone are targeted if they have historical value.
Sustainable Urban Forms
The shape of a city dramatically affects the sustainability of various aspects, such as shape, size, and density. Urban sustainability requires a pre-requisite relationship between the shape of the city and the scope of city elements at each geographical scale. The relationship will help achieve sustainable urban forms if understanding can be obtained. The movement of urban residents to sub-urban areas with wider and cheaper land is an urban sprawl indicator, indicating that urban areas are then neglected (Gibbins, 2001). This problem continues with the development that ignores the city's previous form, contrary to the principle of sustainable urban form. City development cannot be halted; however, proper planning considering the required shape or city arrangement can overcome issues.
Space Syntax
Space Syntax is a graphical theory used by architects to examine how the spatial structure of buildings and cities affects the economic, social and environmental outcomes of human movements and social interactions (Dawson, 2002). The space syntax method can be used in city space reading. This method was developed by a research team led by Bill Hillier and Julienne Hanson at Bartlett School of Architecture and Planning, University College London, in the late 1970s and early 1980s to study urban space (Hillier and Hanson, 1984). The syntax space method proves helpful in reading objective space and stating a relationship between physical and social structure. The operation of the urban system can be applied to building structures (Önder and Gigi, 2010). Space Syntax is the theory and technique associated with the relationship between the complex spatial arrangement and the human being (Conroy-Dalton and Dalton, 2007).
Law, Chiaradia, and Schwander studied space syntax on a city scale. The study focused on city development by combining geometric and geographic accessibility analysis. The city's development can be seen from the mobility that occurs via the accessibility of existing transportation modes in the city. As a network, it can be used on a city's geometric patterns and geographical conditions (Law, Chiaradia et al., 2012). The Space Syntax approach is usually implemented for building and city layouts. Space syntax encompasses a set of theories and analytical, quantitative, and descriptive tools for analysing spatial formations at different scales: cities, buildings, and interior spaces (Bonifacius, Tutuko et al., 2021; Boutabba and Farhi, 2011; Conroy-Dalton, Hölscher et al., 2005; Hillier, 2007). Space syntax also focuses on lines (e.g., streets, passages) and provides a valuable guide for evaluating a space layout (Batty, 2004). In the urban context, this is influenced by human movement and social interaction (Dawson, 2002). The space syntax method can assess city space (Hillier, 2007) and helps read objective areas. Moreover, there is a relationship between physical and social structure. In the study of urban space readings, the operation of urban systems can be read in conjunction with building structures (Önder and Gigi, 2010). The approach can be implemented in large-scale urban areas, settlements, and buildings.
Methods
Zoning System of Malang City, Indonesia
The Government of Indonesia established a National Spatial Plan for all cities and regencies, further elaborated in a Detailed Urban Spatial Plan through the Regional Development Planning Agency (BAPPEDA). This office determines land-use zoning with two main criteria for developing and building conservation zones (Figure 1). The master plan document describes several zones generally defined in LUZ in Indonesia, including public facilities, settlements, offices, trade and services, agriculture, military, industry, vacant land, livestock, and forests.

Malang is the second-largest city in the East Java province. This city was included in the Dutch design by Herman Thomas Karsten (Coté, 2014; van Roosmalen, 2000). At that time, the development of Malang city was marked by the expansion of transportation modes and inter-city routes to the north of Malang (Malang-Pasuruan-Surabaya) in the 1880s (Hadinoto, 1996; Subadyo, Tutuko et al., 2018; van Roosmalen, 2000) as depicted in Figure 2. Malang has the character of a historical Dutch colonial city with several development phases. During those days, the Dutch government required the renewal or reformation of the city structure for city development. Hence, city development needed evaluation and control to maintain sustainability (Subadyo, Tutuko et al., 2018).


The first milestone in the development of Malang (Phase I/Bouwplan I) was completed on May 18, 1917, in the form of a residential zone for Europeans. Then, on April 26, 1920, the second phase of the city expansion (Bouwplan II) began with a focus on the development zone for the regional government centre of Malang. Malang was developed and built with a concentric urban spatial structure in this zone. The alun-alun was the city centre, similar to small European cities in the 18th century. In Bouwplan III, public facilities like city graves were developed. In Bouwplan IV, middle and lower housing zones were developed. In 1924, Bouwplan V focused on sports areas as exclusive facilities for the Dutch; these were implemented in the housing zone for the rich. In Phase VI, development was carried out in the old city area. In Bouwplan VII, Malang developed an upscale residential area to the city's west. The final stage, Bouwplan VIII, developed an industrial zone in the Southern part of Malang (Hadinoto, 1996; Subadyo, Tutuko et al., 2018), as depicted in Figure 3.
Malang was the first city to have a framework plan during colonial urban planning in Indonesia. Malang is a medium-sized city located interior of the Brantas River, in the highlands between the Semeru and Kawi mountains. The city was successfully built mainly due to the many concessions granted to private entrepreneurs in coffee, rubber, and rail links during the late nineteenth century. At the time (1900 to 1925), Malang had the fastest growing population in the Dutch East Indies. The city expanded mainly towards the North to accommodate this growth (van Roosmalen, 2000).
Beginning with a draft plan made in 1929, the Malang city council drew up a detailed plan in 1933. Karsten created an overview, city plan, and land map designs. This city plan provides detailed information on existing and future land use zoning, building types, roads, railway routes, trams, water pipes, public parks, and cemeteries shown in the city master plan (Figure 4).
(Yellow: industry; Blue: public housing; Red: villa construction (private exploitation is shaded); Green: sports fields and airport) and main roads diagram (Left: situation before 1929; Right: design from the supplemented overview plan of 1935) Design: Ir H.Th. Karsten (van Roosmalen, 2000).
In subsequent developments, the 1937 Malang city master plan (Figure 5) was relatively complete in meeting the city's needs at that time. It is proven that Malang has a high historical value regarding urban planning, supported by documents from various stages of colonial city development. Calculations can be made on LUZ in the office, trade, and residential zones based on this map.
Zoning System of Melaka City, Malaysia
Melaka was dubbed the historical city of Malaysia and a UNESCO World Heritage site in 2008. It is among the smallest of the 14 states in Malaysia. In the 16th Century, the city of Melaka was a prominent trading centre visited by traders from all over East-West Asia, Europe, India, and China, plying trade routes between the Indian Ocean and the South China Sea.
The city has a strategic location in Peninsular Malaysia and the Straits of Malacca (Krishnan, Sandhu et al., 2014). In the late 14th Century, Malacca was a fishing village. In 1511, the Portuguese occupied Melaka, while the Dutch occupied it for 150 years starting in 1641. The British took control in 1867. In the 21st Century, Malaysia gained independence, and Malacca became a tourist destination (Ngah, Chau et al., 2019).
This area is named the World Heritage Site of Melaka (Figure 6). This area is divided into three zones: the main and buffer zones and the village heritage area (See Figure 9) (Rahman, Ismail et al., 2011). This area is designated as a UNESCO World Heritage site, so Melaka is deemed suitable as a study area for calculating land use by considering the connectivity in the three zones.
Specifically, the historical city of Melaka is located near a river with gentle natural characteristics and hilly agricultural/plantation land. The city structure follows the characteristics of a natural landscape. It is easy to get water supplies; rivers and oceans support transportation routes because Melaka is close to the river (Figure 7).
The benefits of the river are essential for the city of Melaka as it facilitates the distribution of goods and transportation of people, enhancing economic growth (Ibrahim, Abdullah et al., 2018). The government controls the sultanate of Melaka and the community's social, economic, and cultural development.
Table 1.
Urban form elements and the characteristics of Melaka City during the Melaka Sultanate
| No
|
Urban Form
|
Characteristics of the Area
|
| 1 |
Streets |
Linear; road and river
Melaka river as an essential transportation
|
| 2 |
Land Use |
Clustered settlements in the coastal area.
Gardens, orchards, and farms among the land use types Market on the bridge, along the streets and near the beach
|
| 3 |
Buildings |
Walled palace
Port near the river.
Mosque near the palace
|
| 4 |
Open Space |
Orchard and graveyards near the river |
Zoning System of Kanazawa City, Japan
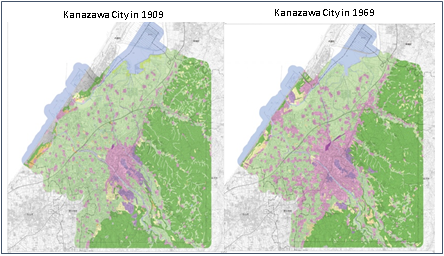
Kanazawa City is located in the capital city of Ishikawa Prefecture in the Hokuriku region. The Sea of Japan borders the city on the North Side. Kanazawa City has two rivers that are icons of the city, namely Saigawa and Asanogawa. The city's eastern part is mountainous, bordering the Hakusan National Park. The total area of Kanazawa city is 468.64 square kilometres. During the Maeda family period, the family's financial strength based on the rice harvest was invested in promoting culture and learning. Kanazawa city is a cultural city featuring traditional activities in gold handicrafts, tea ceremonies, and gastronomic culture. These cultures and activities trickled down to the present (Mc Clain, 1980).
Furthermore, during the Japanese modernisation period (Meiji period) from 1868, the city of Kanazawa began to lag in the industrial sector, similar to what was happening in other cities, such as Tokyo, Osaka, and Nagoya. So, there was a change from a leading big city in Japan to a base city in the Hokuriku district. Nevertheless, Kanazawa escaped the devastation that occurred during World War II.
Historic buildings and roads coexisted with modern development zones in the city area (Mammadova, 2017; Mammadova and Ivars, 2018). The Japanese government published land use maps in 1900 and 1960 showing developments paddy, dry crop fields or grassland, orchard, trees, wasteland, settlement and urban areas, transportation yards, and other zones. The document was adopted from the National Land Information Division, National Spatial Planning and Regional Policy Bureau (Figure 8).


The master plan in Japan uses 12 (twelve) LUZ categories that provide zoning of land use patterns in each type of urban area. LUZ in Japan can generally be categorised into residential, commercial and industrial use. Each LUZ has specifications regarding the use of buildings built in the zone (Ministry of Land, Infrastructure and Transport, 2003). In this study, connectivity calculations will be carried out in areas with historical value in the office, trade, and residential zones. Based on the development conditions of Kanazawa, which has a high historical value and coexists with modern development, it is very appropriate to choose this city as the study subject. This study assesses areas with historical value and focuses on office, trade, and residential zones. The land-use document was obtained from the National Land Information Division, National Spatial Planning and Regional Policy Bureau website, which was then adjusted by layering with a GIS map from sheet code A44-18. (Figure 9 and Figure 10).
The approach will calculate the connectivity, depth, visibility, and mobility in the master plans of Malang, Kanazawa, and Melaka cities. Malang city is known to have been planned by Herman Thomas Karsten (Bogaers and Ruijter, 1983). The selection of Kanazawa and Melaka is made considering that these two cities have similar conditions to three cities in Indonesia with historical value. Kanazawa and Melaka are known to have led to the development of culture and education in their respective countries. Previous research conducted using Justified Graphs to calculate Javanese house depth and colonial city patterns in Indonesia was the basis for developing this study (Bonifacius, Tutuko et al., 2021; Tutuko, Pindo, Bonifacius et al., 2021a; Tutuko, Pindo, Bonifacius et al., 2019; Tutuko, P and Shen, 2014). Significant similarities were found in the master plans of cities in Indonesia and parent cities. From the point of view of the similarity ratio, the Depth and Connectivity are two attributes responsible for the similarity between Indonesian colonial cities and those in the Netherlands (though they are apparently physically different) because this study focused specifically on the Justified Graphs (Bonifacius, Tutuko et al., 2021; Tutuko, Pindo, Bonifacius et al., 2021a; Tutuko, Pindo, Bonifacius et al., 2019). Furthermore, to add to the knowledge of space syntax in developing urban patterns towards a sustainable urban form, a study was conducted on the land use zoning of a city with specific historical values. The CBD zone is selected to compare land-use zoning and spatial configuration in cities with historical and cultural values, such as Malang, Kanazawa, and Melaka cities.
Axial Integration Analysis
This research was conducted to analyse the axial line, the longest line of sight showing the movement path in a given space in the built environment. In urban studies, each axial line represents urban public spaces connected to other urban spaces (Yamu, Van Nes et al., 2021). The first step is to calculate the imported map from DXF format into DepthMapX to produce an axial map. The built environment axial map is a collection of the longest and fewest axial lines. Axial maps can have different resolutions: low, medium or high. The low-resolution or strategic model includes only the main relationships between aspects of the built environment. The medium resolution model is a more pragmatic extension of the relationship between built-up and non-built-up features (Figure 11). High-resolution models, or pedestrian models, involve the study of the proper pedestrian movement path (Yamu, Van Nes et al., 2021). This research uses a low-resolution model.

Calculations related to connectivity to existing spaces within the city are also performed, limited to historical areas only. Connectivity measures the static locale and describes the number of connections of each road to immediately neighbouring streets. So, it can be interpreted that a road with many connections on its side will have a high connectivity value (Yamu, Van Nes et al., 2021). Furthermore, it is necessary to calculate the axial integration to determine the extent of the connection between the road and other roads already connected with it. Axial integration (HH) is a measure that considers motion and estimates the degree of accessibility of a road with all other roads in the urban system, taking into account the total number of directional changes (syntactic steps) of the urban entity (Hillier and Hanson, 1984; Yamu, Van Nes et al., 2021).
In this case, axial integration is closely related to connectivity. Fewer changes in the direction of a particular road to all other roads in the system correlate with higher integration. So, a longer axial line in an urban area correlates with higher connectivity to additional lines and higher integration value. Another calculated attribute is Depth (D), where the depth of a node represents the number of edges in the path from the root node to the selected node. The path with a high number of nodes from the root node to the end node is topologically deep, whereas the path with a low number of nodes is topologically shallow.
Each area has a Total Depth (TD). The TD is determined by the space that must be traversed from the selected starting point. When combined with the actual shape of the system itself, the depth value provides essential information for interpreting and analysing urban space. Shallow systems have low total depth values, while deep systems have higher values (Yamu, Van Nes et al., 2021). Integration (HH) is the normalised version of Mean Visual Depth between the zero-infinity range. A high value indicates a highly integrated space, and a low value indicates a separate space (Hillier and Hanson, 1984). DepthMapX determines Integration (HH) by normalising the average visual depth at point “V” in the plan using “d-value”, whereas “k” is the number of axes/nodes in the system. Integration (HH) is expressed as:

|
(1) |

|
(2) |
After calculating integration (HH) and Connectivity, a comparison is made using these metrics on the main road in the CBD zone. The comparison results will be analysed by describing each result in the three cities. Then connectivity and integration weights for roads in the CBD are calculated for each city.
Results and Discussion
Results
The results of this study were generated using the DepthMapX software version 0.8. The locations chosen for this study were determined by the criteria that the locations have historical value; hence Malang, Melaka, and Kanazawa were selected. The map was measured using run graph analysis to derive the connectivity, line length, integration, mean depth, and node count values, which make up the All-line Map. The all-line map consists of an axial line that connects the pattern of streets and spaces in a city. The all-line map is then processed using a fewest-line map operation to simplify the calculation and display a more detailed axial map represented by fewer lines.
The calculated portion of the CBD area is determined based on the LUZ document of each city. The calculated CBD area in Malang is along Basuki Rahmat Street or Kayutangan. A Dutch colonial icon, this area is an office and trade area. The chosen CBD area in Melaka city is along the Cheng Ho Museum Road, opposite the Red Building. This area is in the heart of Melaka city, built during the Dutch colonial period. This building was used as an administrative office by the Dutch governor. The calculated CBD area in Kanazawa city is along Kohrinbo and Hirosaka roads, a CBD area close to Kanazawa Castle and government buildings. Along the road, some shops and offices highlight the city's development.
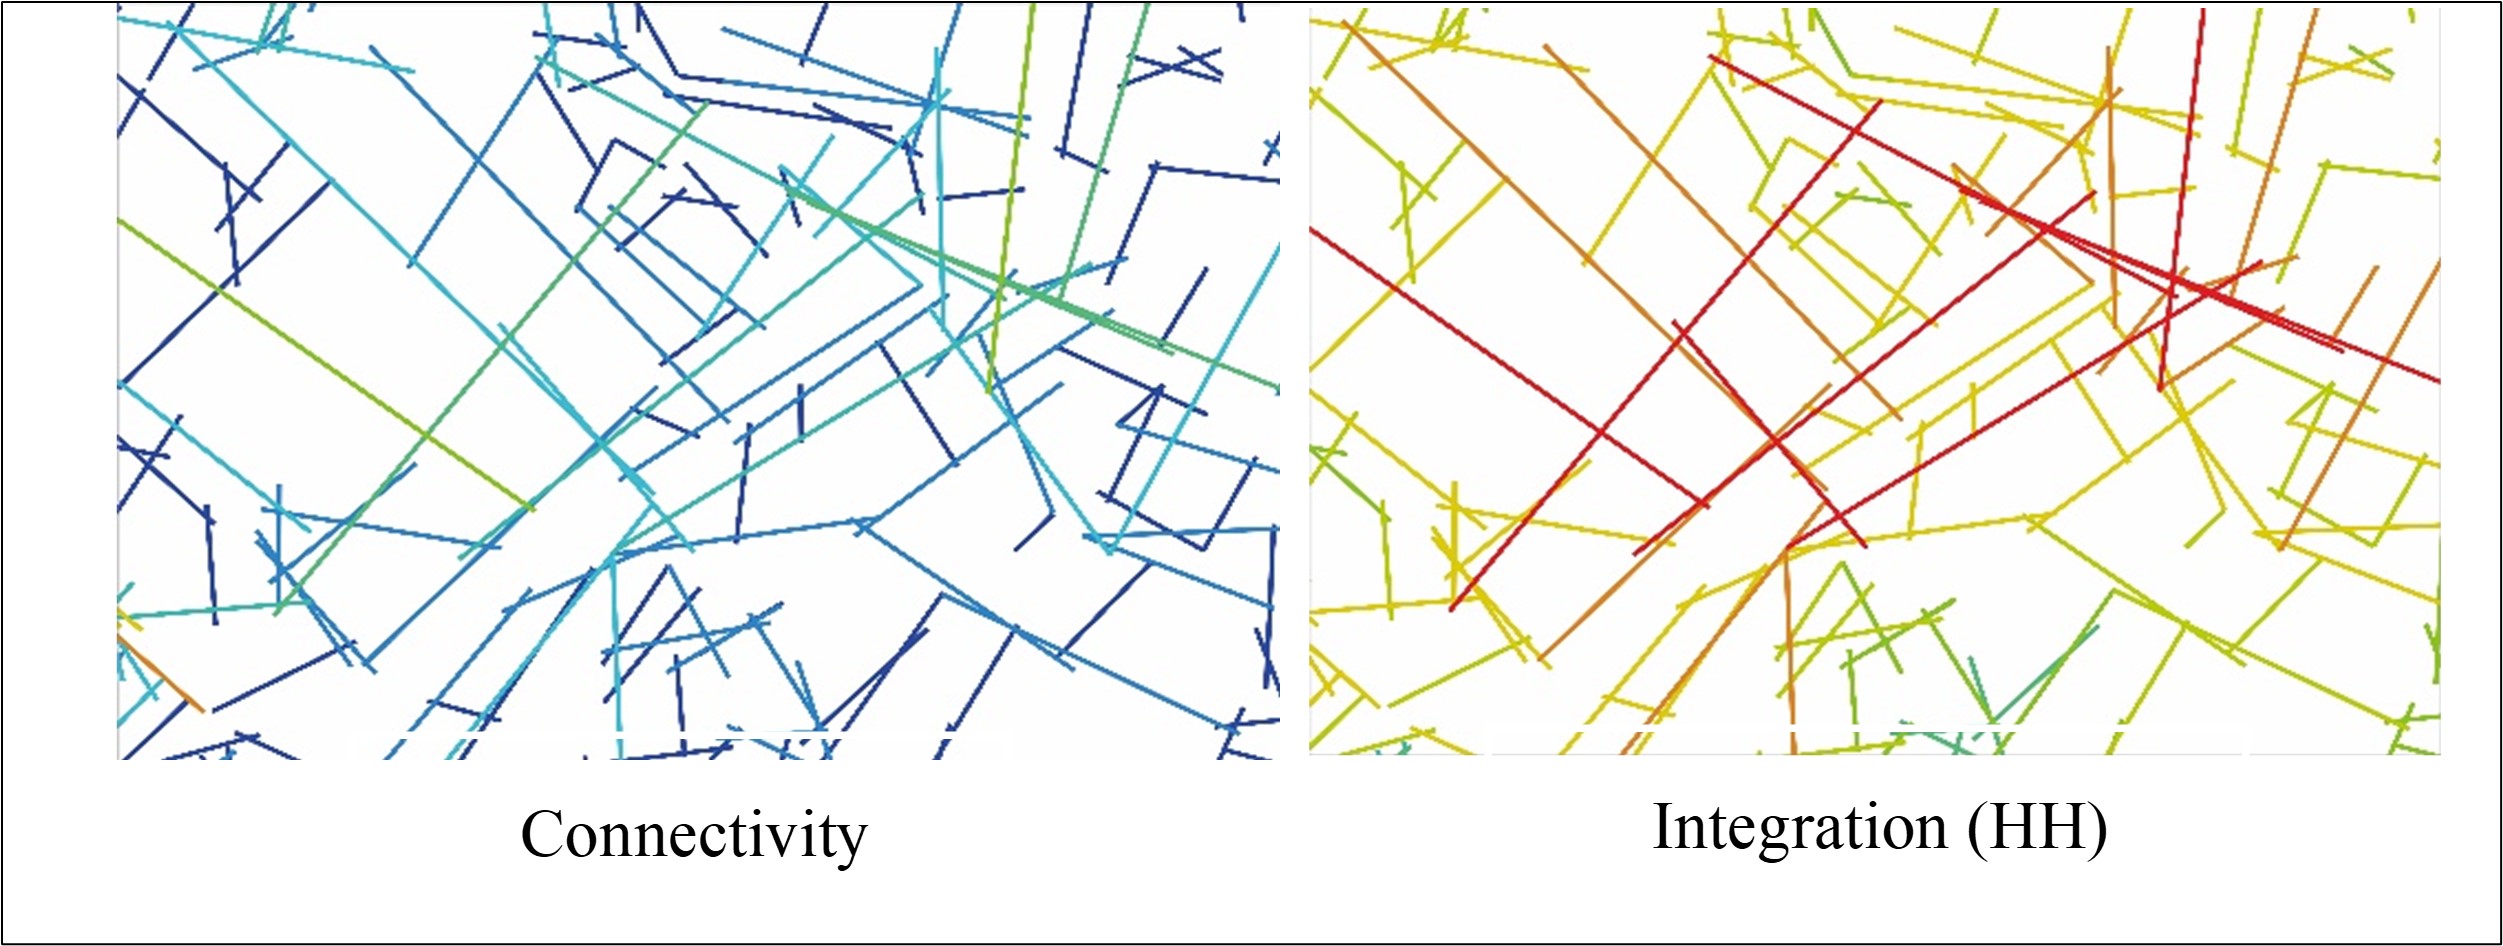
The calculation steps begin by changing the imported map from DXF to an axial map to perform graph analysis. Graph analysis is needed to convert vectors to be calculated using graph calculations. After obtaining the axial map, the axial lines are obtained on each map. In the axial map, connectivity is obtained from each map, representing the roads and intersections on the map. The next step is to reduce the axial lines to a fewest-line map (minimum) to make it easy to perform calculations. Next, an axial map analysis operation was performed to determine the integration, total depth, mean depth, Real Asymmetry (RA), Real Relative Asymmetry, RRA, and integration (HH). The results of the axial map that show the degree of value are indicated by colour. The value on the line indicates that the closer it goes to red, the line’s colour moves away from blue (Figure 11, Figure 12, and Figure 13).

Table 2.
The results of the calculation of the axial map analysis in Malang, Melaka, and Kanazawa
| No
|
Cities
|
Connectivity
|
Integration (HH)
|
Mean Depth
|
CBD Connectivity
|
CBD Integration
|
Connectivity Ratio on CBD
|
Integration Ratio on CBD
|
| 1 |
Malang |
36 |
2,11 |
16,72 |
12 |
1,41 |
0,33 |
0,67 |
| 2 |
Melaka |
36 |
1,48 |
17,16 |
16 |
1,40 |
0,44 |
0,95 |
| 3 |
Kanazawa |
53 |
3,49 |
23,12 |
24 |
1,85 |
0,45 |
0,53 |
Connectivity and integration are interrelated, so if connectivity is high, the value of integration is also high. Table 2 shows that Kanazawa has high connectivity and integration (HH) (53.00 and 3.49, respectively). Meanwhile, Malang and Melaka are relatively similar at 36, with Malang higher on Integration (HH) (2,11). The highest connectivity in the CBD zone is also found in Kanazawa (24), and the lowest is Malang (12). Kanazawa also has the highest increase in integration (3,49), while Melaka has the lowest (1,48).
Meanwhile, the highest Connectivity Ratio on CBD is Kanazawa (1,85), and the lowest is Malang (0,33), but the highest Integration Ratio on CBD is Melaka (0,95), and the lowest is Kanazawa (0,53). The data shows that the ratio of connectivity and integration in the CBD area cannot be the same as the actual equation of connectivity and integration values, as this is influenced by the location where the zone is placed on the axial line to the total of the entire axial map. A correlation measure is carried out between the line length of all cities and the value of connectivity to comprehensively calculate the historical areas in the three cities. Values of correlation coefficient (R2) close to 1.0 indicate a higher correlation of these lines. The scatter chart is needed to determine the integration and trend between line length and connectivity in the three cities.
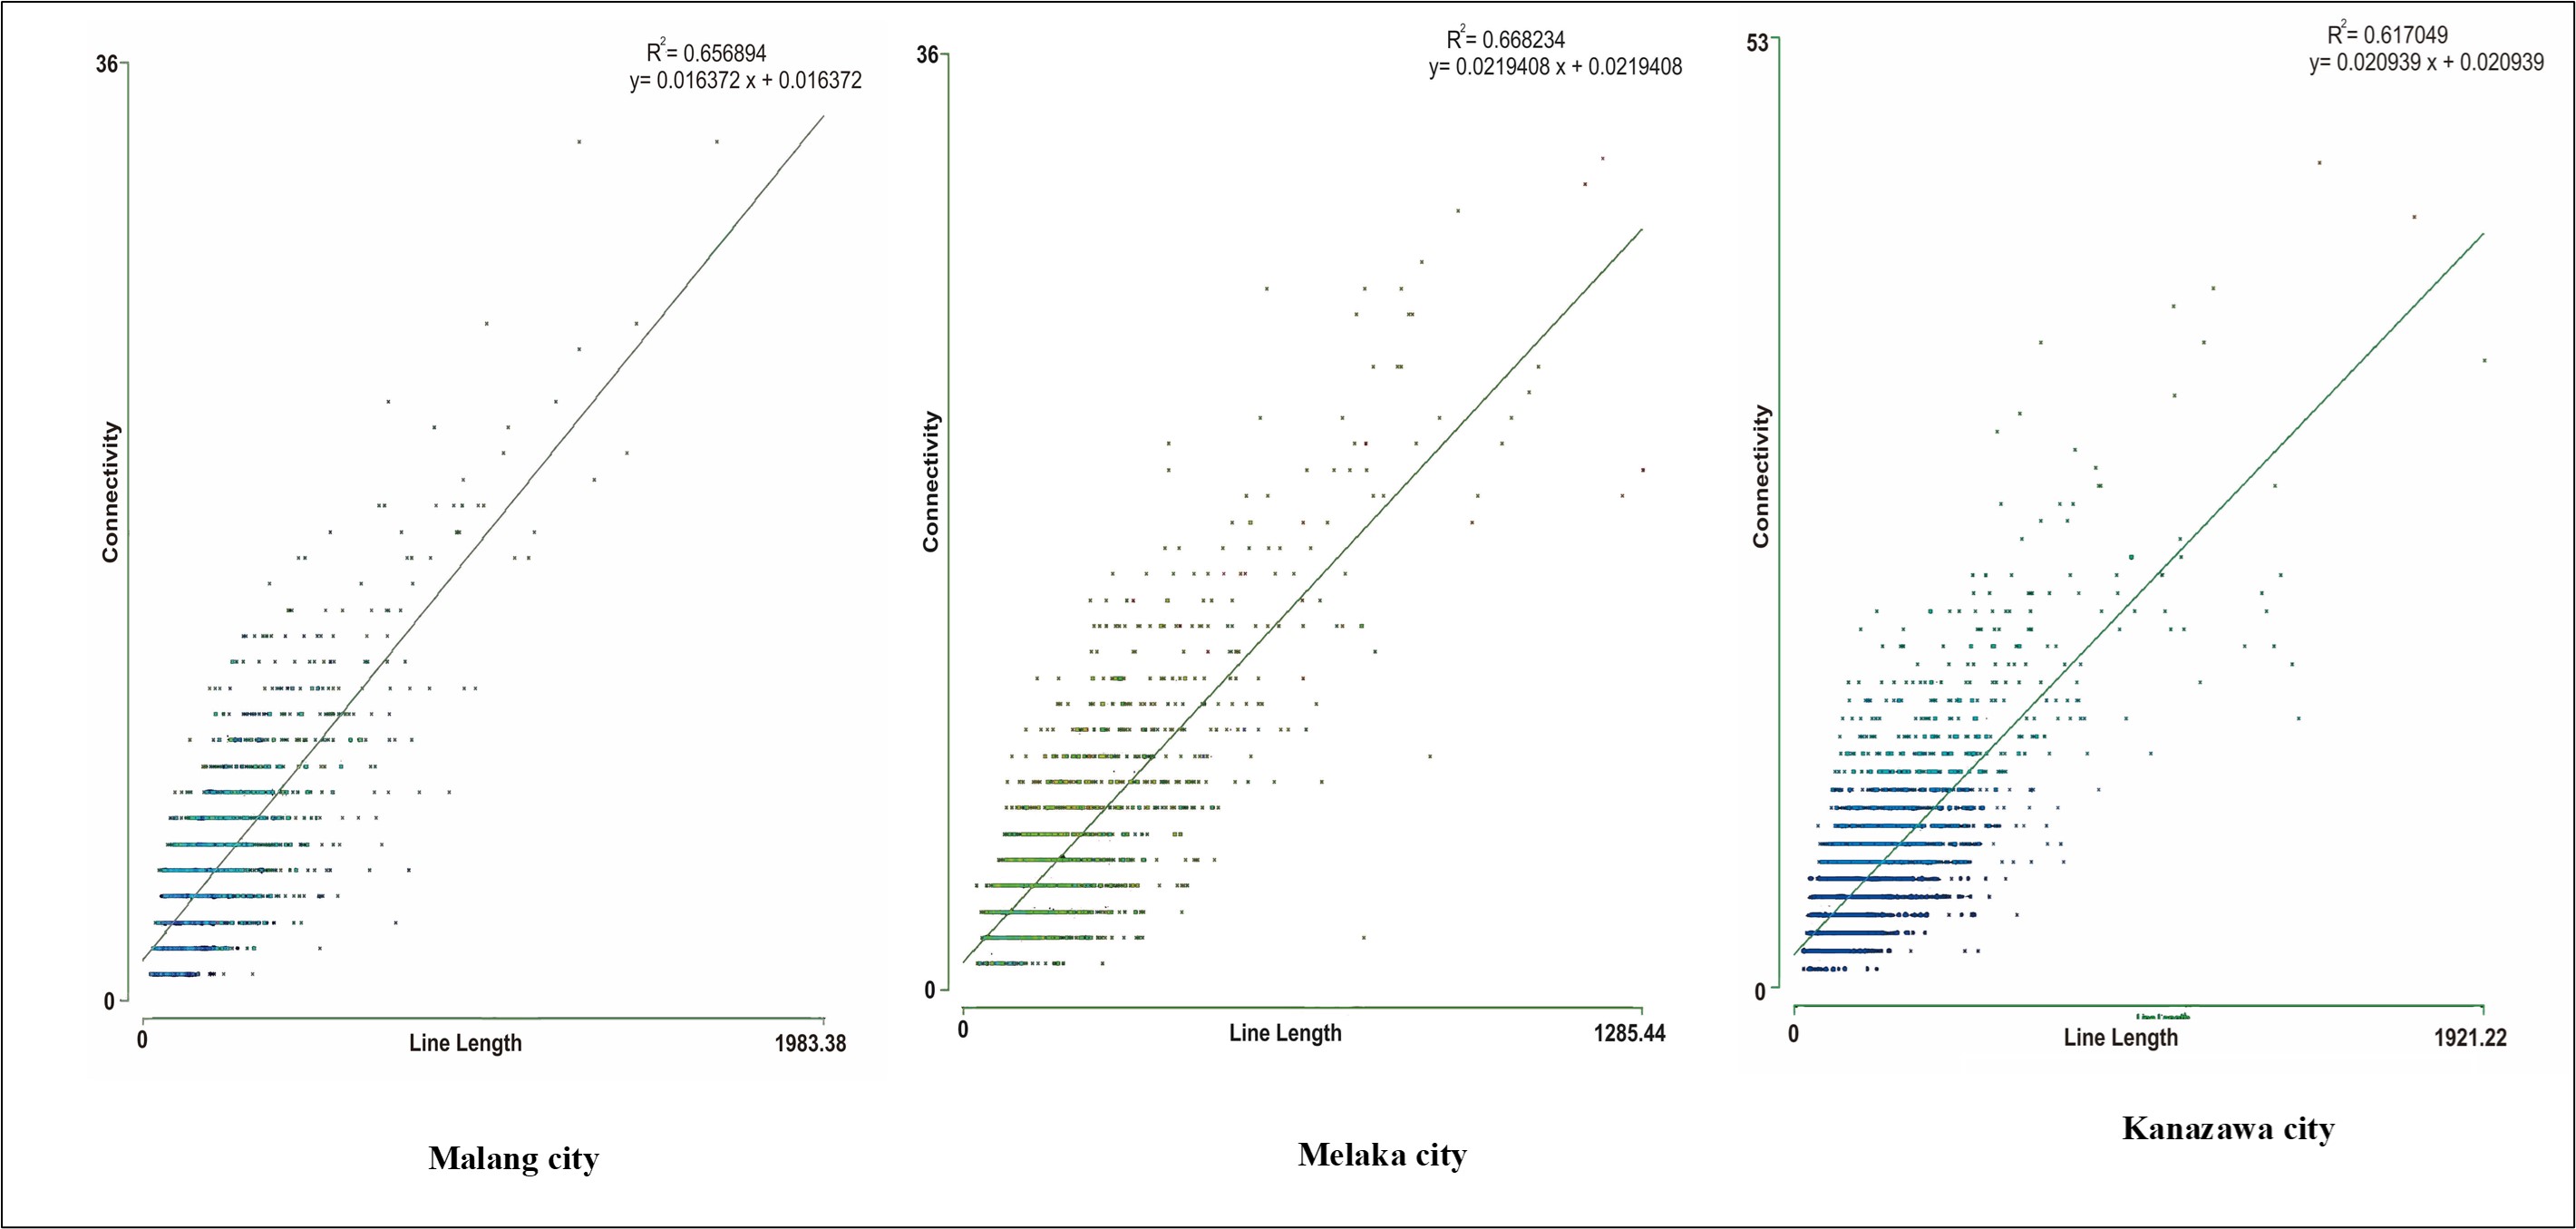
There are similarities based on the Correlation coefficient (R2) scatter chart. The value of R2 is high, meaning that very few factors outside of connectivity affect road patterns in the three cities—the closer to 1.0, the better. R2 is the highest for Melaka (0,668234), followed by Malang (0,656894) and Kanazawa (0,617049). The data shows that Melaka correlates on-road distance and road structure connectivity well.
Discussion
The CBD area measured in Malang comprises office centres, hotels, and shops. The site is in the heart of Malang city. Karsten's design of Malang indicated that all zones, especially settlements in the West and East, moved towards the centre to carry out urban activities for city residents. Hence, the zone had the highest value on the axis line in Kayutangan (Figure 16). The integration is very strong on the Kayutangan road because it is connected with road lines from the west and east. This line integration causes the segment's integration value (HH) to be high.

The CBD area of the historical city of Melaka is the most famous pedestrian area around Jonker Walk, which includes Jonker and Heeren Streets across the Melaka River near Red Square. Moreover, there are many cafes, restaurants, and exciting souvenir shops. This building still demonstrates the Dutch colonial style. This zone also has extensive connectivity and integration because the roads leading to the CBD zone are interconnected (Figure 17).
The CBD area in Kanazawa is close to what was the Japanese Samurai settlement during the Edo period, namely the Nagamachi Bukeyashiki area. This area is located at the foot of the building that was once the castle of Kanazawa. The streets in the Kohrinbo and Hirosaka areas are bound mainly by offices and shops, restaurants and cafes. This area is the busiest line of Kanazawa. Almost every bus line passes through this area. The map shows that connectivity and integration in the area are very high as it plays the role of collector of transportation modes in Kanazawa city (Figure 18).

From the study, we can see that the theory of natural movement helps us understand how cities are constructed spatially (Boutabba and Farhi, 2011; Hillier, 2007). The road network connects urban centres at all scales. This spatial structure is indicated by the main routes with a high movement level. A network of notable routes traverses between neighbourhoods forming a city network. The network makes access from the suburbs to the centre efficient and possible. Cities with historical value have a network of backgrounds for residential areas, generated by and reflecting cultural patterns. City networks are shaped mainly by how different cultures influence urban space in the metric and geometric nature of the network. In the CBD area, the network is more substantial and different in residential areas with a localised structure (Yamu, Van Nes et al., 2021).
CBD areas tend to have longer and more roads that connect to other roads. The main routes at all scales consist of a set of longer connected paths (Hillier, 2007; Yamu, Van Nes et al., 2021). The CBD, as the centre of the city's economic development, plays an important role. Simultaneously, road connectivity and integration are also critical. The movement theory of financial processes explains and predicts economic effects and movement flows based on the spatial configuration of networks (Yamu, Van Nes et al., 2021). The formation of the city centre works through the spatial configuration of the road network. Regarding road networks, spatial syntax methods can describe spatial properties and help explain the spatial features of various histories and cultures.
Conclusion
This work aims to calculate the central business district (CBD) zone with historical value. The study explains the conceptual framework and methodological and theoretical bases for studying the built environment through space syntax analysis. As the embodiment of a sustainable city, the context of the city's historical value plays a critical role in enabling connectivity and integration. Thus, understanding the relationship between urban cohesiveness and sustainability is needed. The spatial syntactic analysis of a city depends on the spatial character of the topology of the urban environment.
The CBD area is a zone with high connectivity and integration. Both aspects are indicated by the density of buildings and mixed land use. The relationship between LUZ and transport is a key requirement for a sustainable city. Interventions in the mobility network can affect socio-economic life in urban areas, especially in cities that have historical value, such as Malang, Melaka, and Kanazawa.
The limitation of this research is its limited CBD zone. Several other zones like housing and urban settlements can be studied. This study can be extended by evaluating residential areas that also contribute to city development. This study is expected to facilitate urban planners and city policymakers in maintaining the sustainability of cities with historical value.
Author Contributions
Conceptualization, P.T.; methodology, P.T. and N.A.; software, P.T. and N.B.; investigation, N.B. and N.A.; resources, Z.S., E.B.M. and Y.Y.; data curation, D.Y.; writing—original draft preparation, P.T., D.Y. and N.A.; writing—review and editing, P.T., D.Y. and N.A.; supervision, P.T.
All authors have read and agreed to the published version of the manuscript.
Ethics Declaration
The authors declare that they have no conflicts of interest regarding the publication of the paper.
Acknowledgement
We acknowledge the contribution of The Ministry of Education and Culture-Ristek-Dikti, the Republic of Indonesia, for funding this study and providing the opportunity to conduct research. We want to thank members of the Laboratory of Urban and Human Settlements - Department of Architecture, Faculty of Engineering, University of Merdeka Malang, and individuals who assisted with the Housing and Human Settlement project, specifically by providing supporting data.
Funding
This research was funded by The Ministry of Education and Culture-Ristek-Dikti, the Republic of Indonesia (No. 1867/E4/AK.04/2021).
References
- Agirbas, A. (2020). "Characteristics of Social Formations and Space Syntax Application to Quantify Spatial Configurations of Urban Regeneration in Levent, Istanbul". Journal of Housing the Built Environment, 35(1), 171-189. doi: https://doi.org/10.1007/s10901-019-09671-1.
- Agrawal , S. K. (2010). "Design Review in a Post-Colonial City: The Delhi Urban Art Commission". Cities, 27(5), 397-404. doi: https://doi.org/10.1016/j.cities.2010.01.004.
- Aguilar , A. G. and Santos, C. (2011). "Informal Settlements’ Needs and Environmental Conservation in Mexico City: An Unsolved Challenge for Land-Use Policy". Land Use Policy, 28(4), 649-662. doi: https://doi.org/10.1016/j.landusepol.2010.11.002.
- Ahmadzai, F. (2020). "Analyses and Modeling of Urban Land Use and Road Network Interactions Using Spatial-Based Disaggregate Accessibility to Land Use". Journal of Urban Management, 9(3), 298-315. doi: https://doi.org/10.1016/j.jum.2020.06.003.
- Batty, M. (2004). A New Theoryof Space Syntax. (Vol. 03/04 No. 75). CASA, Working Paper Series, London.
- Bogaers, E. and Ruijter, P. (1983). Ir. Thomas Karsten En De Stedebouw in Nederlands-Indië 1915-1940. Universiteit van Amsterdam (UvA), Planologisch en Demografisch Instituut.
- Bonifacius, N., Tutuko, P., et al. (2021). "Study on the Deviation and Ratio of Spatial Arrangement Patterns in Housing and City Development to Achieve Sustainable Urban Form in Indonesia: Introduction of Observations and Calculations by Space Syntax". Proceedings of IOP Conference Series: Earth and Environmental Science, IOP Publishing 012049.doi: https://doi.org/10.1088/1755-1315/780/1/012049.
- Boutabba, H. and Farhi, A. (2011). "Syntactic Analysis and Identification of the Social Properties in Spatial Arrangements of Buildings: The Case of the Houses Called Diar Charpenti in Eastern Hodna, Algeria". Theoretical and Empirical Researches in Urban Management, 6(4), 78-92.
- Can, I. and Heath, T. (2016). "In-between Spaces and Social Interaction: A Morphological Analysis of Izmir Using Space Syntax". Journal of Housing the Built Environment, 31(1), 31-49. doi: https://doi.org/10.1007/s10901-015-9442-9.
- Conroy-Dalton, R. and Dalton, N. (2007). "Applying Depth Decay Functions to Space Syntax Network Graphs". Proceedings of 6th International Space Syntax Symposium, 1-14. Retrieved from http://eprints.ucl.ac.uk/1113/1/1113.pdf.
- Conroy-Dalton, R., Hölscher, C., et al. (2005). "Space Syntax and Spatial Cognition". World Architecture, 11(2005), 107-111.
- Coté, J. (2014). "Thomas Karsten’s Indonesia: Modernity and the End of Europe, 1914–1945". Bijdragen tot de taal-, land-en volkenkunde/Journal of the Humanities Social Sciences of Southeast Asia, 170(1), 66-98.
- Daunt , A. B. P., Inostroza, L., et al. (2021). "The Role of Spatial Planning in Land Change: An Assessment of Urban Planning and Nature Conservation Efficiency at the Southeastern Coast of Brazil". Land Use Policy, 111, 105771. doi: https://doi.org/10.1016/j.landusepol.2021.105771.
- Dawson , P. C. (2002). "Space Syntax Analysis of Central Inuit Snow Houses". Journal of Anthropological Archaeology, 21(4), 464-480.
- Eldiasty, A., Hegazi , Y. S., et al. (2021). "Using Space Syntax and Topsis to Evaluate the Conservation of Urban Heritage Sites for Possible Unesco Listing the Case Study of the Historic Centre of Rosetta, Egypt". Ain Shams Engineering Journal, 12(4), 4233-4245. doi: https://doi.org/10.1016/j.asej.2021.04.017.
- Gennaio, M.-P., Hersperger , A. M., et al. (2009). "Containing Urban Sprawl—Evaluating Effectiveness of Urban Growth Boundaries Set by the Swiss Land Use Plan". Land Use Policy, 26(2), 224-232. doi: https://doi.org/10.1016/j.landusepol.2008.02.010.
- Gibbins, C. (2001). "Saving a Place: Endangered Species in the 21st Century: J.A. Baden, P. Geddes (Eds.), Ashgate, Aldershot, 2000, 272pp, Price £49.95". Land Use Policy, 18(2), 201-202. doi: https://doi.org/10.1016/S0264-8377(01)00013-8.
- Hadinoto. (1996). "Perkembangan Kota Malang Pada Jaman Kolonial (1914-1940) (the Development of Malang City in the Colonial Period (1914-1940))". DIMENSI (Journal of Architecture and Built Environment), 22, 1-29.
- He, Z., Ling, Y., et al. (2022). "Does Zoning Contain Built-up Land Expansion? Causal Evidence from Zhangzhou City, China". Landscape and Urban Planning, 220, 104339. doi: https://doi.org/10.1016/j.landurbplan.2021.104339.
- Hillier, B. (2007). Space Is the Machine: A Configurational Theory of Architecture. Space Syntax, London.
- Hillier, B. and Hanson, J. (1984). The Social Logic of Space. Cambridge University Press, Cambridge. doi: https://doi.org/10.1017/CBO9780511597237.
- Ibrahim, I., Abdullah, A., et al. (2018). "Historical Urban Form: A Case Study of Melaka". PLANNING MALAYSIA, 16. doi: https://doi.org/10.21837/pmjournal.v16.i6.470.
- Jawatan kuasa Teknikal Standard MyGDI (JTSM). (2011). "Kod Dan Nama Sempadan Pentadbiran Tanah ( Unique Parcel Identifier - Upi )". Kuala Lumpur.
- Karimi, K. (2018). "Space Syntax: Consolidation and Transformation of an Urban Research Field". Journal of Urban Design, 23(1), 1-4. doi: https://doi.org/10.1080/13574809.2018.1403177.
- Krishnan, G., Sandhu , S. C., et al. (2014). "Green City Action Plan: A Framework for Greeen Actions Melaka, Malaysia". Asian Development Bank. on
- Law, S., Chiaradia, A., et al. (2012). "Towards a Multimodal Space Syntax Analysis: A Case Study of the London Street and Underground Network". Proceedings of the 8th International Space Syntax Symposium, Santiago de Chile, 1-20.doi: https://doi.org/10.1016/j.progress.2007.03.001.
- Lestrelin, G. (2010). "Land Degradation in the Lao Pdr: Discourses and Policy". Land Use Policy, 27(2), 424-439. doi: https://doi.org/10.1016/j.landusepol.2009.06.005.
- Mammadova, A. (2017). "Sustainability Lessons from Kanazawa City, Japan". European Journal of Sustainable Development, 6(2), 233-233. doi: https://doi.org/10.14207/ejsd.2017.v6n2p233.
- Mammadova, A. and Ivars , J. P. (2018). "Learning and Experiencing Traditional Culture and Nature of Kanazawa City to Achieve Sustainable Development Goals". European Journal of Sustainable Development, 7(3), 323-323. doi: https://doi.org/10.14207/ejsd.2018.v7n3p323.
- Mark , J. H. and Goldberg , M. A. (1986). "A Study of the Impacts of Zoning on Housing Values over Time". Journal of Urban Economics, 20(3), 257-273. doi: https://doi.org/10.1016/0094-1190(86)90019-7.
- Mc Clain , J. L. (1980). "Castle Towns and Daimyo Authority: Kanazawa in the Years 1583-1630". Journal of Japanese Studies, 6(2), 267-299. doi: https://doi.org/10.2307/132323.
- Ministry of Land, Infrastructure and Transport. (2003). "Introduction of Urban Land Use Planning System in Japan". Tokyo: City Planning Division, City and Regional Development Bureau, Ministry of Land, Infrastructure and Transport. on
- Nellis, L. and Maca , M. N. (1986). "The Effectiveness of Zoning for Agricultural Lands Protection: A Case Study from Cache County, Utah". Landscape urban planning, 13, 45-54. doi: https://doi.org/10.1016/0169-2046(86)90006-X.
- Ngah, I., Chau , L. W., et al. (2019). "Reliving the Glory–Repositioning Melaka as City-State: The Urban Planning Perspective". Universiti Teknologi Malaysia, Johor Baru.
- Önder , D. E. and Gigi, Y. (2010). "Reading Urban Spaces by the Space-Syntax Method: A Proposal for the South Haliç Region". Cities, 27(4), 260-271. doi: https://doi.org/10.1016/j.cities.2009.12.006.
- Penn, A. (2001). "Space Syntax and Spatial Cognition: Or Why the Axial Line?". Proceedings of 3rd International Space Syntax Symposium, Atlanta, 11.11-11.17.
- Penn, A., Hillier, B., et al. (1998). "Configurational Modelling of Urban Movement Networks". Environment Planning B: planning design, 25(1), 59-84. doi: https://doi.org/10.1068/b250059.
- Poelmans, L. and Van Rompaey, A. (2009). "Detecting and Modelling Spatial Patterns of Urban Sprawl in Highly Fragmented Areas: A Case Study in the Flanders–Brussels Region". Landscape urban planning, 93(1), 10-19. doi: https://doi.org/10.1016/j.landurbplan.2009.05.018.
- Prasertsubpakij, D. and Nitivattananon, V. (2012). "Evaluating Accessibility to Bangkok Metro Systems Using Multi-Dimensional Criteria across User Groups". IATSS research, 36(1), 56-65. doi: https://doi.org/10.1016/j.iatssr.2012.02.003.
- Rahman , J. I., Ismail , H. N., et al. (2011). "Inquiry into Tourists’ Movement Flow Pattern in the Melaka World Heritage Site: A Space Syntactic Analysis". Proceedings of the 11th International Congress of Asian Planning Schools Association, Tokyo, University of Tokyo 1475-1485.
- Renne , J. L. and Listokin, D. (2021). "Transit-Oriented Development and Historic Preservation across the United States: A Geospatial Analysis". Transportation Research Interdisciplinary Perspectives, 10, 100373. doi: https://doi.org/10.1016/j.trip.2021.100373.
- Rodríguez-Alegría, E., Millhauser , J. K., et al. (2013). "Trade, Tribute, and Neutron Activation: The Colonial Political Economy of Xaltocan, Mexico". Journal of Anthropological Archaeology, 32(4), 397-414. doi: https://doi.org/https://doi.org/10.1016/j.jaa.2013.07.001.
- Saint-Macary, C., Keil, A., et al. (2010). "Land Titling Policy and Soil Conservation in the Northern Uplands of Vietnam". Land Use Policy, 27(2), 617-627. doi: https://doi.org/10.1016/j.landusepol.2009.08.004.
- Shahraki , S. Z., Sauri, D., et al. (2011). "Urban Sprawl Pattern and Land-Use Change Detection in Yazd, Iran". Habitat International, 35(4), 521-528. doi: https://doi.org/10.1016/j.habitatint.2011.02.004.
- Subadyo , A. T., Tutuko, P., et al. (2018). "Assessment of Inclusive Historical Public Spaces in Achieving Preservation of Such Areas in Malang, Indonesia Case Study: Public Spaces Developed During the Dutch Colonial Period". International Review for Spatial Planning Sustainable Development, 6(4), 76-92. doi: https://doi.org/10.14246/irspsd.6.4_76.
- Sullivan , A. M. (1984). "Land Use and Zoning in the Central Business District". Regional Science Urban Economics, 14(4), 521-532. doi: https://doi.org/10.1016/0166-0462(84)90030-9.
- Tse , R. Y. C. (2001). "Impact of Comprehensive Development Zoning on Real Estate Development in Hong Kong". Land Use Policy, 18(4), 321-328. doi: https://doi.org/10.1016/S0264-8377(01)00025-4.
- Tutuko, P., Bonifacius, N., et al. (2021a). "Measuring Spatial Arrangement of Indonesian Colonial Cities Using Depth and Connectivity Calculations: Ratio Study on Master Plans Using Space Syntax". International Review for Spatial Planning and Sustainable Development, 9(4), 67-81. doi: https://doi.org/10.14246/irspsd.9.4_67.
- Tutuko, P., Bonifacius, N., et al. (2021b). "The Spatial Pattern of a Kampong Area in Malang City Using a Space Syntax Approach Study on Depth Calculation and Connectivity Using Depthmapx". International Review for Spatial Planning Sustainable Development, 9(4), 102-115. doi: https://doi.org/10.14246/irspsd.9.4_102.
- Tutuko, P., Bonifacius, N., et al. (2019). "Tracing the City Pattern of Netherlands and Indonesia Using Depth Calculation and Connectivity". Journal of Physics: Conference Series, 1167(1), 012012. doi: https://doi.org/10.1088/1742-6596/1167/1/012012.
- Tutuko, P. and Shen, Z. (2014). "The Spatial Arrangement of House to Achieving Sustainable Urban Form Case Study: Residential Area Along the Fort of Yogyakarta Palace, Indonesia". Proceedings of International Symposium on Regional Sustainable Development, UNMER Press 215-228.
- Tutuko, P. and Shen, Z. (2016). "The Effect of Land Use Zonings on Housing Development: The Introduction of Cdl Approach in the Border Area of Surabaya and Sidoarjo Regency, Indonesia". Procedia-Social Behavioral Sciences, 227, 107-114. doi: https://doi.org/10.1016/j.sbspro.2016.06.05.
- Van Assche, K. and Djanibekov, N. (2012). "Spatial Planning as Policy Integration: The Need for an Evolutionary Perspective. Lessons from Uzbekistan". Land Use Policy, 29(1), 179-186. doi: https://doi.org/10.1016/j.landusepol.2011.06.004.
- van Roosmalen , P. K. (2000). Ontwerpen Aan De Stad: Stedenbouw in Nederlands-Indië En Indonesië (1905-1950),(1st Ed.). University of Technology, Delft.
- Weaver , D. B. and Lawton , L. J. (2001). "Resident Perceptions in the Urban–Rural Fringe". Annals of tourism research, 28(2), 439-458. doi: https://doi.org/10.1016/S0160-7383(00)00052-9.
- Yamu, C., Van Nes, A., et al. (2021). "Bill Hillier’s Legacy: Space Syntax—a Synopsis of Basic Concepts, Measures, and Empirical Application". Sustainability, 13(6), 3394. doi: https://doi.org/10.3390/su13063394.
- Yi, C. and Ryu, J. (2015). "Growth, Decline and the Challenges Facing a Policy-Dependent and Former-Colonial City: Gunsan, Korea". Cities, 43, 37-47. doi: https://doi.org/10.1016/j.cities.2014.11.007.
- Zhao, P. (2010). "Sustainable Urban Expansion and Transportation in a Growing Megacity: Consequences of Urban Sprawl for Mobility on the Urban Fringe of Beijing". Habitat International, 34(2), 236-243. doi: https://doi.org/10.1016/j.habitatint.2009.09.008.
- Zhong, T.-Y., Huang, X.-J., et al. (2011). "Temporal and Spatial Variability of Agricultural Land Loss in Relation to Policy and Accessibility in a Low Hilly Region of Southeast China". Land Use Policy, 28(4), 762-769. doi: https://doi.org/10.1016/j.landusepol.2011.01.004.


