Planning Analysis and Simulation
Flood risk of today and tomorrow
Spatial analysis of flood vulnerability in Pontianak City

2022 Volume 10 Issue 3 Pages 170-187
Details
2022 Volume 10 Issue 3 Pages 170-187
A flood is like a silent killer. Although small floods may appear harmless, they can be deadly when they become massive. For example, the annual damages from flooding in Pontianak, Indonesia reached 30 million dollar in 2015 and could increase to 83.6 million dollar by 2055. To counter these events, we need to assess the vulnerability of a city by making a flood risk map and comparing the current vulnerability state in 2020 and the future vulnerability state in 2050. The present study involved quantitative research using variables and measurements to indicate the vulnerability state of each district of Pontianak. The variables consisted of evacuation route efficiency and sheltering capacity, with these variables representing how easily people can be evacuated and the sufficiency of shelter, respectively. The efficiency of evacuation routes was measured by integration measures from space syntax methods, while sheltering capacity was determined by the data and simple equations. A quadrant diagram was used to record the results of both measurements and present the vulnerability. This research projected the population in 2050 and repeated the measurements to predict future changes. By comparing the flood vulnerability of Pontianak City in 2020 and 2050, this research found that Pontianak City will become more resilient against flooding. The reason for this finding is the implementation of a ring road to Pontianak City. The ring road will significantly improve the evacuation route of the city. Howeover, the capacity rate decreased, which should be addressed as a serious risk.
Flooding is a common natural hazard that can be caused by excessive rain, ruptured dams, the rapid melting of snow or ice, large storms or tsunamis (Nunez, 2019). Flooding can become quite harmful to society when it is not treated seriously (Morrison, Westbrook et al., 2018). Currently, the frequency and scale of flooding are increasing due to climate change. (Arnell and Gosling, 2016) performed a 100-year flood simulation and found a consistent increase in flood risk for every continent on Earth. Although most floods are small events, they can inflict severe damage and economic losses. In Pontianak, the annual damage from flooding reached US$30 million in 2015 and could increase to US$83.6 million by 2055 (The World Bank, 2020). These losses suggest that we should be more aware of flood risk and perform actions such as evaluations or analyses of flood risk to reduce further losses (Merz, Thieken et al., 2007). With the concern about flood disaster and the risks it causes, an analysis that can assess flood risk is needed.
The evaluation of flood risk has been studied as a scientific subdiscipline known as flood risk analysis and assessment (FRA) (Díez-Herrero and Garrote, 2020). There are several different approaches to flood risk analysis that consist of spatial analysis, risk mapping, global assessments and economic loss analysis (Díez-Herrero and Garrote, 2020). This research focuses on risk map analysis and spatial analysis. A risk map is a cartographic representation of flood characteristics (Marco, 1994). A flood risk map usually presents information about the spatial distribution of floods, probability of flood occurrence and susceptibility of flood-prone elements (Merz, Thieken et al., 2007). Flood risk evaluation in this study was conducted to find a map of flood risk and vulnerability.
From the perspective of urban planners, space syntax is a method used to organise the urban network as quantitative data, a pattern, and a pattern of movement (Hillier, 2009). Space syntax is a popular method for generating risk maps of any natural disaster scenarios (Pezzica, Valerio et al., 2019), such as earthquakes (Cutini, 2013), hurricanes (Carpenter, 2013), landslides (Castillo, 2013) and flood hazards (Abshirini and Koch, 2017; Chang and Lee, 2018; Gil and Steinbach, 2008). In risk mapping, space syntax is often used to show the effectiveness of the evacuation route, the deployment of rescue teams and the ideal placement of emergency service units (Penchev, 2016). Chang and Lee (2018) created a hazard risk map by analysing the effectiveness of road networks and the capacity of emergency shelters. They used space syntax to evaluate the spatial configuration of roads as the effectivity value of the road network (Chang and Lee, 2018). The risk map generated in this study is the result of the spatial syntax method.
The present research created risk maps using space syntax for evacuation in flood hazard scenarios. Notably, this research used the research methods of Chang and Lee (2018). However, this research differs from that of Chang and Lee (2018) in terms of its focus and the study case. This research was focused on flood hazard situations, while Chang and Lee (2018) research did not focus on any specific disaster scenarios. Moreover, this research was conducted in a riverside city where the city structure is more challenging. The river breaks the continuity of the road network and the city is connected by a bridge (Abshirini and Koch, 2017). The present research compared the flood vulnerability of Pontianak City in 2020 and 2050. The purpose of this research was to determine whether Pontianak City will become more resilient or vulnerable against flooding.
Space syntax was first described in 1987 and originally used to understand the reason for only a small corner being been occupied within a vast spatial field of building space or urban space (Hillier and Hanson, 1997). Space syntax involves measuring the geometrical properties of an arrangement and spatial relations for quantifying architectural and urban layouts (Major and Dalton, 2018). Hillier and Hanson (1997) called these properties configurationality. Notably, configurationality implies more than a set of relations. Instead, it refers to complexes of interdependent relations with two critical properties in which a part of the configuration changing will cause the whole system to change (Hillier and Hanson, 1997). Read (1999) tested the ability of space syntax to analyse the large scale of a city by analysing five large cities in the Netherlands. Space syntax successfully gave a meaningful result for large scale analysis. Thereafter, space syntax became commonly used in designing city master plans. Today, the most extensive use of space syntax occurs in Europe (especially in London), South America and China (Major and Dalton, 2018). This research aimed to develop the history of successful space syntax use for analysing cities from another perspective to determine the efficiency of evacuation routes.
From an urban perspective, space syntax is known as a group of techniques for analysing the networks of cities, a way to organise urban data structures in space, a set of theories based on previous empirical studies of cities and a set of theory-based techniques for all scales in evidence-based design (Hillier, 2009). In urban analyses, space syntax can present the relationship of spatial patterns to their functional patterns, such as movement, land use, area differentiation, migration patterns and social wellbeing (Van Nes and Yamu, 2018). By using space syntax, researchers can develop a set of theories about urban space networks and their relation to social, economic and cognitive aspects (Hillier, Turner et al., 2010). Flood risk assessment can be used to prevent losses over the long term.
A flood risk map is a cartographic representation of flood characteristics and predictions for the future (Marco, 1994). The basic purposes of flood risk maps include planning as well as mitigation and prevention scenarios (Van Alphen, Martini et al., 2009). They provide information for spatial planning, insurance and decision making in flood risk management (Luu and von Meding, 2018). Flood risk maps can also be used for land use planning, the correct development of new urban areas, evaluating the cost of flooding and risk reduction, assessing the feasibility of non-structural flood control measures, and increasing public awareness of flooding risk (Marco, 1994). The aims of creating such maps are to reduce social, economic and environmental damage (Todini, 1999). A flood risk map is different from a flood hazard map. Flood hazard maps contain information and predictions for areas with a certain level of flood potential. Flood risk maps are more complex than just showing the areas of flood risk. Flood risk maps analyse the properties of flood hazards and vulnerability (Van Alphen, Martini et al., 2009; Ologunorisa, 2004). The flood risk map presented in this study can help people deal with potential flood risk and give clear steps for evacuation while making people more disaster responsive.
Flood risk mapping with the use of the space syntax method involves an analysis between the efficiency of evacuation routes and the sufficiency of shelters (Chang and Lee, 2018). Assessments of evacuation route networks measure the accessibility of people in street networks within districts (administrative division). It measures how rapidly and easily people can be evacuated because time is often used as an indicator of evacuation effectiveness (Chen and Zhan, 2014). The sufficiency of shelters determines the capacity of the evacuation infrastructure. Notably, determining the capacity of shelters is important because it shows the ideal number of victims that can be properly protected. Exceeding capacity can create other problems, such as unsanitary conditions (Hall, Lee et al., 2017). By combining the properties of route efficiency and shelter capacity, flood risk maps can show the vulnerability of an area if it were to flood (Chang and Lee, 2018). Other research has assessed the time spent to evacuate individuals. However, the present research was focused on route efficiency and shelter capacity. Although floods do not generally occur immediately (as per tsunamis), they still require evacuation. In Borneo, floods occur due to the high intensity of rainfall upstream and downstream of rivers. Since a river’s water flow may not accommodate this level of water discharge, it can result in water overflowing onto adjacent land (Singal and Jumario, 2019). So, with high water intensity, and considering the increasingly uncertain climate, a flood risk map is needed.
Pontianak City is the capital city of West Kalimantan Province, Indonesia and has a total area of 107.82 km2. Administratively, Pontianak City is divided into six districts and 29 sub-districts. The district in Pontianak City with the largest area is North Pontianak District (34.52%), followed by West Pontianak District (15.25%), Pontianak City District (14.52%), Southeast Pontianak District (13.75%), South Pontianak District (13.49%) and East Pontianak District (8.14%). Pontianak City is located at 00 02' 24" North Latitude to 00 05' 37" South Latitude and 1090 16' 25" East Longitude to 1090 23' 01" East Longitude. Based on latitude, Pontianak City is crossed by the equator. Since it is located on the equator, Pontianak City is dubbed the equator city. Geographically, the Pontianak City area is close to several regional growth centres, including Batam, Pekanbaru, Natuna, Jakarta, Balikpapan and Pangkalan Bun. The city of Pontianak is also not far from developing Association of Southeast Asian Nations (ASEAN) countries such as Malaysia, Brunei Darussalam and Singapore. The city of Pontianak is directly adjacent to the Malaysian state of Sarawak. Thus, it has become the ‘front porch’ of the Indonesian state by interacting directly with Malaysia (Figure 1).
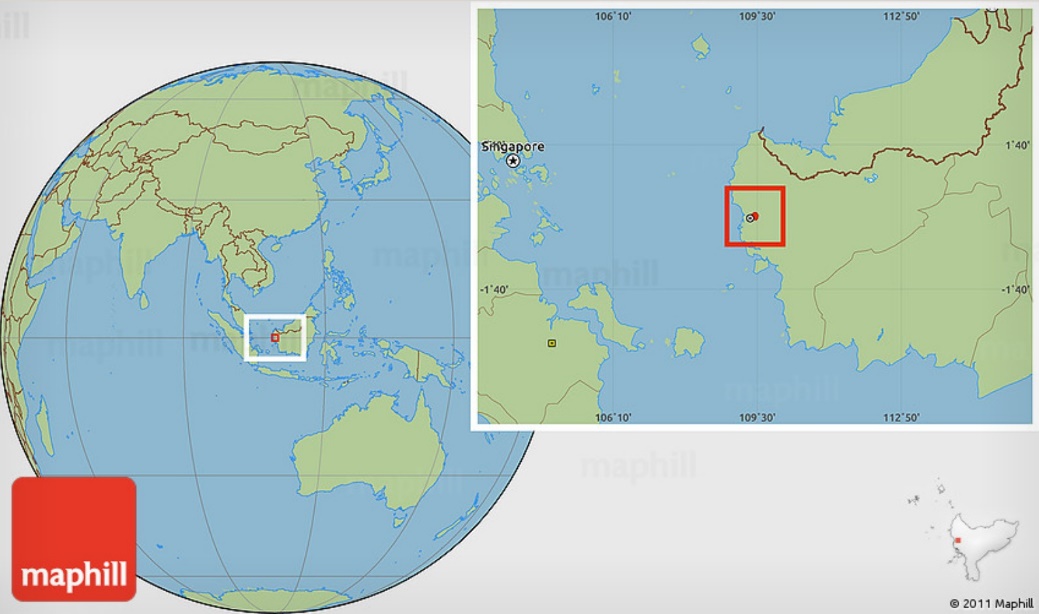
Source: Maphill (2011)
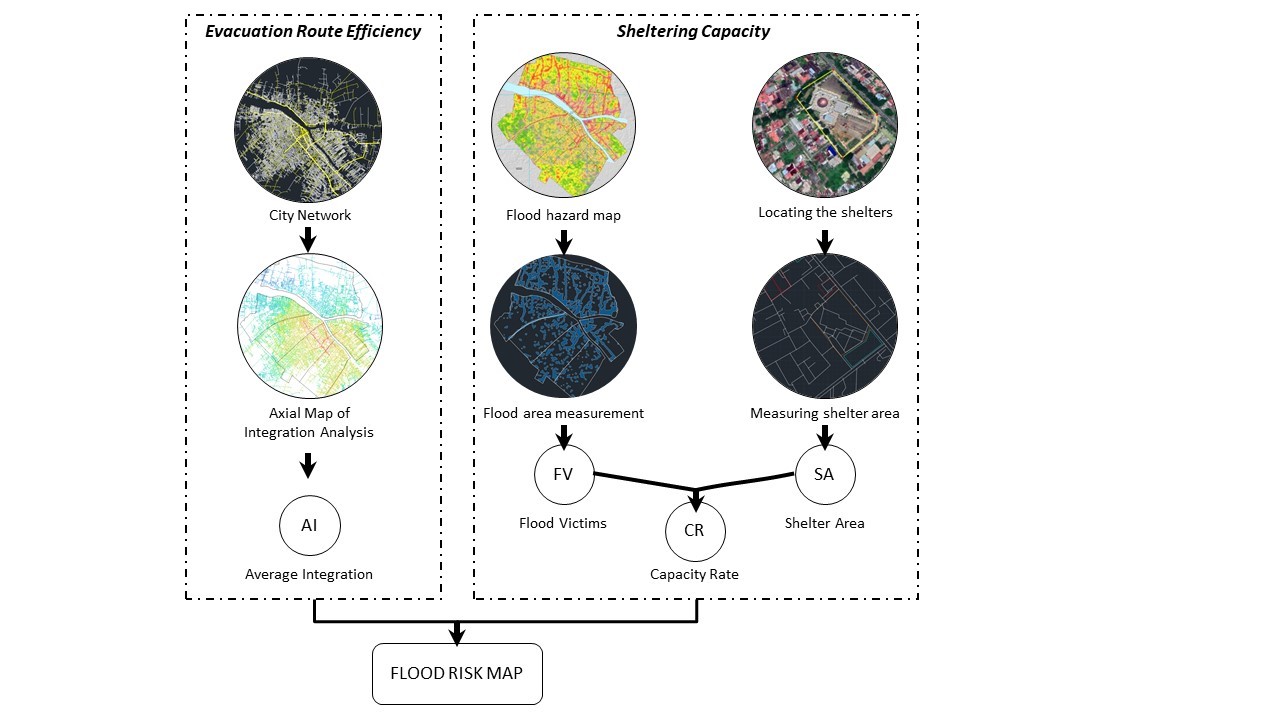
This study involved quantitative research with multiple measurements to create a flood risk map. The created flood risk map presents information about which district (administrative division) is most vulnerable to flood hazards based on running simulations of evacuation scenarios. There are two properties of evacuation scenarios in this research: evacuation route efficiency and sheltering capacity (Figure 2). Space syntax analysed the network of Pontianak City to measure the efficiency of evacuation routes. The evacuation shelter capacity was measured by locating and measuring the area of possible shelter. The measurement results for both properties were combined in a quadrant diagram. This procedure was repeated to project the change in district vulnerability 30 years later (Figure 2).
In this research, the evacuation route network is the network of the city from the main streets, secondary streets and alleys of each district (administrative division). The network also consists of bridge and ferry routes. Space syntax assesses the evacuation routes by the measurement of integration in an axial map (Van Nes and Yamu, 2018). The average integration (AI) result of each district represents the efficiency of evacuation routes (Formula 1). Integration analyses the city network spatially by calculating the direction changes. Integration (i) is a measurement of the relationship between one space and all other spaces in the system, which is calculated by the formula of one per real relative value of asymmetry (RRA) (Formula 2). To obtain the integration value, several calculations must be performed, including the calculation of the relative asymmetry (RA) calculation (Formula 5) and mean depth (MD) (Formula 6). In the RRA calculation (Formula 3), there is a Dk value (Formula 4) that is used to standardise the integration value (Hillier and Hanson, 1984). The MD is calculated by dividing the total depth (TD) by the number of spaces in the system (n) (Formula 6).
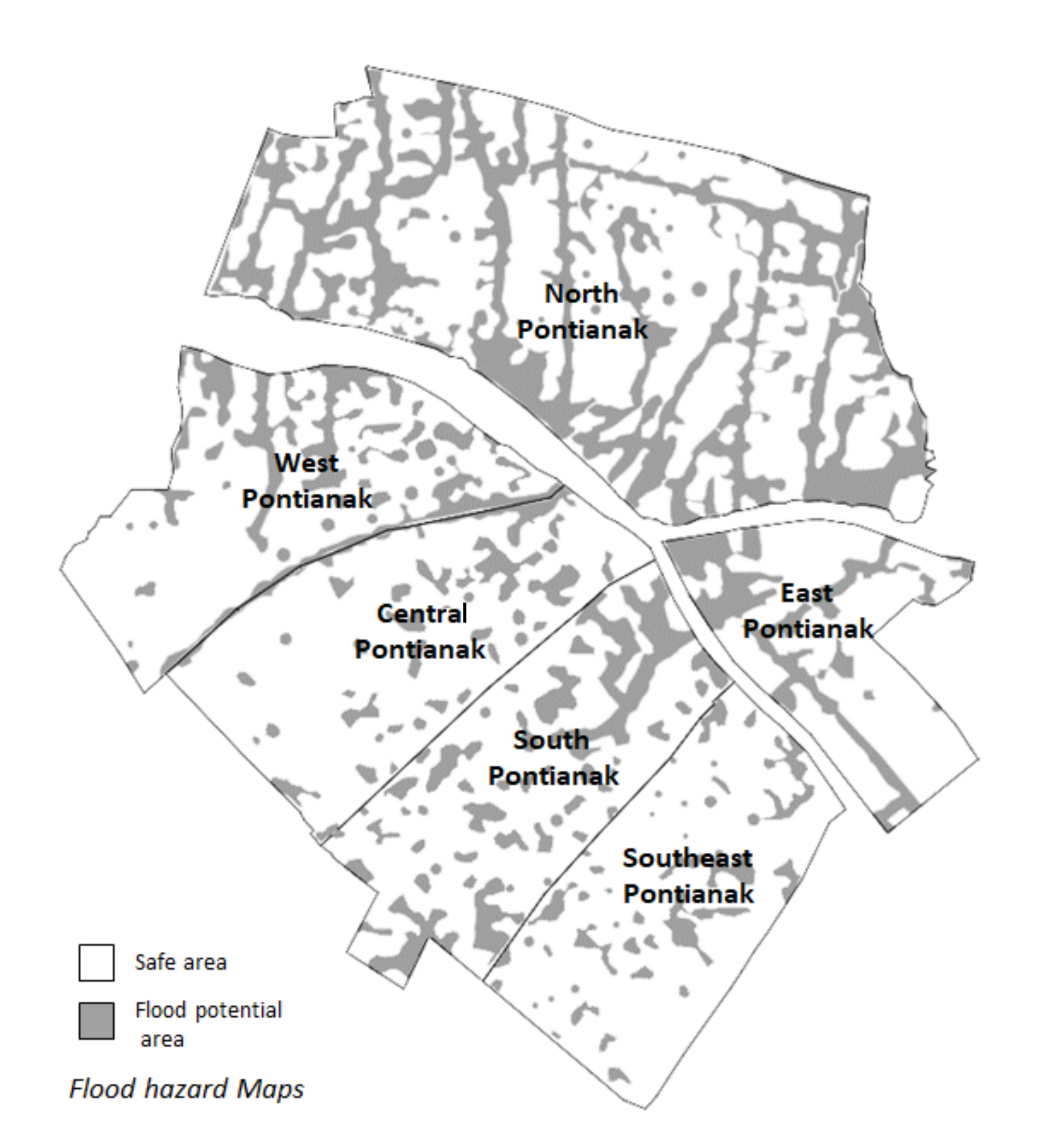
The sheltering capacity determines the sufficiency of existing places that can be used as shelter and their capacity for sheltering flood victims. The shelters specified in this paper are specific to flood scenarios because we specifically considered flood inundation (see Figure 3). Evacuation options or shelters are in positions that do not become flooded. According to the U.S. Federal Emergency Management Agency (FEMA, 2021), a flood of just one inch can cost up to $25,000. Most home insurance policies do not cover flood damage. The measurement of evacuation shelter capacity is formulated using a capacity rate (CR) formula that includes the maximum capacity of shelters (Max Cap.) per total flood victims (FV) (Formula 7). This determines the vulnerability of a district (administrative division), where the lower the rate, the more vulnerable the district.
The maximum capacity of shelter (Max Cap.) is measured as the total area of the shelters (SA) per standard evacuation area for a person (Formula 8). The standard evacuation area based on the BNPB (National Disaster Management Agency) is 3 m2 per person (BNPB, 2008). Obviously, the possible locations for shelters are public places that are not in a flood potency area. The area of these places is summed to determine the total shelter area (SA).
FV is the total population in the flood coverage (FC) area. FV is calculated by multiplying the FC with the population density of a district (PD) (Formula 9). The FC is a district area that is covered by flooding. The FC data were based on the data from the BNPB (Indonesian National Board for Disaster Management) which is combined with the previous studies' results about the mapping of flood-prone of Pontianak City by Kurnia, Mulki et al. (2019), Purnomo, Mulki et al. (2019), and Syahbani, Mulki et al. (2020), for a flood hazard map of Pontianak City (Figure 3). The population density is based on data from the BPS (Central Bureau of Statistics) for Pontianak City (BPS, 2020).
Source: BNPB (2008)
The quadrant diagram compiled the results regarding the effectiveness of evacuation routes and shelter capacity. The effectiveness of evacuation routes in each district (administrative division) was determined by the average of the integration value of all street segments in the district. The values for shelter capacity were also calculated for each district. The values of each district were compared and analysed in the quadrant diagram to determine which district is the most vulnerable. In this quadrant diagram, the x-axis is the value of AI for a district and the y-axis is the value of CR (Figure 4). The lowest and highest values on the x-axis are the minimum and maximum values of integration in the city network. The middle value of the x-axis is not zero; instead, it is the median value of integration for the city network. Since CR is a percentage, the lowest value is 0% and the highest is the highest percentage in the results. The middle value of CR is 100%. This means that if the CR is below 100%, the district is unable to provide shelter to all flood victims.
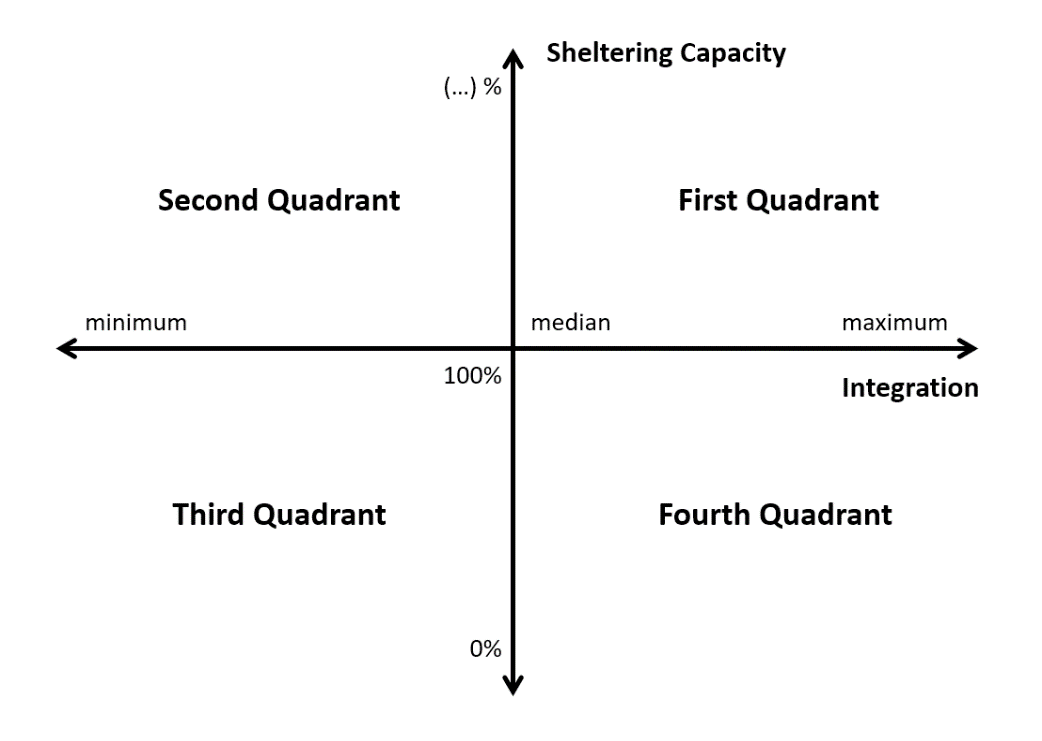
Each quadrant defines different vulnerability states of the district. The first quadrant has high integration and adequate shelter, so it has a low level of vulnerability. The second and fourth quadrants have low values for both properties, so they have a moderate level of vulnerability. The third quadrant has low values for both properties, so it has a high vulnerability (Table 1).
| Quadrant | Route Efficiency | Shelter Capacity | Vulnerability |
|---|---|---|---|
| First quadrant | High | Adequate | Low |
| Second quadrant | Low | Adequate | Moderate |
| Third quadrant | Low | Inadequate | High |
| Fourth quadrant | High | Inadequate | Moderate |
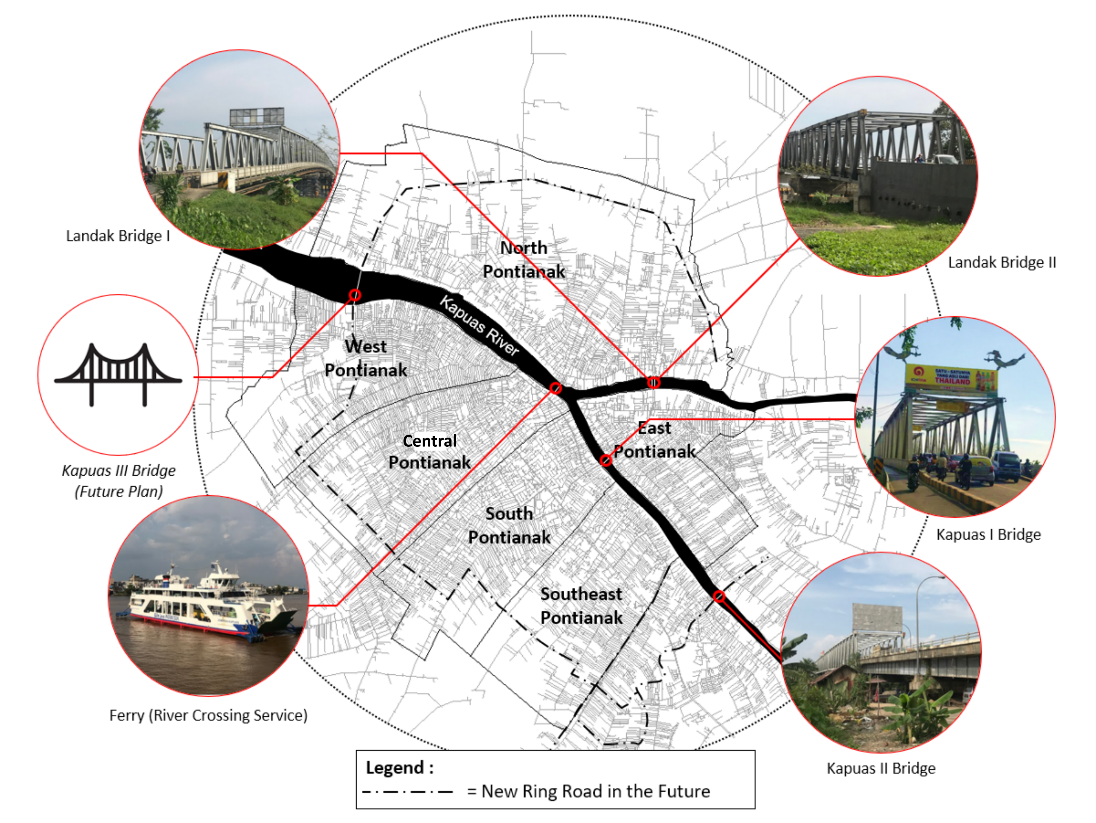
Pontianak City is known as a river city. The Kapuas River crosses the middle of Pontianak City and divides it into three sections (Figure 5). To connect one section with another, the government built four bridges and provided a ferry as a river crossing service. The community is quite dependent on the ferry to avoid overcrowding on the bridge. However, this ferry only operates for 14 hours a day and has a capacity of 150 passengers and 53 vehicles. Since the local population is increasing every year, trips over the bridges and on the ferry are experiencing congestion. Thus, the government is planning a ring road in a future master plan (Local Regulation of Pontianak City No. 2 Year 2013 about Spatial Planning of Pontianak City from 2013 to 2033). The master plan is supposed to be realised in 2050. The existence of this ring road plan also led to the construction of a new bridge known as the Kapuas III Bridge. Through this network enhancement, the government aims to improve accessibility and transportation—especially on the division created by the river—to encourage even development.
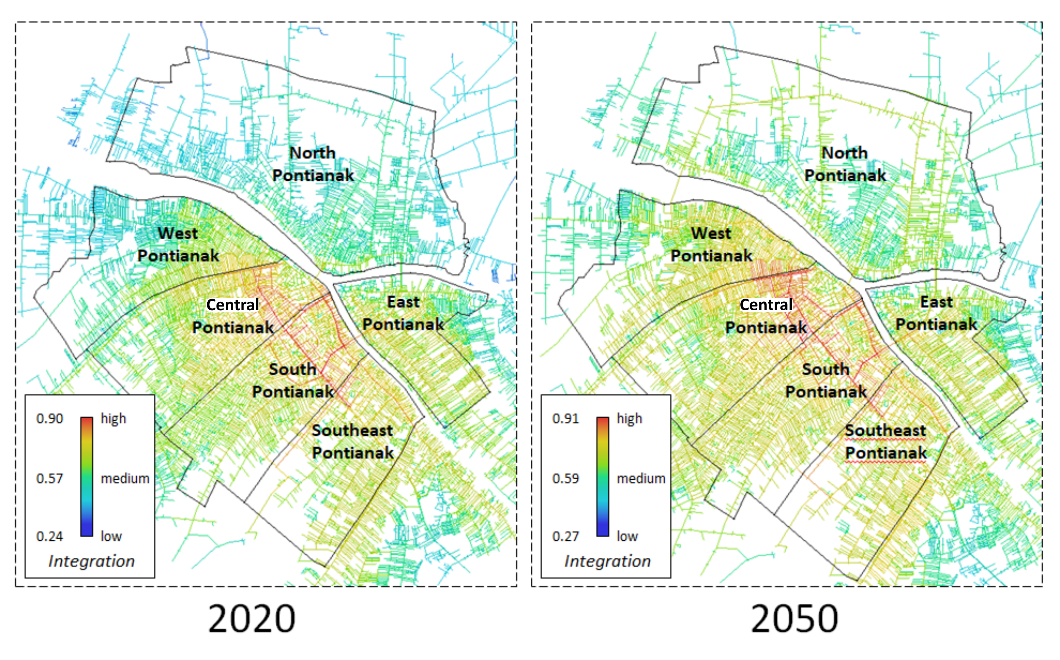
The axial maps (Figure 6) show the integration value, which is represented by a set of colours. The warm colours (red, orange and yellow) represent high integration and the cool colours (green, cyan and blue) represent the opposite (Dettlaff, 2014). Based on the centrality concept (Chiaradia, Hillier et al., 2009), the red colour indicates the centre of the city, where the most accessible places from all streets of the network are located. A quick glance at the networks in 2020 and 2050 (Figure 6) reveals bold differences resulting from network accessibility, especially in North Pontianak. The central portion of the network in 2020 is concentrated in Central Pontianak and South Pontianak. North Pontianak had colder colours than the other districts. North Pontianak will become less accessible because the only route from the central part of the city is the ferry route. Due to the limited operating hours and capacity of the ferry, evacuation from North Pontianak will involve some transportation difficulties. Additionally, Mustofa (2016) categorised North Pontianak as an urban sprawl area where the settlement used to develop sporadically. In 2050, the central portion of the city will be shifted to Central Pontianak and spread out toward West Pontianak, Southeast Pontianak and East Pontianak. The accessibility of North Pontianak has improved drastically in the network for 2050. The planned ring roads and additional bridge have proven to be a successful strategy for improving accessibility and transportation.
This research categorised the accessibility of each district into two categories: low efficiency and high efficiency. This categorisation is made easy by converting the integration data from colour values (Figure 6) into numerical values (Table 2). In a network system, there are the lowest integration values and the highest integration values. The median value is calculated from those values. This value acts as an indicator of low and high efficiency (Figure 6). For example, the median value of the network in 2020 is 0.57 (Figure 6); thus, the districts with an AI lower than 0.57 have low efficiency for evacuation and vice versa. In the 2020 data, there are two districts with low efficiency and four districts with high efficiency. The two low-efficiency districts are North Pontianak and West Pontianak. North Pontianak has the lowest AI (0.42), while West Pontianak is the second lowest (0.55). These values nearly pass the median value of 0.57. The remaining districts (East, Centre, Southeast, and South Pontianak) have high efficiency, with AI ranging from 6.0 to 6.7. In the 2050 data, the median value increased to 5.9. Notably, the AI of all districts improved. Only one district has low efficiency under this scenario (North Pontianak; 5.7 AI, slightly below the median value).
| District | Average Integration of 2020 |
Evacuation Route Efficiency of 2020 |
Average Integration of 2050 |
Evacuation Route Efficiency of 2020 |
|---|---|---|---|---|
| North Pontianak | 0.42 | Low | 0.57 | Low |
| East Pontianak | 0.60 | High | 0.62 | High |
| West Pontianak | 0.55 | Low | 0.65 | High |
| Central Pontianak | 0.65 | High | 0.69 | High |
| South Pontianak | 0.67 | High | 0.70 | High |
| Southeast Pontianak | 0.65 | high | 0.68 | High |
The future masterplan of Pontianak City will have a great impact on improving transportation and accessibility in 2050. The plan changes the position of West Pontianak and North Pontianak from the corner of the city to be closer to the central part of the city. The role of the ring road to connect the outer sections more closely has also proven to be successful in this plan (Duan and Wang, 2009). The efficiency route of all districts will be improved through the implementation of the ring roads. This is the effect of the main feature, which is to improve access to the central part of the city and achieve better traffic flow (Van Nes, 2021). However, the ring road plan of Pontianak City is not entirely effective. Only the ring roads in North Pontianak have been highlighted to have high integration value (Figure 6). As shown in the plan (Figure 5), the remaining ring roads in other districts were hardly recognised and did not show contrast in the integration analysis. It is debatable whether it is only the bridge or the ring road that improves the accessibility. In space syntax, Hillier noted the shortest path concept (Varoudis, Law et al., 2013). This concept explained how people tend to move in paths with fewer turns, take smaller turning angles and choose shorter lengths (Varoudis, Law et al., 2013). The ring road in North Pontianak works ideally because it is straight and involves fewer turns. In West, Central, South and Southeast Pontianak, the ring road is hardly highlighted because it is too curvy and has many turns.
Although the evacuation route efficiency of some districts is high, this research found that a flood would block most of the street segments (see Figure 3). This is because Pontianak City used to have a canal network in the 1800s since transportation was mostly by boat (Sirrullah, 2019). Later, the road network was built alongside the canal. The potential flood area map shows that all districts had their road networks blocked by flooding, except for Central and Southeast Pontianak. North Pontianak has the most blockage, with all main roads being blocked by a potential flood. Meanwhile, East, South and Central Pontianak have high-efficiency evacuation routes despite a potential flood blocking most of their main routes. Thus, although the assessment using space syntax integration analysis can measure efficiency, potential blockage by a flood cannot be neglected. This finding is an extension of Chang and Lee’s work (2018); however, this research was focused on flood scenarios and implemented route blockage as a consideration.
Chang and Lee (2018) performed a network analysis district by district and bordering the scope of the network with the administrative division. This research found that the technique was unrealistic to the actual conditions. First, performing a network analysis part-by-part is akin to isolating each area. Thus, the measurements would be much different if the network was analysed as a complete city network. As shown in Figure 6, the road network of Pontianak City was analysed entirely as one network. The result helps us understand comparisons among all districts. Secondly, due to resource and time limitations, it is recommended to set the scope of the area to a minimum, as needed. However, dividing the area of research by administrative area is not a good choice since this can affect the validity of measurements. Administrative areas can appear in random and unnatural shapes. This research suggests performing analyses by using a radial cut. In Figure 6, the analysed area was not cut by the administration zone but rather by a radial cut with a radius of 9.5 km.
The government has made efforts to improve accessibility by making plans to add new bridges and roads. This is predicted to help reduce the impact of accessibility from population growth. To increase the success rate in creating an integrated access, it should be done by making lines that are clearly connected and do not have many turns. In planning the network, it is better not to divide based on administrative areas, but on the areas of influence and areas that are affected.
Sheltering CapacitySheltering capacity is an adequacy measurement of shelter area for flood victims in a district. In this research, sheltering capacity was divided into two categories: adequate and inadequate. A district has adequate capacity when the sheltering capacity is equal to or above 100%. If lower than that, the district will be categorised as inadequate. This research defines shelters as public buildings outside of the flood potential area. These consist of places of worship, schools, government offices and parks. These types of buildings act as temporary emergency shelters (Chang and Liao, 2015). Public buildings such as schools, religious buildings or community halls have always been used as evacuation centres. It is very important to provide comfortable, private and rehabilitated shelters to serve flood victims’ physical and mental needs (W Seman, Abdul Rahim et al., 2021).
The result for sheltering capacity in 2020 was that two out of six districts have adequate capacity (see Table 3). These were Central Pontianak and Southeast Pontianak. Southeast Pontianak is the most adequate district with a capacity of over 3000%, while Central Pontianak has a capacity 10 times smaller than that but still beyond adequate. The reasons for this great capacity are because the districts have a large shelter area, small flood coverage and few flood victims.
North Pontianak, East Pontianak, West Pontianak and South Pontianak have shelter capacities below 100%. Notably, there are not many shelter areas in South Pontianak. South Pontianak has a flood coverage zone of 4,725,686.36 square meters, but only has a shelter area of 36,928.86 square meters, this results in a shelter capacity of only 42%, and this is inadequate. Most of the areas that should become shelters are in the flood coverage zone. In contrast to Southeast Pontianak which has a flood coverage zone of 2,050,294.62 square meters but has a sheltered area of 641,289.00 square meters, in the form of parks and schools, this causes this area to be adequate to serve as a shelter because it has a capacity of 3147%. East Pontianak has quite a number of shelters, namely 78,795.57 square meters, but because it has a fairly wide flood coverage of 2,969,006.80 square meters, this area is still not adequate.
North Pontianak is the largest district in Pontianak City. However, it turns out that it has the lowest number of shelter areas. This is because most of the shelter areas are within the flood area. The result is that most of the shelter areas cannot be used as evacuation sites. The same issue exists in West Pontianak since half of the shelter area is within the flood area. Central Pontianak is different from North Pontianak and West Pontianak. Notably, Central Pontianak has more shelter areas, with most of these not being in the flood area. This is why Central Pontianak has a capacity rate up to three times higher than other districts and is already sufficient as an evacuation site.
| District |
Shelter Area (m2) |
Maximum Capacity (person) |
Flood Coverage (m2) |
Population Density (person/m2) |
Flood Victims (person) |
Capacity Rate | Sheltering Capacity |
|---|---|---|---|---|---|---|---|
| North Pontianak | 45,290.28 | 15,097 | 15,526,511.40 | 0.00385 | 59,738.27 | 25% | Inadequate |
| East Pontianak | 78,795.57 | 26,265 | 2,969,006.80 | 0.01205 | 35,772.47 | 73% | Inadequate |
| West Pontianak | 52,559.40 | 17,520 | 4,063,279.06 | 0.00866 | 35,187.90 | 50% | Inadequate |
| Central Pontianak | 202,364.59 | 67,455 | 2,644,441.53 | 0.00793 | 20,976.16 | 322% | Adequate |
| South Pontianak | 36,928.86 | 12,310 | 4,725,686.36 | 0.00625 | 29,523.84 | 42% | Inadequate |
| Southeast Pontianak | 641,289.00 | 213,763 | 2,050,294.62 | 0.00331 | 6,791.96 | 3147% | Adequate |
The population projection for 2050 can show the development of the vulnerability state. In the projection, the flood area and shelter area remained the same despite the population increase. The trend of population growth is counted using data from the BPS (Central Bureau of Statistics) from 2014 until 2019. The process of measuring the evacuation shelter capacity was repeated with data for 2050. Then, a new quadrant diagram recorded the new result. Ultimately, there were two diagrams to compare.
Based on 2050 data, the results show that adequate shelter capacity is only found in two districts, in South Pontianak and East Pontianak. And four districts with insufficient capacity (see Table 4). Shelters in South Pontianak and East Pontianak which were initially insufficient, have become increasingly inadequate for flood victims. The capacity rate for South Pontianak decreased, from 42% to 35%; and East Pontianak also fell, from 73% to 32%. However, in Southeast Pontianak, where there were initially many shelters, there were still enough shelters to accommodate flood victims. The calculation of the flood area and the number of SAs was set as the same in 2050. Thus, the only thing that changed was population density.
Thus, it is estimated that by 2050, the number of shelters in North Pontianak, West Pontianak, and Central Pontianak will be greatly reduced to accommodate all of their residents. The capacity rate for North Pontianak decreased, from 25% to 11%; West Pontianak also fell, from 50% to 30%; and Central Pontianak also fell, from 322% to 260%. However, since Central Pontianak has a vast amount of shelter areas, the shelter area will still be very adequate as an evacuation site in 2050.
Shelters are facilities that must be provided to accommodate disaster victims, but not only their availability, but also the number of facilities that can be accommodated. Shelters should be provided according to the size of the location that is likely to experience flooding that covers the residential area. Not only that, the consideration of population growth is also a priority to maintain the shelter area or even, if possible, to expand it.
| District |
Shelter Area (m2) |
Maximum Capacity (person) |
Flood Coverage (m2) |
Population Density (person/m2) |
Flood Victims (person) |
Capacity Rate | Sheltering Capacity |
|---|---|---|---|---|---|---|---|
| North Pontianak | 45,290.28 | 15097 | 15,526,511.40 | 0.00851 | 132,087,97 | 11% | Inadequate |
| East Pontianak | 78,795.57 | 26,265 | 2,969,006.80 | 0.02762 | 82,006.13 | 32% | Inadequate |
| West Pontianak | 52,559.40 | 17520 | 4,063,279.06 | 0.01415 | 57,495.10 | 30% | Inadequate |
| Central Pontianak | 202,364.59 | 67455 | 2,644,441.53 | 0.00981 | 25,947.82 | 260% | Adequate |
| South Pontianak | 36,928.86 | 12,310 | 4,725,686.36 | 0.00737 | 34,812.95 | 35% | Inadequate |
| Southeast Pontianak | 641,289.00 | 213,763 | 2,050,294.62 | 0.00368 | 7,537.80 | 2836% | Adequate |
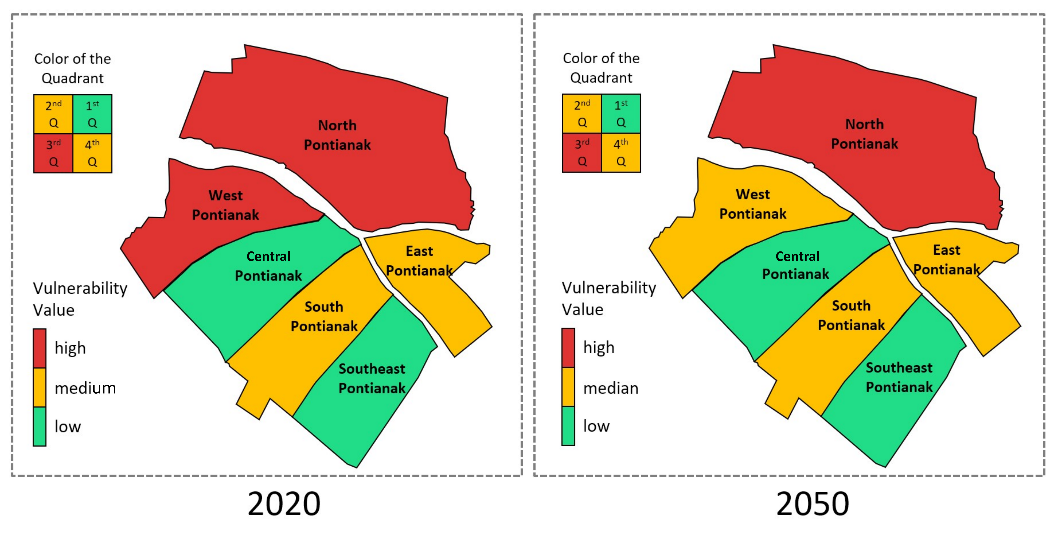
This research defined flood risk by analysing the factors of evacuation route efficiency and shelter capacity. The results are shown in the quadrant diagram (Figure 7). Based on 2020 data, there are two districts in the third quadrant, two districts in the fourth quadrant and two districts in the first quadrant. The districts’ positions changed based on data for 2050. West Pontianak moved from the third quadrant to the fourth quadrant, while other districts remained in the same quadrant. To observe these changes more clearly, this research converted the diagram data into a coloured flood risk map of Pontianak (Figure 8).
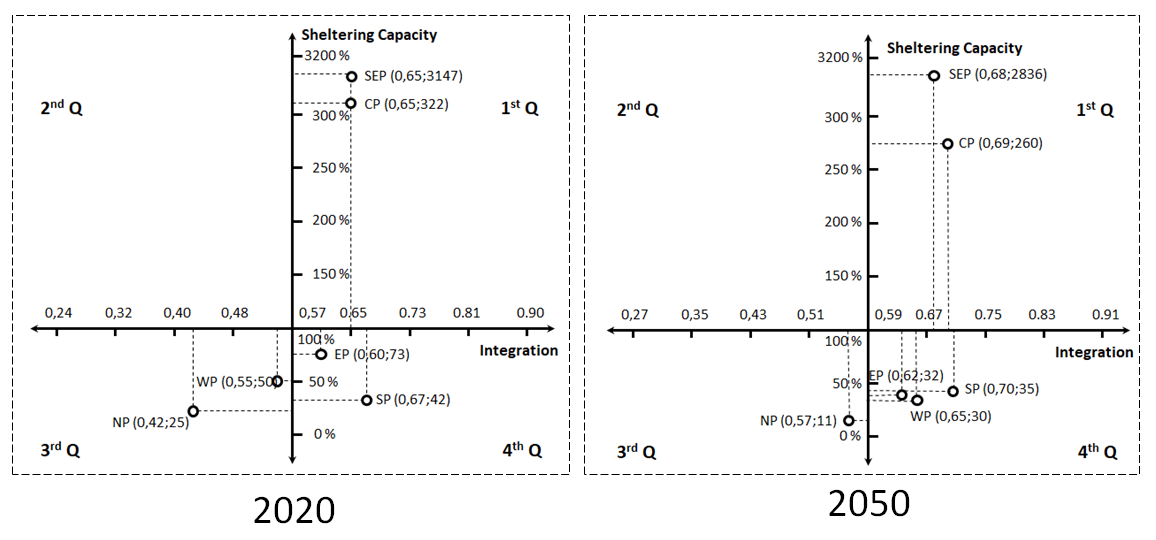
In the 2020 diagram, North Pontianak and West Pontianak are in the third quadrant because they have low integration values and insufficient sheltering capacity. Meanwhile, Central Pontianak is in the first quadrant because it has a high value of integration and sufficient sheltering capacity. In the 2050 diagram, there are changes in the three districts. However, the most drastic difference occurred in West Pontianak, which moved from the third to the fourth quadrant. This is because the existence of the ring road made the integration value of West Pontianak much better. While the integration value of North Pontianak also increased, it did not yet reach a good integration value. Central Pontianak's integration value improved even more because of the ring road—not only in terms of the difference in integration value but also the decreasing capacity rate, which can be seen via the decreasing coordinate points of the three districts.
Both time frames show a correlation between sheltering capacity and integration. In the beginning, South Pontianak and East Pontianak have inadequate capacity. However, their levels of integration are high enough to be included in the fourth quadrant. In contrast, Southeast Pontianak—which has a very high capacity and sufficient integration—is included in the first quadrant. Ultimately, integration in South Pontianak, East Pontianak and Southeast Pontianak will increase due to the ring road. Although sheltering capacity will decrease, the location of these three sub-districts in the quadrant remains the same.
One way to observe how prepared a district is to face a flood disaster is through the use of a quadrant diagram. A district must have a high integration value for evacuation routes and adequate sheltering capacity to be ready for a flood disaster. North Pontianak and West Pontianak are in the third quadrant that is least prepared for flood disasters due to their inadequate values of integration and sheltering capacity. However, with the existence of the new ring road in 2050, the integration value of West Pontianak will be much better. Thus, it will be better prepared for flood disasters. This implies that good road management tremendously affects the value of integration for a district. For future flood disaster preparedness, road planning must be well designed because it affects the integration value of evacuation routes.
In terms of shelter areas, the case in North Pontianak showed a lot of shelter areas; however, most of these were within the flood area. The same is true for West Pontianak. This means that shelter areas must also be properly designed so that they are not in the flood area. We advise that the government should design roads and shelter areas properly for better flood preparedness in the future.
This research highlights the importance of urban planners and scholars rethinking the value of flood disaster prevention planning. In some cases, we also support the government in building a ring road in the future because comprehensive research found a lower vulnerability value for the area traversed. Moreover, according to space syntax analysis, shelters need to be added away from the flood coverage area and connected to important roads. In 2050, the occurrence of flooding will be more frequent and many coastal cities will sink into floodwaters if there is no significant effort from our community to balance the nature of climate change. Figueres and Rivett-Carnac (2020) predicted that in 2050, the world will suffer from extreme flooding that will destroy infrastructure, kill thousands and result in the relocation of millions of people from their homes. In their prediction, the sea levels will rise by over 5 metres, making coastal cities such as Miami, Shanghai and Dhaka overrun with water (Figueres and Rivett-Carnac, 2020). Based on this prediction, the government can not only prepare its infrastructure but also create regulations for protecting the environment.
Similar to the work of Chang and Lee (2018), this research presents a disaster risk reduction plan through a flood risk map that was calculated based on city network accessibility and the availability of shelter. However, this research has significantly extended findings for hazard management. While Chang and Lee (2018) analysed an urban network in a single time frame (synchronic), this research proposed a workflow for double timeframe analysis. Using this workflow, this research can predict risks to urban infrastructure from flood hazard scenarios.
The success of the government's plan to be prepared for flood disasters, is determined by the high value of integration for evacuation routes. In this study, it was found that success was due to a plan to build a ring road. However, to ensure the success of all areas, a comprehensive integration plan is needed, and not only that, the placement of shelter locations is also important, they must be far from potential flood locations, so that the shelter can be fully utilized.
This research aimed to raise people’s and policy makers' awareness of flood disaster mitigation and to provide information for Pontianak City’s development. By comparing the flood vulnerability of Pontianak City in 2020 and 2050, this research found that Pontianak City become more resilient against flooding. The reason for this finding is the future implementation of a ring road in Pontianak City. Notably, the ring road will significantly improve the evacuation routes of the city. On the other hand, a capacity rate decrease can possibly be raised as a serious risk. This research suggests a strategy for future planning on reducing the flood area. By understanding these dynamics, the government can prioritise their funding and efforts to the most essential parts first. There are several ways to identify mitigation options, one is analysing the spatial structure of Pontianak City via space syntax, conducting an inventory of the infrastructure for evacuation in each district and generating a flood risk map. This research also found inefficiencies in the proposed ring road. In future research, the ring road plan of Pontianak City needs to be comprehensively assessed. The research outlined in this study will be good to continue in future studies aimed at examining the best type of shelter for flood disasters. This type of research is also advisable to perform in all locations on the island of Borneo since the island is known as the "Island of a Thousand Rivers" due to the many rivers that flow on it. Thus, it is important to research how flood disasters can be prevented and how important it is for the government and society to start conducting flood prevention improvements.
Conceptualization, B.J.B.G. and A.; methodology, B.J.B.G. and A.; software, J.Z. and E.J.; investigation, J.Z. and E.J.; resources, B.J.B.G.; data curation, A.; writing—original draft preparation, J.Z. and E.J.; writing—review and editing, B.J.B.G. and A.; supervision, B.J.B.G. and A. All authors have read and agreed to the published version of the manuscript.
The authors declare that they have no conflicts of interest regarding the publication of the paper.
The authors like to acknowledge Tanjungpura University, for holding research-based lectures, so that the research can be continued in the form of a journal, which is expected to add insight and provide suggestions for flood problems in Pontianak City.