Planning Assessment
Accessibility, Walkability, Mixed Land Uses:
Analyzing Diverse Districts Based on Space Syntax Theory

2022 Volume 10 Issue 4 Pages 223-239
Details
2022 Volume 10 Issue 4 Pages 223-239
Developing technology and maximum usage of underground resources have led to the rise of several urban problems. Nonetheless, smart growth (SG) is one of the practical principles for solving different issues, such as traffic problems, air and noise pollution, urban sprawling, etc. In this article, three parameters of smart growth, namely: accessibility to public transportation, walkability, and mixed land use, and the main parameters of space syntax theory including, integration and connectivity in three different urban districts (old, middle, and modern) in the city of Bojnourd, the city in north-eastern of Iran have been investigated. By analysing these parameters, the relationship between selected SG indices and space syntax indexes has been presented. The ANP approach was also applied to improve decision-making and to grade the importance of criteria; districts were finally graded using the TOPSIS model concerning walkability, and access to public transportation. The mixed-land uses index was also calculated by examining 11 land uses through the Shannon entropy formula. The results indicate that there is an internal relationship and correlation between smart growth indicators and space syntax ones. Additionally, given solutions can be taken as a significant step to tackle urban issues and advance sustainable development aims.
Immigrations from rural to urban areas and the settlement of these immigrants in the suburbs are the most critical factors affecting urban sprawling. Smart Growth (SG) based on the decuple principles adopted in Environmental Protection Agency (EPA) and compliance with sustainability principles with the aim of urban sprawl reduction attempts to solve traffic problems, the destruction of gardens and agricultural lands, air pollution, high dependence on vehicles, lack of attention to intra-city districts, etc. Walking to and from local destinations, including shops, services, and transit stops, is a significant source of adults’ health-related physical activity. This research has been using space syntax measures in examining how the urban form is related to such routine walking for transport, comparing three different types of urban districts, and discussing how this theory can link urban form (street layout) and function (land use) with walking for transport.
Street connectivity is a component of walkability related to urban form. It is concerned with street layout, in particular, the directness of routes between two locations (e.g., home and shopping venues) in a street network (Handy, Paterson et al., 2003). It has typically been measured as intersection density (i.e., the number of intersections with three or more intersecting streets divided by area size), greater street connectivity has been found consistently associated with higher levels of walking (Koohsari, Oka et al., 2019). Space syntax offers an alternative way of measuring street connectivity. Originating from architecture and urban design, space syntax is commonly understood to be a method to characterize and quantify the spatial layout of enclosed spaces within buildings or streets within urban space, using topological approaches (Hillier and Hanson, 1984; Hillier, B., Hanson et al., 1987). The space syntax theory is a method to analyze quality factors using a quantitative analysis. Space Syntax, proposes that space is quantifiable and can be analyzed by breaking it down into individual parts (segments) (Matějček and Přibyl, 2020). Space syntax analyses spatial layouts by converting space into a graph (Berhie and Haq, 2017). ‘Natural movement’ is the proportion of urban pedestrian movement determined by the grid configuration. It is rejecting the generally assumed idea of place as one thing and movement between places as another (Luisa Maffini and Maraschin, 2018). Later other researchers developed this finding and described how the relation between grid and movement influences many socio-economic aspects such as: land use distribution, crime, and structure of cities (Heyman and Sommervoll, 2019). Street integration, a key space syntax measure, shows how “accessible” a street segment is topologically from all street segments within a defined area (Turner, 2004). Space syntax measures have been used as an indicator of street connectivity in active living research (Baran, Rodríguez et al., 2008). In brief, this theory proposes that motion is essentially an issue related to the morphology of the city, and is the main product of the configuration of space and the way of communication between urban elements; so that spatial configuration alone can be considered as the main factor of predicting the movement of a pedestrian (Al-Sayed, Turner et al., 2014) Land use mix, which refers to having various services, retail outlets, and other amenities within an area, represents a functional aspect of urban land. It is hypothesized that higher land use mix is conducive to more walking for transport, but literature reviews have shown inconsistent findings on the association of land use mix with walking for transport (Durand, Andalib et al., 2011; Grasser, Van Dyck et al., 2013). This may be partly because land use mix relates to the presence of different uses (any land uses) rather than the fact of specific land uses that may provide destinations for walking (Koohsari, Oka et al., 2019).
Since changing to the capital city of the North Khorasan province in 2004, Bojnourd has shown rapid growth and many village-city immigrants in recent years, which has spawned the expansion of suburbs and the emergence of new developments to accommodate the immigrants. Different types of urban districts in Bojnourd City, including old, middle, and new are suffering from the issue of pedestrian-driver connection network, and consequently many problems such as access weakness, noise, irregularity, air pollution, reduced safety level for pedestrians and drivers, and no access to public transportation have emerged (Roozkhosh, Molavi et al., 2020). Accordingly, through adapting the indicators of SG and the analysis taken from space configuration, the motion system in the district of urban neighbourhoods will be organized. The main goal of this study is to analyse the relationship between SG and space syntax indices in diverse districts.
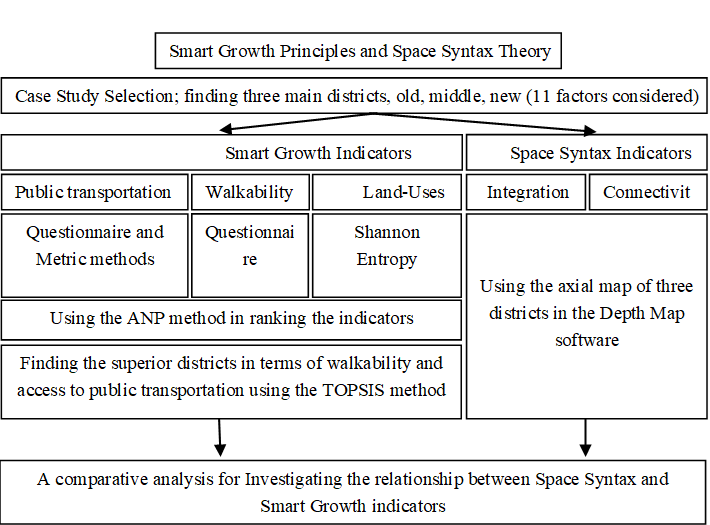
Research methodThe present research is a developmental type and has benefited from field studies, questionnaires, and library research for its data collection approach. This research uses a descriptive approach to identify the principles and criteria of SG in the improvement of urban problems and to analyse the status of the urban district’s district of Bojnourd in terms of their potential for adaptability to the principles of SG and the theory of space syntax. It also analyses the relationships between the principles of SG and space syntax with a correlation method. The data used in this study is quantitative, and regarding the time, it is restricted to a specific period, and in terms of purpose this is an applied-developmental type because it examines the relationship between SG parameters and the space syntax theory in a variety of urban districts. To calculate the indicators of walkability and public transportation, both metric and questionnaire methods were used. The indicators were ranked with the assistance of urban experts with the ANP method using Super Decision software. On the other hand, by integrating the data from the questionnaire and software and the results of the hierarchical ranking using the TOPSIS method, the superior districts in terms of walkability and access to public transportation were identified. The mixed-land uses index was also calculated by examining 11 land uses through the Shannon entropy formula. The space syntax theory parameters were also studied using the axial map of three districts in the UCL Depth map software. Eventually, a comparative analysis of SG data and space syntax theory was done to achieve the relationship between these indices. Diagram (1) illustrates the framework of article methodology.
Space Syntax was established by Hiller and Hansson in 1984 to change the notion that knowledge must necessarily be first developed in academic disciplines and then used in applied sciences (Hillier, B. and Hanson, 1997). This method was created at the University College of London in the mid-1980s, and it has seen widespread use in planning projects throughout Europe and Asia. Over 300 articles and four books have been published using Space Syntax (Raford and Ragland, 2004), and it has been used in a variety of high-profile planning and different aspects of smart growth studies. In contrast with the other urban network approaches that focus on street patterns and compositions, space syntax focuses on street structures or spatial configurations. Through graph theory, the space syntax method can calculate the mathematical relationships between spaces (van Nes and Yamu, 2021). The core of all space syntax explanations is the notion of network graphs (Tutuko, Bonifacius et al., 2021).
Several studies have been done by considering different aspects of smart growth principles and space syntax methods. On the one hand, these studies have measured smart growth principles (walkability, accessibility, mixed land use, etc.) using the space syntax method. On the other hand, some of them have investigated the relationship between different parameters of SG by space syntax method. Raford and Ragland (2004) have modelled pedestrian volume and exposure using space syntax due to the importance of walking for the health of cities and their residents. This project analysed the relationship between pedestrian volume and various factors, including criminal activity, retail behavior, and rates of physical activity and obesity. As well, Koohsari, Sugiyama et al. (2016) have used the space syntax concepts and methods to investigate the potential to provide novel insights into built-environment influences on walking. They examined whether two street Network measures (intersection density and street integration from space syntax) were independently associated with walking for transport (WT) in Adelaide, Australia. This study suggested that space syntax can be a helpful concept/method to advancing research on the built environment and physical activity such as walking and cycling. Besides, the walkability and walking for transport were studied by Koohsari, Owen et al. (2016), using space syntax for characterizing the built environment. This study has examined complete walkability index and space syntax walkability (SSW) with walking for transport (WT). They observed the associations of total walkability and SSW with WT frequency were positive. Finally, it revealed that the concept and methods of space syntax provide a novel approach to further understanding how urban design influences walking behaviours. Baran, Rodríguez et al. (2008), by using space syntax, have analysed the relationship between the syntactical properties of street design and walking behaviour that whether space syntax measures in New Urbanist and conventional suburban neighbourhoods were associated with the walking patterns of residents in these communities. They found significant relationships between the number of leisure trips and all three syntactical measures, including connectivity, control, and integration. It considers also a consistent positive relationship between total utilitarian walking and two space syntax variables, control and global integration. Additionally, Huang and Hsieh (2014), in their research, have investigated the relationship between mixed land uses and accessibility using the space syntax method. Exploring the relationship between road networks and the strength of commercial development is the primary purpose of this research. It adopted the view of topology by using the structures of points and lines and illustrating the characteristics of the road network by link relationships; compared to past studies, Space Syntax emphasized the visual senses and the concepts of environmental awareness to explore features such as accessibility, connectivity of road network that fits the human actual spatial behaviour and needs more. The analysis of Space Syntax has shown that the relevance of accessibility within the region and the diversity of mixed land use is high. For urban environments, the most important of these representations is the axis or axial line based on the fewest and most strategic lines of sight as defined by the facades of buildings and other physical impediments to visibility and movement because the movement is fundamentally linear the matrix of these lines is the axial map or, more commonly, a space syntax model, which mathematically analyses the impact of the urban network based on spatial configuration (Hilier, 1996; Hillier and Hanson, 1984; Hillier, B. and Iida, 2005; Major and Dalton, 2018).
After analysing the previous studies in literature, it can be revealed that in several articles, different parts of SG principles and space syntax method have been studied. While the main gap in this regard is the relationship between city structure and function. Thus, This article by considering three main principles of smart growth, including walkability, accessibility to public transportation, and mixed land uses in different urban districts (in terms of archaism, the structure of network transportation, permeability, etc.) and two leading indices of space syntax theory, has investigated that how urban form is related to such routine walking for transport comparing three different types of the urban districts, and discussing how this theory can link urban form (street layout) and function (land use) with walking for transport.
The world is rapidly being urbanized. It is predicted that by 2050, 66% of the world’s population will be living in urban areas — this will result in an estimated number of 2.5 billion people being added to the urban population (Zoomers, Van Noorloos et al., 2017). Urban sprawl is a significant challenge for urban areas because it leads to a series of problems, such as environmental pollution, ecological destruction, the deterioration of traffic conditions, the sharp increase of domestic garbage, the lack of per capita resources in the city, etc. (Zhang, Wang et al., 2019). SG is widely adopted by planners and policymakers as an environmentally friendly way of building cities (Gren, Colding et al., 2019). SG is an urban planning and transportation theory that concentrates on growth in compact, walkable urban centres to avoid sprawl (Yuwei and Mengyue, 2018). Researchers and experts have recognized the use of low-energy(energy-efficient) buildings as an essential tool for supporting SG plans that reduce demand for suburban development, such as urban restructuring, mass development, and brownfield reconstruction (Riggs and Chamberlain, 2018). SG supports intensive land-use allocation with a tendency to public transportation, a walkable city, and suitable also for cycling, mixed-land use and various types of housing options (Chrysochoou, Brown et al., 2012). Hankey, and Marshall argue that the shape of the city and the neighbourhood plans play a crucial role in choosing the type of device and traversed distance. Population density, land use, and mass transportation are related to per capita travel (Hankey and Marshall, 2010).
Space SyntaxThe space syntax theory is used to create a network-driven graph of the area, which means that the axes are used to represent the urban road (Ren, 2017). Space syntax is a method for understanding the spatial configuration so that the logic of the social factors causing them can also be distinguished (Hillier, B. and Vaughan, 2007). Space syntax is a well-known method for analysing space in terms of architecture, but in its evolution, it has been focused on the human, social, economic, and environmental aspects (Penchev, 2017) Space syntax is a concept, and method that has been developed primarily in the fields of urban design and architecture to understand the impact of the spatial configuration of urban areas and buildings on people’s movement (Koohsari, Owen et al., 2016). The main benefit of this approach is to support the space through a robust social theory (Karimi, 2018). Each line in the map is represented as a node in a graph, with each intersection between lines represented as a link in the graph. In this way, configurational models reverse the network's description by the conventional traffic model, in which road intersections are the nodes and street segments the links (Penn, Hillier et al., 1998).
The variables derived from the space syntax method include space arrangement, integration, selection, connectivity, control, and depth. In the present study, as needed, two parameters, connectivity, and integration, were studied.
Connectivity degreeMeasures the number of branches related to a space without an intermediary (Al-Sayed, Turner et al., 2014). The connectivity degree is the variable value that is measured through the DEPTHMAP software, indicating the number of elements that are connected to a specific part (Monokrousou and Giannopoulou, 2016). The number of direct connections to other ways or spaces is called connectivity (Sadek and Shepley, 2016).
IntegrationIntegration represents the degree of integrity of the element's spacing with all other elements in the entire system (Monokrousou and Giannopoulou, 2016). This indicator shows how a space is connected to all other spaces in a system. For example, a corridor with high integrity means that it is fully connected to all other corridors in a given plan, and vice versa (Sadek and Shepley, 2016). Integrity is also called availability, a variable that refers to how a space is communicated with other spaces around it. It is also a critical parameter that leads to an understanding of the relationships between users and urban space. This can be used to predict the potential of meetings in space because it directly relates to the presence of people in a location. The more people appear in space, the greater integration is shown in space (Dettlaff, 2014). A higher integration value for a street segment means fewer turns are required to reach the part from other streets within the network (Koohsari, Oka et al., 2019). Spatial integration measures the mean depth in a graph where each node is an axial line, and each intersection between lines is represented as an edge linking those nodes (Penn, 2003).
The study area in this article is Bojnourd, which is located 250 km of the northwest of Mashhad, Iran, 57 ° 'longitude and 20 minutes, 37 ° latitude and 28 minutes in a mean elevation of 1070 m above sea level, almost in the geographical centre of the province (Naqsh, 2015). According to the 2016 census, the city's population is about 324,083 people (Iran, 2016). Also, the most considerable percentage of the city's area is for residential use, which includes 27.5% of the city (785.6 ha). Besides, the lowest rate relates to urban facilities and equipment, which accounts for 1.8% of the entire town (1.50 hectares) (Naqsh, 2015).
Identification and selection of studied districtsTo sort and classify urban districts, often more than ten factors and characteristics are used to differentiate urban districts. These factors, including formation time, rate of formation, connection networks, population density, urbanization rate, land use composition, environmental balance, the establishment of urban functions, physical coherence, coordination of the constituent elements of the district, and the building density (Roozkhosh, Molavi et al., 2020).In this study, using the selection and combination of several factors from among the factors mentioned above,, which are the base of the analogy and separation of the districts, and by considering the maps related to the historical evolution of city growth, the physical body of Bojnourd is divided into the three districts of old, middle, and outer (Figure 2 and Figure 3). Each of these districts has characteristics, problems and issues, facilities, and limitations for the future development of the city (Ziari, 2012). After recognizing the types of urban districts in Bojnourd, three regions were selected from each of the different kinds of old, middle, and outer (new) districts.

Source: (Ziari, 2012)

After choosing the studied districts, the three districts were measured with three leading indicators of SG (mixed-land use, walkability, and public transportation).
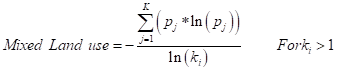
According to assessments and available data, 11 land uses have been considered and surveyed: administrative, commercial, residential, commercial, residential, tourism, religious, educational (including higher education, primary school, high school, technical and vocational), facilities, and equipment, social-cultural, parking, recreation (including green spaces and parks) have been considered and surveyed. Regarding calculating the mixed-land use in each district, the Shannon entropy formula was used as the equation 1:
 ……………(1)
In this case, pj refers to the ratio of land use j to the total space of district i. Ki is equal to the number of different land-uses in the district of i. Also, if ki is equal to 1, the value of this index is considered zero. In this research, as a total, eleven land uses are considered as mentioned above.
The total space of the old urban district is equal to 461667.94, the middle-era urban district is 528684.19, and the new developmental district is 827015.52 m2. Using GIS software and land-use maps of the selected districts, the space usage of the land use in the three studied districts was obtained (Table 1).
| Land Use \ District | Old District | Middle District | New District |
|---|---|---|---|
| Commercial | 45183.2 | 22094.2 | 292.69 |
| Residential | 263391.2 | 383712.7 | 663046.59 |
| Recreational | 4820.1 | 2186.03 | 75389.83 |
| Administrative | 17281.9 | 5129.6 | 0 |
| Facilities and Equipment | 14116.8 | 449.6 | 0 |
| Parking | 2224.5 | 0 | 0 |
| Educational | 10817.8 | 9142.5 | 52480.25 |
| Religious | 5510.9 | 3307.6 | 0 |
| Commercial-Residential | 21375.6 | 23822.1 | 0 |
| Glob trotting-Catering | 1890.1 | 1300.6 | 0 |
| Social-Cultural | 1724.5 | 823.8 | 1677.22 |
According to the Shannon entropy formula, the mixed-land use rate in three studied districts was calculated and the results are equal to (Table 2):
| District | Mixed Land Use |
|---|---|
| Old | 0.5908 |
| Middle | 0.2915 |
| New | 0.2441 |
According to reliable scientific studies and field experts, four criteria and 22 sub-criteria were considered for studying and measuring walkability (Table 3). To quantitatively calculate the given sub-criteria, some indicators were prepared through a questionnaire. Other criteria for the density of intersections, construction, the population were also calculated through the density formula, which is the ratio of the parameter to the surface. The integration and connectivity parameters were calculated using the Depth map software. In the next step, the hieratical comparison between the criteria was utilized for each area by using the ANP method and ten experts’ opinions. The Topsis method was then used to rank the districts in terms of walkability. The table below shows the Topsis Decision Matrix, which includes the weight of the criteria that had been derived from the ANP method and the resulting data for each criterion in each district (Table 3).
| Criterion | Matrix (sub-criteria) | Old urban district | Middle-era urban district | New urban district | Criteria Type | Weighting with ANP | |||
|---|---|---|---|---|---|---|---|---|---|
| Public transportation | Connectivity | 17.59 | 5.92 | 5.4 | positive | 0/288 | |||
| Intersections density | 0.0000238 | 0.0000226 | 0.0000367 | positive | 0/083 | ||||
| The density of the length of the streets | 0.0092 | 0/0101 | 0.009 | positive | 0/091 | ||||
| The degree of access to public transport | 3/27 | 2/51 | 2/75 | positive | 0/201 | ||||
| The manner of accessible public transport | 3/35 | 2/94 | 3/08 | positive | 0/082 | ||||
| Integration | 1/95 | 1/87 | 1/69 | positive | 0/225 | ||||
| The quality of public transportation | 2/55 | 2/08 | 2/51 | positive | 0/026 | ||||
| Density | Population density | 0/0263 | 0/0149 | 0/0196 | positive | 0/551 | |||
| Building Density | 0/313 | 0/254 | 0/095 | positive | 0/448 | ||||
| Social security | Street Lighting | 3/02 | 3/12 | 2/88 | positive | 0/331 | |||
| Ruined buildings | 3/02 | 2/07 | 1/48 | negative | 0/249 | ||||
| No disturbance | 2/97 | 4/01 | 4/02 | positive | 0/418 | ||||
| Quality of the urban environment | Mixed-land use | 3/61 | 3/4 | 2/82 | positive | 0/473 | |||
| Unpleasant odor | 2/87 | 2/27 | 1/61 | negative | 0/058 | ||||
| Garbage collection | 3/3 | 2/87 | 3/57 | positive | 0/074 | ||||
| Access to urban furniture | 2/88 | 2/88 | 2/35 | positive | 0/051 | ||||
| Access to recreational and sports facilities | 2/3 | 2/42 | 2/15 | positive | 0/047 | ||||
| Failure to dispose of surface waters | 3/41 | 2/37 | 1/95 | negative | 0/021 | ||||
| Enough green space | 3/24 | 3 | 1/98 | positive | 0/128 | ||||
| Art and street activities | 1/85 | 2/37 | 1/47 | positive | 0/017 | ||||
| The quality of urban furniture | 2/92 | 2/8 | 1/78 | positive | 0/013 | ||||
| Spending leisure time | 2/21 | 2/61 | 2/58 | positive | 0/112 | ||||
According to the table above, the decision-making matrix was created, and after normalizing the data, the weighing operation was performed on a normalized matrix. Then the positive and negative ideal solutions were determined. The table below shows the distance from the worst and best solution calculated by the formula below:
Determining the distance between the i-th alternative from the ideal alternative (the highest performance of each indicator), which is represented by (A*). (Equation 2)
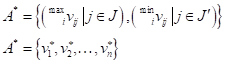 ……………………………… (2)
It is determining the distance between the i-th minimum alternative (the lowest performance of each indicator), which is represented by (A-).
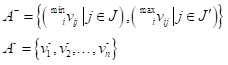 ………………………………(3)
In the equation above, vij equals the product of the standard values of each index in its weights. Once the optimal solution for each criterion was found, the distance of each of the districts was determined from the ideal positive and negative solutions. Finally, the district rating for the pedestrian function is shown in Table 4.
| District | Coefficient of proximity |
|---|---|
| Old | 0.7423 |
| Middle | 0.4385 |
| New | 0.3509 |
In this section, as in the above case, concerning the studies carried out and the use of literature reviews, criteria for measuring public transportation, which contain two criteria and twelve sub-criteria, were taken into considered (Table 5). The criteria were quantified through questionnaires. To quantitatively calculate the given sub-criteria, the indicators were prepared through a questionnaire and surveyed. To calculate and classify the access rate to the public transportation index in the districts, the ANP-Topsis method was used. The table below shows the Topsis Decision Matrix, which includes the weight of the criteria derived from the ANP method and the resulting data for each criterion in districts.
| Criterion | Matrix (sub-criteria) | old urban district | middle-era urban district | New urban district | Criteria Type | Weight with ANP | |
|---|---|---|---|---|---|---|---|
| The direction to public transportation | Path attritions | 2.58 | 2.48 | 2.14 | positive | 0.014 | |
| Path convenience | 3.08 | 3.34 | 3.35 | positive | 0.06 | ||
| Path continuity | 2.55 | 3.11 | 2.94 | positive | 0.214 | ||
| Route readability | 3.1 | 3.54 | 2.77 | positive | 0.246 | ||
| Path safety | 3.07 | 3.25 | 3.78 | positive | 0.054 | ||
| Path security | 3.4 | 3.67 | 3.45 | positive | 0.115 | ||
| Pedestrian access to public transportation | 3.35 | 2.94 | 3.08 | positive | 0.292 | ||
| Public transportation status | General vehicle speed | 2.9 | 2.9 | 3.75 | positive | 0.123 | |
| being economical | 3.04 | 3.32 | 3.17 | positive | 0.116 | ||
| The quality of public transportation | 2.55 | 2.08 | 2.51 | positive | 0.05 | ||
| Order and coordination of the public transport | 2.85 | 2.3 | 3.07 | positive | 0.038 | ||
| Access to public transport | 3.27 | 2.51 | 2.75 | positive | 0.671 | ||
According to the table above, the decision-making matrix was created, and after normalizing the data, the weighing operation was performed on a normalized matrix. Then the positive and negative ideal solutions were determined. The table below shows the distance from the worst and best solution calculated by the previously mentioned formula (2 and 3). At this stage, district ranking in terms of access to public transportation (Table 6) was calculated through equations (2,3) that mentioned above.
| District | Coefficient of proximity |
|---|---|
| Old | 0.7373 |
| New | 0.35 |
| Middle | 0.2863 |
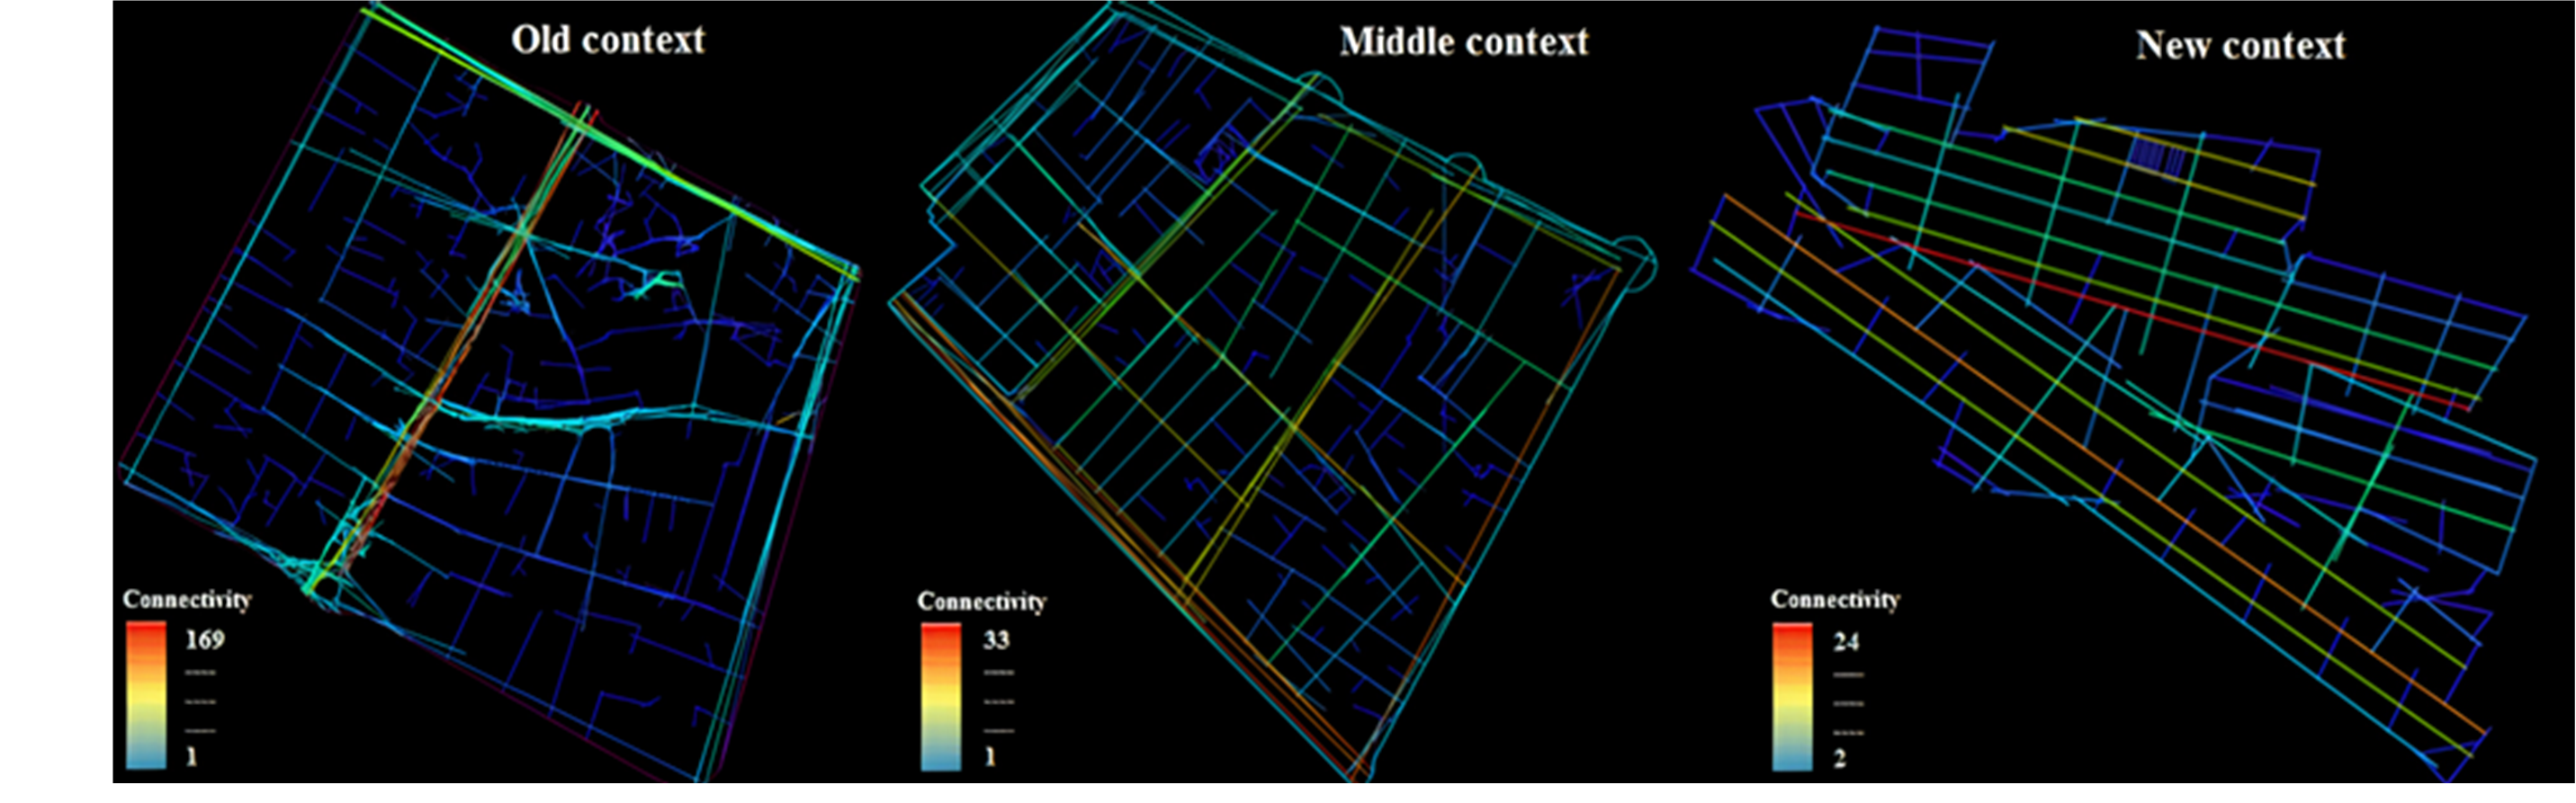
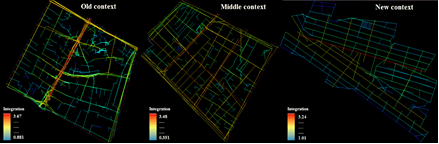
By applying the UCL Depthmap software, the axial map of the three districts, which were depicted in the Auto CAD software were surveyed, the integration, as well as connectivity of the districts, were calculated, and the results are as follows: Table 7, Figure 4 and Figure 5.
|
Indicators of the syntax of the examined district space |
Connectivity | Integration | ||||
|---|---|---|---|---|---|---|
| Maximum amount | Minimum amount | The normalized average value | Maximum amount | Minimum amount | The normalized average value | |
| Old district | 106 | 1 | 1.15 | 3.67 | 0.881 | 0.85 |
| Middle district | 33 | 1 | -0.53 | 3.48 | 0.351 | 0.25 |
| New district | 23 | 2 | -0.61 | 3.24 | 1.01 | -1.10 |
According to the studies and the results of Table 2, Table 3, Table 4, Table 5, and Table 6 and comparing these results with the degree of connectivity and integration in the three studied districts (Table 7), the internal relationship between these indicators has been examined. The following table (Table 8) illustrates this relationship more clearly.
| Districts | Connectivity | Integration | Access to public transportation | walkability | mixed land uses |
|---|---|---|---|---|---|
| Old district | 1.15 | 0.85 | 0.7373 | 0.7423 | 0.5908 |
| Middle district | -0.53 | 0.25 | 0.35 | 0.4385 | 0.2915 |
| New district | -0.61 | -1.10 | 0.2863 | 0.3509 | 0.2441 |
As shown in the table above, the old, middle, and new districts have a higher degree of integration and connectivity, respectively. On the other hand, the amount of walkability and mixed land uses have a similar process to the indicators of the theory of space syntax, which in a way might indicate that by increasing the degree of integration and connectivity in all three contexts in this study, the amount of pedestrianism and distribution of land uses has also increased in those districts. Looking at Table 8, it is also clear that this relationship has not been seen between access to public transportation index and space syntax theory indicators in the areas studied in this study.
Based on Table 8, using the Pearson Sample Correlation Coefficient (Equation 4), the correlation between the Smart Growth principles indicators and Space Syntax indicators was analyzed.
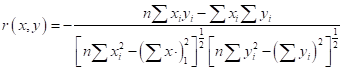 …………(4)
| Connectivity | Integration | ||||
|---|---|---|---|---|---|
| Access to public transportation | walkability | mixed land uses | Access to public transportation | walkability | mixed land uses |
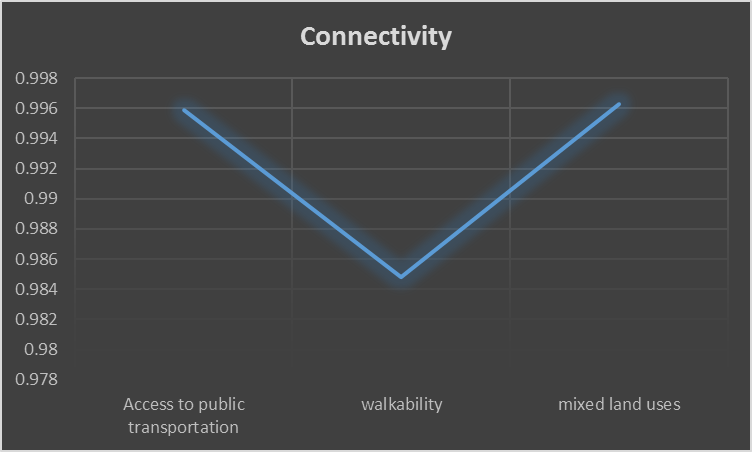
| 0.995898 | 0.984792 | 0.996291 | 0.818932 | 0.864203985 | 0.816369296 |
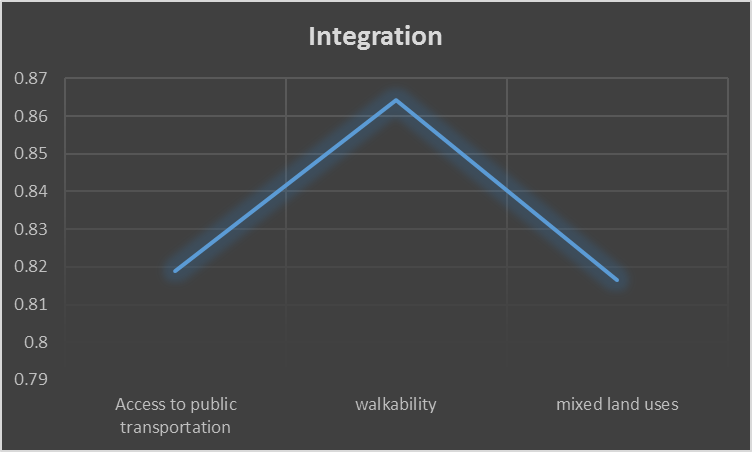
Table 9 shows the relatively high correlation between connectivity index and mixed land use, access to public transportation, and walkability indices, respectively. In addition, the integration index has a relatively high correlation with the walkability index. Also, the indicators of access to public transportation and mixed land use have the second and third ranks, respectively, in the degree of correlation with the integration index.
In this study, by examining three indicators of walkability, access to public transportation, and mixed land use, as well as calculating the degree of integration and connectivity in three old, middle and new contexts in Bojnourd city, the relationship between smart growth indicators and space syntax indexes is and evaluated. According to the evaluations and the calculation of the correlation between the indicators, it was found that the two indicators of access to public transportation and connectivity have a very high correlation of 0.99, which shows the possibility of an internal relationship between road connectivity and accessibility to public transport. Also, the connectivity index positively correlates with mixed land use and walkability indices in the following degrees (Table 9 and Figure 6).
The integration index also has a positive correlation with all three indicators. Among these, the two walkability and integration indices have a higher correlation than the other two indices (Table 9 and Figure 7), and this indicates that in the studied areas, the integration index is more correlated with the walkability ones. Therefore, in these neighbourhoods, with the increase of interconnection index, the number of pedestrians has increased.
The large difference between the highest and the lowest degree of integration indicates that the city has more heterogeneous characteristics. It also indicates that there are isolated and separate points (with great depth) from the city structure, and this creates isolated and deeper spaces and causes spatial separation. Emphasizing the relationship between physical and social segregation, Donald Applard says that neighbourhoods that are physically isolated also encourage social activities in isolation (Jabari, 2013).In all three tissues studied, there is no sharp difference between the minimum and maximum amount of integration, which indicates that there is no severe isolation of part of the contexts, and the class and racial differences among the inhabitants. However, the old district has more appropriate integration values than the other two districts, which indicates the greater connection and correlation of this neighbourhood with its immediate area and increases the indicators of access to public transportation, walkability, and mixed land use in this district.
Conceptualization, F.R., M.M. and A.S.; methodology, F.R.; software, F.R.; investigation, F.R., M.M. and A.S.; resources, F.R.; data curation, F.R.; writing—original draft preparation, F.R., M.M. and A.S.; writing—review and editing, F.R., M.M. and A.S.; supervision, F.R. All authors have read and agreed to the published version of the manuscript.
The authors declare that they have no conflicts of interest regarding the publication of the paper.
This research did not receive any specific grant from funding agencies in the public, commercial or not-for-profit sectors. The authors thank the managing editor and anonymous referees for theirinvaluable comments on an earlier version of the manuscript.