Planning Assessment
Does City Size Affect COVID-19 Spread and Policy Measures?
The case of Riyadh Province, Saudi Arabia

2023 Volume 11 Issue 3 Pages 228-243
Details
2023 Volume 11 Issue 3 Pages 228-243
The Saudi Government has spared no effort to combat the COVID-19 outbreak since its declaration by the (WHO) as a worldwide pandemic on March 11, 2020. Many restrictive policy measures were deployed. They range from social distancing, to business shutdown, school and university attendance suspension, and lock-down, etc. The way the epidemic spreads in big cities and smaller towns within the region has not yet been examined within the Saudi context. This paper explores the differential spreading of the viral infection between the large city of Riyadh and its small towns in its vicinity. The main research question consists of unrevealing whether the pandemic follows a similar pattern of COVID-19 transmission within populations of urban settings of different sizes or not. To that end, the study used data provided by the Saudi Ministry of Health (MoH) and Google Community Mobility Reports to examine the spread of the virus and the effectiveness of the policies adopted to halt its transmission. For the purpose of comparison, the basic reproduction measure (R0) was calculated for both settings. For the efficiency of policies implemented, Google Mobility Data was used to reveal how Riyadh population mobility patterns were affected by these policies. Google Mobility Data was compared to the evolution of COVID-19 confirmed cases from March 9, 2020 to May 28, 2021.
Being a highly infectious disease spreading at an accelerating rate within a population, the novel coronavirus (COVID-19) has a basic reproduction number (R0) estimated somewhere between 2.0 and 3.5 (Ryu and Chun. 2020; Rothe, Schunk, et al., 2020). This has led the World Health Organization (WHO) to declare this outbreak as a pandemic on March 11, 2020 (WHO, 2020). The first confirmed case of COVID-19 in Saudi Arabia was detected in Qatif at the Eastern Province on March 2, 2020 (Al-Khani, Abdullah, et al., 2020). The Saudi Government was swift to impose a lockdown on the whole town in an attempt to stop the spread of the virus to other areas. Shortly after, a wide range of preventive precautionary measures were deployed nationwide to contain the pandemic. Among such measures are the suspension of Umrah rituals and school and university attendance, cancellation of both domestic and international flights, and ban of sporting events and public or social gatherings (Saudi Press Agency, 2020a). Places of worship like mosques were set to close for daily prayers and even for Friday’s appeals. Inter-city movements were also halted, in an attempt to minimize any chance of transmitting the virus from one city to another (Al-Tawfiq and Memish, 2020).
The Saudi prompt response to introduce the aforementioned radical measures seem to have had some positive impacts as shown by the low case fatality rate among COVID-19 patients, estimated at 1.6% compared to 2.04% internationally (World Health Organization, 2020). Undoubtedly, the combined effects of these highly restrictive and radical measures seem to have limited to a great extent, the spread of COVID-19 outbreak among Saudi residents.
Based on a review of 23 studies on the impact of travel restrictions on COVID-19 outbreak, Mateus, Otete, et al., (2014) found that such restrictions could only delay the spread of the epidemic something between one week and two months, but does not lead to its containment. Other studies tend to focus on the adverse effects of such measures as they hamper countries from combatting effectively the spread of the epidemic, while causing serious difficulties to travel and tourism industries (Nuzzo, Cicero, et al., 2014; Vaidya, Herten-Crabb, et al., 2020). Needless to say, that the preventive precautionary measures like businesses shutdown, suspension of attendance at nonessential office work at government agencies, school and university closures have led to widespread unemployment and economic hardships as many activities have been severely impacted (Nicola, Alsafi, et al., 2020; Währungsfonds, 2020).
To date, assessments of policy effectiveness in combatting COVID-19 tend to focus on single measures like the effect of travel suspension (Chinazzi, Davis, et al., 2020; Grépin, Ho, et al., 2020), school closure (Flaxman, Mishra, et al., 2020), and social distancing (Arenas, Cota, et al., 2020; Anderson, Saman, et al., 2015). The present study attempts to evaluate the effectiveness of the whole bundle of policy measures combined rather than on each measure taken separately.
Moreover, the focus of most of the research work on COVID-19 impacts has been more on residents of larger cities than those of small towns (Mueller, McConnell et al., 2021). In a recent article, The Economist (2020) asserts that pandemics tend to hit big cities harder than small and medium-sized towns. If the size, density, and social interactions are critical factors for a city’s economic growth, they are also their main reasons for the spread of epidemics. There is ample evidence to suggest that intensely populated neighborhoods in larger cities tend to be more vulnerable to the spread of coronavirus pandemic as is the case with London and New York denser neighborhoods (Cortwright, 2020; Furman Centre, 2020; Kolko, 2020). Smaller towns and lower density locations however, tend to be less prone to COVID-19 outbreak. Stier, Berman et al. (2020) found a strong correlation between COVID-19 confirmed cases and city size. City size and, hence, density concentrate exposure to viral diseases like coronavirus. If size and density are an important element for city life, they are also its own kryptonite as they are the conduit of viral epidemics. This study attempts to examine the association between city size and density with differentials in coronavirus spread in the context of a Saudi province with one large city and several small towns distributed around.
Riyadh Province has one very large city (Riyadh) with a population of over 5 million inhabitants and many smaller towns with varying sizes, scattered in the region. The second town in ranking is Al-Kharj with a population of only 376325 residents. The sizes of the rest of the remaining towns are much smaller. A town is classified of smaller size if it has a population of 100,000 or less within a continuous built-up area (OECD, 2022; Dijkstra, Hamilton, et al. 2020). It must be noted that a Governorate in the Saudi system is a delimited administrative area containing one or more urban settlements. Al-Kharj Governorate for instance contains Al-Kharj town with a population of about 60,000 people (Latlong.net) and Al-Dalam town with 35800 people (City-facts) and many other human settlements of smaller size (Table 1).
| Governorate | Inhabitants | Governorate | Inhabitants | Governorate | Inhabitants |
|---|---|---|---|---|---|
| Riyadh | 5236901 | Aflaj | 68201 | Muzahmiya | 39865 |
| Deryiah | 73668 | Zulfi | 69294 | Ramah | 28055 |
| AlKahrj | 376325 | Shaqraa | 40541 | Tadeq | 17165 |
| Dawadmi | 217305 | Huta Beni Tamim | 43300 | Hurimla | 15324 |
| Majmaa | 133285 | Afif | 77978 | Hrieq | 14750 |
| Qaiyiah | 126161 | Sulail | 36383 | Ghat | 14405 |
| Wadi Dawasir | 106152 | Darma | 24429 | Mrat | 17659 |
Source: General Authority of Statistics of Saudi Arabia, 2017.
To explore the coronavirus spread differentials between the larger city of Riyadh and the small towns in its region, the study adopted a method often used in epidemiological studies to describe and measure the spread of an infectious disease. It conducted a retrospective analysis of the transmission of COVID-19 to evaluate the pattern of spread and mortality rate in Riyadh Province. The method consists of calculating the basic reproductive number (R0), also known as “R-naught”, to examine the initial rate of transmissibility of the virus within a susceptible host population at the onset of an infection outbreak (Heesterbeek and Dietz, 1996; Wallinga and Lipsitch, 2006; Cori, Ferguson, et al. 2013; Huang, Yeming, et al., 2020; Lai, Nick, et al., 2020; Omori, Ryota, et al., 2020; Yang, Zhiqiang, et al., 2020). Not only does this metric of “R-naught” show how widespread the viral infection, it also sheds light on whether the measures taken at the onset of the epidemic were successful to limit its spread or not. Calculating the value of R0 for different settings, will not only serve to compare the way the epidemic develops within different populations and settings, but also to gauge into the effectiveness of the deployed preventive measures to control the corona outbreak.
The higher the contact rate between infected and non-infected individuals the higher the transmission potential. A value of R0 higher than the epidemic threshold of 1 (Heffernan, Smith, et al., 2005), would indicate that the outbreak is spreading at an accelerating rate within a population. If R0 is lower than 1, it would mean that the epidemic is on the process of shrinking with time, and the virus infection will eventually die out (Watson, FitzJohn, et al., 2019). The infection is set to be endemic and persisting over time if R equals 1.
To compute R0, the study adopted the mathematical model that Gu, Jiang, et al. (2020) developed to have an understanding about the spread and severity of COVID-19 outbreak within a community. The model used the following equation to calculate the basic reproduction number (R0):
where β the contamination rate, α the quarantine efficiency rate, E(T) the incubation period of the virus, and θ the confirmation rate. Gu, Jiang, et al. (2020) calibrated these parameters and determined the values of β, α & θ to range from 0 to 1. Based on several studies in many parts of the world, E(T), the mean incubation period between the infection and showing the symptoms of corona virus at the onset of an epidemic, was estimated roughly at 7.5 days (Shao, Cheng, et al., 2020; Li, Xuhua, et al. 2020). This estimate is consistent with what the Saudi Ministry of Health (MoH) has finally set as a self-confinement period for any suspected case to know whether he/she is contaminated or not. A mobile application known as Tabaud (meaning safety distance) was developed. This application is set to notify anyone who comes in contact or even two meters closer to people infected with coronavirus. In this situation, the Tabaud application signals instantly on the person’s smart device that he/she is a suspected case. The case is also immediately reported to health authorities in the area. The patient must undergo a compulsory self-confinement for at least a week to be able to run a diagnostic test to see if he/she is positive or negative. This lends support and validity to adopting 7.5 days for the parameter E(T), the incubation period in Equation (1).
Similarly, the other parameters were computed following the simulation model developed by Gu, Jiang, et al. (2020). Riyadh has adopted a very strict policy to combat the spread of the pandemic. It had a larger number of screened individuals compared to any other place in the country (Khan, Alahdal, et al., 2021). Therefore, the study adopted for Riyadh, the major city, the parameter values of the variant D of the model where very strong measures were deployed. In this case the values for (β, θ, α) were respectively (0.34; 0.62; 0.5). If mass screening programs were launched in Riyadh for early case detection, and then isolation to prevent the spread of the virus, this was not the case in smaller towns as they present lower healthcare capacity due to lack of adequate and sufficient resources and personnel. As a result, there has been some difficulties and disruptions particularly in mass screening tests, confirmation rates, imposing stay-at-home orders or confinements. Such disparities between major cities and small towns in healthcare capacity, have led Riyadh to detect nearly a quarter of all of positive cases in the country (23%) as early as March 2020 (Alharbi, Rabbani, et al., 2021). Many researchers have found health discrepancies between major cities and smaller towns in testing and health care capacity (Singh and Siahpush, 2013; Henning-Smith, Tuttle, et al., 2020; Anderson, Saman, et al., 2015). For this reason, the variant E of the simulation model was assumed as relevant since it considers the above-mentioned adversities in applying the measures to limit the virus spread. Hence, the parameter values for smaller towns of β, θ, and α were 0.25; 0.62; and 0.4 respectively.
Data collectionAs far as the data collection of COVID-19 cases and mortality rates are concerned, the official data published by the Saudi Ministry of Health was used to record the number of cases daily, starting from March 2020 ( https://Covid19.cdc.gov.sa/daily-updates/ accessed on 19 May 2021). The data about the number of cases reported in the major city of Riyadh and the small towns around, were recorded in an Excel file. The recording was performed from March 2020, when the first case was reported in Riyadh, until May 2021. Since daily records were in many instances missing for small towns, the study used the average monthly cases to draw the curves for both settings.
With regard to the measures taken to limit the spread of coronavirus like social distancing, school closure, business shutdown, lockdown, and stay-at-home orders, they all tend to impact population mobility patterns. Here comes the utility of the second set of data the study used to examine the changing mobility patterns and its association with COVID-19 infections. These datasets consist of the Google Community Mobility Reports released for Riyadh. The analysis of these datasets is undertaken under the contention that any impact on mobility patterns will have some influence on coronavirus transmissibility within a community. For the sake of correspondence between the data provided by the Saudi Ministry of Health and Google Mobility data, the same period ranging from March 9, 2020 to May 28, 2021 was used for both datasets.
Google developed an algorithm to get aggregated anonymized data on population mobility and location. It collected data from smart devices using its applications. Google Community Mobility data indicate locations where contacts can take place between infected cases and susceptible hosts within a population. Google reports provide data on human activities and mobility patterns to places of retail and recreation, groceries and pharmacies, parks, transit stations, workplaces, and residential areas. The lesser the number of people going out for parks, restaurants, groceries, shopping and workplaces the lower the number of infectious occurrences and, hence, the lower the R0 value and vice versa. The relevant webpage to download the daily changes on mobility data is https://www.google.com/covid19/mobility/.
The values observed in these Google reports are indicative of percentage change values relative to a baseline value. The baseline corresponds to the period spanning from January 3rd to February 6th 2020, just prior to the advent of COVID-19 disease outbreak. An examination of Google percentage changes comparative to the baseline values is indicative of the extent to which government restrictive measures were observed by Riyadh residents. This would allow to explore which measures were more effective rather than others? The following section will first discuss the findings about the coronavirus spread differentials between the big city of Riyadh and its small towns. The effectiveness of the restrictive measures to control the pandemic will be explored later.
To investigate the coronavirus spread differentials between Riyadh, the major city, and the small towns scattered around, the initial basic reproduction number (R0) was calculated to describe the speed and spread of COVID-19 for both settings. For that purpose, the Gu, Jiang, et al. (2020) equation stated above was used and, hence, (R0) for Riyadh would be as follows:
The parameters β, α & θ for Riyadh were estimated 0.34, 0.62 and 0.5 respectively. The values of these parameters were drawn from Gu, Jiang, et al. (2020) model simulation for which very strong measures were deployed to contain the pandemic. The higher rate of contamination in Riyadh is due to the fact that many labour expats live in very crowded areas where social distancing is quite difficult to observe. Around 70 to 80% of confirmed cases were among these low wage workers (Ministry of Health Saudi Arabia, 2020a; Saudi Press Agency, 2020b). The relative higher density in Riyadh City compared to the sparse settlements of small towns in the region is another factor leading to higher contamination rate. Similarly, the quarantine rate would be again relatively higher for Riyadh than for small towns. The large city has more material and human resources to impose social distancing and self-confinement than small towns. Therefore, Riyadh quarantine rate would be (α = 0.62) (Gu, Jiang, et al., 2020).
This result seems to lend support to findings of other research works like the one undertaken by Aletreby, Alharthy, et al. (2020) on Saudi Arabia in which (R0) was estimated at 2.2. Similarly, Ahmad (2020) argued that the value of basic reproduction number in the case of Saudi Arabia, R0 ranged between 0.60 and 2.78 depending on the estimation of the parameters whose values are affected by how strict are the measures adopted. Along the same line of thought, Agosto, Campmas, et al. (2021) used more or less similar parameter values for the scenario with very strong measures as in the case of Riyadh, and a scenario with mild measures as in smaller towns.
Being a highly infectious viral disease, the basic reproduction number (R0) of COVID-19 is usually found to range between 2.0 and 3.5 (Ryu, Chun, et al. 2020; Rothe, Schunk, et al., 2020) which is quite consistent with the results of the present study.
As far as the small towns in Riyadh province are concerned, the values of the parameters (β, α & θ) need to be reviewed, since the urban situation and the way of life in such towns is slightly different from that of the big city. There is little crowding of low wage expat laborers in high numbers as is the case in a big city like Riyadh. The contamination rate for smaller towns would therefore, be slightly lower (β' = 0.25). As the same directives were applied all over the country, the quarantine rate would be quite the same as in the big city (α' = 0.62). The confirmation rate however, would be slightly lower as smaller towns sanitary infrastructure and testing practices are not as developed as in the big city. Smaller towns tend also to suffer from medical and paramedical staff shortages. All these factors combined would lead to a lesser rate of confirmation (θ' = 0.40).
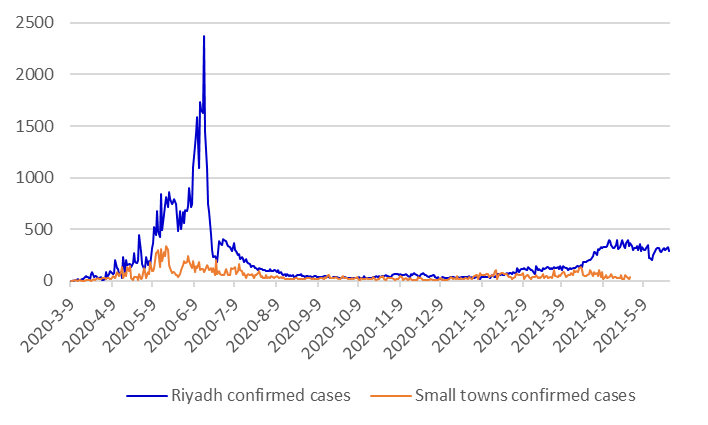
Both R0 for Riyadh City and for the small towns around it, are much higher than 1 which explains the rampant corona confirmed cases at the onset of the epidemic infection. However, the larger city with R0=2.25, shows a much higher exponential increase of the speed and severity of the pandemic spread than the smaller towns with R0=1.78. This pattern is again clearly shown by the graphs representing the evolution of the confirmed positive case numbers in both settings. Figure 1 indicates a higher spike for Riyadh city daily case numbers during the first three months of the infection. The graph representing daily infections for small towns in the province however, exhibits a relatively much lower increase.
The differences between Saudi major cities and small towns in terms of health infrastructure and staffing have led to differences in infection case screening and reporting. The confirmed cases were registered on a day-to-day basis in Riyadh. No smaller town however, has manged to report its daily records of infections and deaths to the main data centre on time (Ministry of Health Saudi Arabia, 2021a). For the consistency of case reporting, and for the sake of comparison, graphs were constructed for summarized monthly infections and deaths for Riyadh and its smaller towns. Although a similar pattern of higher infection cases is revealed, the Riyadh death curve shows slightly higher case fatality for the months of June through July 2020, the period during which both settings have known a surge of COVID-19 infections (Figure 2).

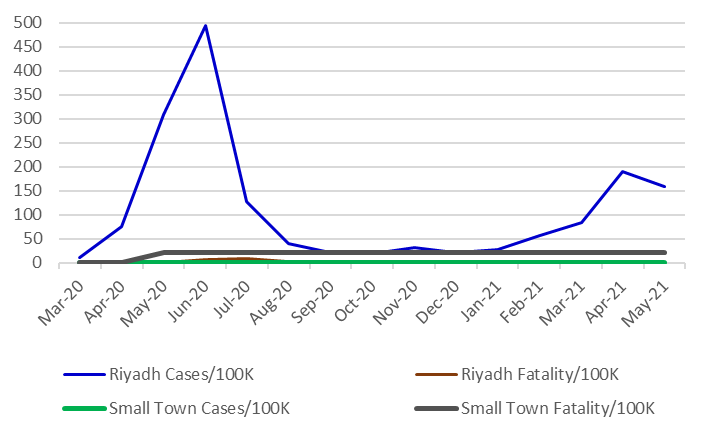
The other measure to examine the virus spread in Riyadh city and in its smaller towns consists of comparing the number of monthly case infections and case fatalities per 100,000 inhabitants. Here again, the differences between the two settings are clear. They tend to corroborate the previous findings. This suggests that the larger city of Riyadh was hit much harder by the corona outbreak than its smaller towns (Figure 3). During the first three months, Riyadh city has reached its peak around the first half of June where the case infection rate per 100,000 inhabitants was slightly less than 500 per 100,000 per month. In the case of smaller towns however, it did not exceed 50 cases per 100,000 per month. Although both curves have flattened after reaching their peaks, the larger city still shows slightly higher rate throughout the following months This is an indication that the larger city of Riyadh tends to show some vulnerability relative to its smaller towns in the province. The relative higher density in Riyadh in comparison to its smaller towns, and the larger number of low wage expats living in dense neighbourhoods in Riyadh, may be behind this surge of cases in the big city. Algarni, Alzahrani, et al. (2021) reported that more than 80% of case infections were among non-Saudi residents in the first few months of the pandemic.
With regard to the case fatality rate (CFR), no striking differences were shown for both area settings, but the period of June to July 2020. Boretti (2020) reported a very low case fatality rate for Saudi Arabia (CFR = 1.09%). This rate is 15 times larger for the United Kingdom (CFR=15%). This suggests the effectiveness of the policy measures adopted by Saudi authorities to control the pandemic.
The initiation of a campaign of mass screening of suspected COVID-19 cases and their close contacts, particularly in densely populated neighbourhoods with low wage laborers, in addition to the enforced general lockdown (Saudi Press Agency, 2020b; Ministry of Health Saudi Arabia, 2020a), could well be the main factors that have led to significantly slow down both the infection and fatality rates.
The larger city presents a relatively higher density than the small towns in its region ( https://ainpedia.com/article/ accessed on October 6 2022). The likelihood of coming into contact with potential infectious individuals would therefore, be much higher in the large city than in smaller towns. Moreover, the big city presents a much higher number of places that can be seen as hot spots for virus contagion, that is places where people come closer to each other as is the case in shopping malls, restaurants, city parks and the like. The higher the number of such hot spots the higher the risk for the transmission and spread of airborne coronavirus within a community. On the contrary, smaller towns do not present the same potential risks as they do not have as many such places where people can come into contact.
Google mobility data analysisThe high prevalence of COVID-19 infection incidences in the big city of Riyadh, may be largely due to the densely populated neighborhoods where low wage expat laborers tend to live in crowded housing. Density favors higher social interaction and brings people in close physical proximity and face-to-face contacts which favor airborne virus transmission (Bhadra, Mukherjee, et al., 2021). This suggests that coronavirus outbreak impacts differently larger cities and small towns. In their research, Holden and Kenway (2020) found a positive association between crowding and coronavirus cases. This finding lends support to the assertion that poorer crowded expat districts tend to have high prevalence of COVID-19 cases than lower density richer neighborhoods (Delamater, Street, et al., 2019; Souch and Cossman, 2020).
To examine the effectiveness of these measures, the study used the data provided by Google Community Mobility Reports for Riyadh. This analysis is adopted under the contention that higher transmission rates of COVID-19 outbreak depend to a large extent on higher contact rates of people which are in turn, highly related to population mobility to places of interest. It is precisely to reduce population mobility and, hence, to lower the rate of contact between infected individuals and the susceptible host population that the Saudi government deployed a whole bunch of restrictive precautionary measures like social distancing, home confinement, university and school closures, business shutdown, and ban of large public gatherings.
To further elaborate on this point, the Google mobility data allows to compute the times at which changes over time occurred in the trend of COVID-19 occurrences and, hence, changes in population mobility patterns within Riyadh population. When examining the variations of values from baseline of the six categories, it appears that these variations were greater at the onset of the pandemic, then they started to shrink later on, up to May 17 2021. This is a clear indication to some extent, that the preventive measures imposed after the detection of the first confirmed positive case, have considerably limited the spread of COVID-19 in Riyadh.
Figure 4 shows higher values for the residential category which peaked during the lockdown period from May 23 to April 6. This is indicative of a greater adherence of Riyadh population to government ‘stay-at home’ orders. The reverse was revealed for all the other five categories. The ‘Grocery and Pharmacy’ category tends to show some peaks. This can be explained by the fact that people tend to rush to get the needed supplies during the times allowed to do so. Once these restrictive measures were lifted or softened, the graphs get closer to the baseline than at the lockdown period during which the restrictions were sterner. The park category has seen greater demand during periods of lifted restrictions. School closures, online work and public gathering ban have much to do with higher values of the ‘residential’ category.
A closer examination of mobility pattern variations for the six categories in Riyadh from April 11 to May 23, 2021, indicates that each category follows its own pattern. The values of four categories (Transit stations, workplaces, retail and recreation and parks) remained well below the baseline value, whereas two categories (Grocery and pharmacy and residential) showed higher values relative to baseline. The largest lowest value (-36%) relative to baseline, was that of the Transit stations. This is quite understandable since Riyadh is by excellence, a car-oriented city. Although a great public transit project is underway, it is not yet operational. School buses are on standstill as a result of the university and school attendance suspension, corona virus transmission oblige.

When looking at the overall trends of all six categories for the whole period under study, it is clear that at the onset of the pandemic, the government imposed some strict restrictive measures which have led to decreasing infection cases (Figure 5). However, by April and May 2021 some measures were lifted and others softened, a resurgence of increasing infection cases took place.
The second largest lowest value (-9%) in comparison to the baseline was for the workplace category. Many public administrations and private companies have opted to work partly online in compliance with the instruction of the Saudi health authorities. As far as the categories of retail & recreation and parks are concerned, they showed the values of (-4% and -2%) respectively. This may be explained by the fact that people are becoming more inclined to go out to get their basic needs and for some recreation, but not without taking some prudence and precautionary measures. Large public concerts, festivals, and sporting events were totally banned. People were left with not much opportunity for entertainment and recreation but to go to parks and retail shops while adhering to the preventive measures imposed by health authorities.
The remaining two categories that showed a relatively higher values compared to baseline were the grocery and pharmacy category and the residential category values +0.21 and +7% respectively. It must be borne in mind that with the ongoing preventive measures of social distancing, mask wear, public events ban and the like, the population was left with not much to do but to go out to grocery stores for shopping to get the necessary needs. Apart from that, they have little option but to limit their activities to home confinement. If the Google mobility datasets for the residential category inform about stay-at-home activities that are supposed to prevent the transmissibility of corona virus infections, it may in other instances however, lead to the spread of COVID-19 cases as a result of some family meetings, parties or funeral events (Ministry of Health Saudi Arabia, 2021b).

Using data from March 9, 2020 to May 28, 2021, from the Saudi Ministry of Health data centre platform, the study computed monthly average COVID-19 incidence and mortality rates and conducted comparisons between Riyadh large city and the smaller towns in the province. The results indicated greater COVID-19 incidence and fatality rates in the larger City compared to smaller towns around.
The study suggests city size and, hence, density tend to have a strong impact on the rising COVID-19 confirmed cases. Populous urban areas with residents having some social vulnerabilities as is the case with low-wage expatriates in Riyadh, are more likely to be hotspots of cases than small town residents. As the smaller towns present sparsely populated areas, this may have impacted the virus dispersion within their communities. More attention for infection prevention and control efforts should be scaled up in particularly populous areas where vulnerable expat labourers tend to live.
COVID-19 occurrences and spread seem to follow a different pattern within communities living in a major city like Riyadh than in smaller towns. Similar findings were reported in a study on coronavirus incidence by urban-rural classification in the United States (Duca, Coyle, et al., 2020).
If the deployed restrictive measures have had some impact on lessening the speed and severity of COVID-19, they have also had some serious economical and psychological adverse effects on the lives of people and their businesses. The implementation of preventive measures during a pandemic, regardless of the urban area size (large city or small town), may lead to some undesirable consequences. Some measures could be relaxed for small towns so as to save many people from any unwelcome economic and psychological impacts. Many innocuous containment policies like hygienic measures and disease control could be applied for smaller towns instead of harsher restrictive measures like 24-hour curfews, business closure, travel ban and suspension of in site work. A sizeable proportion of smaller town families depend on day-to-day activities like farming and animal husbandry for their livelihood.
The emergence of COVID-19 pandemic should warrant city authorities not to think whether a new pandemic will emerge or not but to get ready to combat it when it happens. Evaluating the effectiveness of the deployed policy measures to mitigate the spread of COVID-19 is thus critical to inform the city’s preparedness response to future pandemics.
Conceptualization, T.L. and A.A.; methodology, T.L. and A.A.; investigation, T.L. and A.A.; data curation, T.L. and A.A.; writing—original draft preparation, T.L. and A.A.; writing—review and editing, T.L. and A.A.; supervision, T.L. and A.A. Both authors have read and agreed to the published version of the manuscript.
The authors declare that they have no conflicts of interest regarding the publication of the paper.
This research was funded by "Researchers Supporting Project number(RSP2023R295), King Saud University, Riyadh, Saudi Arabia.