Abstract
Recently, both the Makassar city government and its residents have encountered difficulties in anticipating and managing street vendors, due largely to unclear policies regarding location regulation. Meanwhile, the proliferation of street vendors has led to the occupation of unplanned trading areas, resulting in increased traffic congestion and a decline in the quality of the urban environment. The presence of street vendors should ideally contribute to the city's mosaic, shaping the city’s image and serving the community's needs, including tourists. This article attempts to address the pressing issues surrounding the creation of a productive and liveable city. The purpose of this study is to develop a model for suitably locating street vendors in Makassar. This article identifies various supportive and inhibiting parameters and subsequently develops them into rules for spatial analysis. These parameters were gathered through interviews with traders, community members, and government officials, and the data was structured using expert choice techniques. Each weighted parameter was used to assess the grid-based land surface using the ArcGIS program. The article proposes a model for suitably locating street vendors, which can be applied to cities similar to Makassar. As a result of spatial data input to the model, potential locations in three districts were identified, falling into three categories. In general, Category 1 comprises 114 grids of the high suitability potential locations that nearly meet all the principles of suitable street vendor workplaces, among 1164 grid locations. Category 2 represents suitable potential locations, and Category 3 denotes low suitability potential locations.
Introduction and Literature Review
Land and people form the foundation of every nation. In urban areas, rapid economic and social development exerts sustained pressure on land demand (Zhou, Zhao, et al., 2017). According to Alves (2021), rapid economic growth in cities often leads to massive relocations of households from other cities and rural areas (Handoyo and Setiawan, 2018). Cities in developing countries, such as Makassar, have experienced rapid growth in recent years, influenced by several significant factors. These include its geographic location as the coastal capital of South Sulawesi Province, government policy, land ownership, land conditions, urban activity functions, urban infrastructure, community characteristics, and the development of modernisation and globalisation (Yuliantari, Hafsari, et al., 2018). These influencing factors include a variety of physical and non-physical factors, as well as internal and external factors that have all played a role in the development of Makassar City. This development is extremely complex and has occurred concurrently.
While the city serves as a hub for various activities on a formal level, the informal level must also be developed. The informal sector consists of diverse activities conducted by various groups with varying levels of income and socio-economic status (Nurany, 2021; Octavia, 2020). Street vending is one type of informal sector work and serves as a simple way for individuals to survive in the city. Certain migrants enter the urban informal sector, which reveals itself to be dynamic, continuously growing, and can even be interpreted as representing the lives of the majority of the urban poor in developing countries (Desti, 2020; Warlina, Yusuf, et al., 2021). However, (Octavia, 2020) notes that although the informal sector is often associated with poverty in developing countries, it is important to note that not everyone who works in the informal sector is poor. According to Kar and Marjit (2009), for relatively unskilled workers who fail to find formal employment, the informal sector offers the only available alternative to involuntary unemployment. This sector's characteristics, such as ease of entry and flexibility in time and place, depending on local resources and the relatively small scale of business (Budi, 2006), are attractive. In the manufacturing sector, micro and small-scale enterprises (MSEs) become the source of income for people with low education, females, and the poor (Gultom, 2014). In Indonesia, a manufacturing survey in 2010 on MSEs showed that MSEs had created jobs for around 6.4 million people. Furthermore, Nguimkeu (2014) and Roever and Skinner (2016) stated that the informal sector’s characteristics have significant implications for any strategy or policy intervention to alleviate poverty and enhance economic welfare.
The presence of street vendors is frequently associated with detrimental effects on the urban environment, contributing to impressions of filth and disorder. This is reflected in the placement of trade facilities, which are disorganised and often occupy public spaces, a result of low income and small business scale. Some authors find that in Indonesia, informal businesses typically pay lower wages and have lower productivity than larger, formal businesses (Pambudi, 2020; Roever and Skinner, 2016; Rothenberg, Gaduh, et al., 2016; Setyaningsih, Sukiman, et al., 2019). The commodity goods or services they offer are very flexible in terms of skill or capital requirements (Anggeriani, 2016; Fanggidae, 2021). Rothenberg, Gaduh, et al., (2016) add that, “Managers of informal businesses also tend to have low educational attainment, and many informal businesses serve small local markets and have not recently expanded.” These factors contribute to the Indonesian government’s difficulty managing informal businesses, whose economic presence can negatively affect tax revenue, market structure, and competition (Rothenberg, Gaduh, et al., 2016).
Shifts in people’s mindsets and behaviours to avoid various tourism activities in urban areas have facilitated the rapid growth and development of tourism facilities such as street vendors (Akliyah, 2008; Budi, 2006). However, this growth is regrettable because this phenomenon can lead to slum-like conditions in the city if not properly managed and planned. Furthermore, the inconsistency of street vendors’ locations concerning the function of urban space results in inefficiencies in urban transportation, usage of urban infrastructure, and environmental pollution. Tourism area development activities are one of the urban economic effort’s developments in creative economic structuring. The growth of potential street vendors directly benefits people and regions, particularly in the context of tourism (Malau, 2016).
Learning from the development of the street vendor business in Indonesia, Malau (2016) highlighted the need for humanistic economic development in accordance with the morality of Pancasila values as a paradigm of national development, aimed at the welfare of all people. Furthermore, Akliyah (2008) stated that structuring street vendors has different models, such as applying a bottom-up and participatory approach through consultation to produce mutual agreement. Anggeriani (2016) said that both internal and external factors play an essential role in street vendor management. Internal factors include government policies in the form of local government regulations that provide guidance and assistance to small businesses growing and developing into independent and medium-sized businesses. External factors include forces involved in street vendor management, such as the government security unit (Satpol PP) and local thugs.
Between 1970 and 2000, Makassar had a unique icon for the agglomeration of street vendors along Losari beach, dubbed "the longest restaurant in the world" at the time. It served as a habitat for street vendors and their customers who interacted while enjoying the panoramic sunset at dusk and regularly had a shanty arrangement with organisations in the form of street vendor cooperatives (Hermawati, Abdoellah, et al., 2019; Nurhayati, 2020; Rahayu, Buchori, et al., 2019; Warlina, Yusuf, et al., 2021). Specifically, Vitasurya (2004) discovered the types and characteristics of informal activities that grow based on the intensity, distribution, physical character, and time. The motive of street vendors in seven categories includes selling goods such as cigarettes/newspapers, basic needs, food/snacks, services, accessories, electronics, and household needs. This topic urgently needs rediscussing as it will serve as the foundation for developing the street vendor agglomeration governance model.
Based on the description above, the research problem can be summarised as follows: development of urban space functions that do not take into account the needs of urban communities, particularly the provision and dissemination of suitable locations for street vendors, will result in the underdevelopment of the lower-middle-class business sector, the underdevelopment of community tourism needs and tourists, as well as the tendency to form a declining city face and even become suffocating. Alongside efforts to expand the potential for community wisdom, the rapid development of the city must also be steered in a positive and productive direction by maximising the city's potential.
The potential referred to is realised through the integration of street vendors with other pertinent activities, most notably settlements. The discovery of a model for identifying potential street vendor locations as part of general city activities is an intriguing development that deserves further investigation to transform Makassar into a productive, inclusive, and liveable city. This study aims to examine spatial data-related parameters to plan the location of informal sector businesses using a geographic information software (GIS) program. This study is different from the research conducted by Gumbo, Geyer, et al. (2018) on the mapping of informal sector business groups in Harare. They revealed spatial maps based on geographic information data using time series data on location trends favoured by informal sector businesses as a basis for planning the location of the informal sector.
Research questions are built based on the above problems, among others: a) How to identify the conditions of street vendors and find the determinant parameters that determine the feasibility level of potential street vendor locations, and b) How to build a model for determining suitable locations in which to locate street vendors in urban areas.
In Widjajanti's (2016) research on street vendors in Semarang, it was concluded that the dominant characteristics of street vendor locations chosen by street vendors are as follows: strategic location (between residential and educational areas), accessibility to major urban activities (such as commerce, education, offices, and service facilities) for both street vendors and consumers, public transportation routes, and comfort aspects (such as wide space, open space, sidewalks, urban infrastructure, and safe from danger). These characteristics can serve as a starting point for establishing the parameters for this study.
Finally, the model described above can be implemented in other areas of Makassar and even in other cities with modifications to account for differences in spatial characteristics, environmental conditions, and urban activities. This research aims to improve the quality of cities that have been impacted by the informal sector, such as problems with traffic or vehicle-pedestrian movement, the city’s unattractive appearance, and aspects of city cleanliness.
Method
Case Study
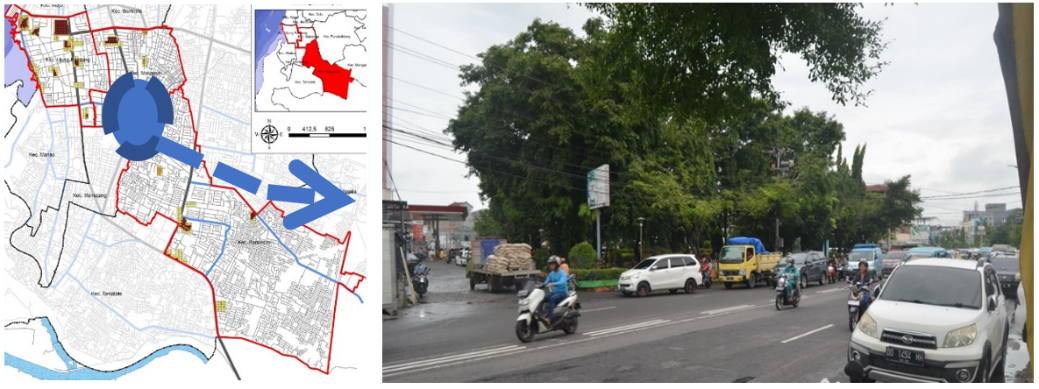
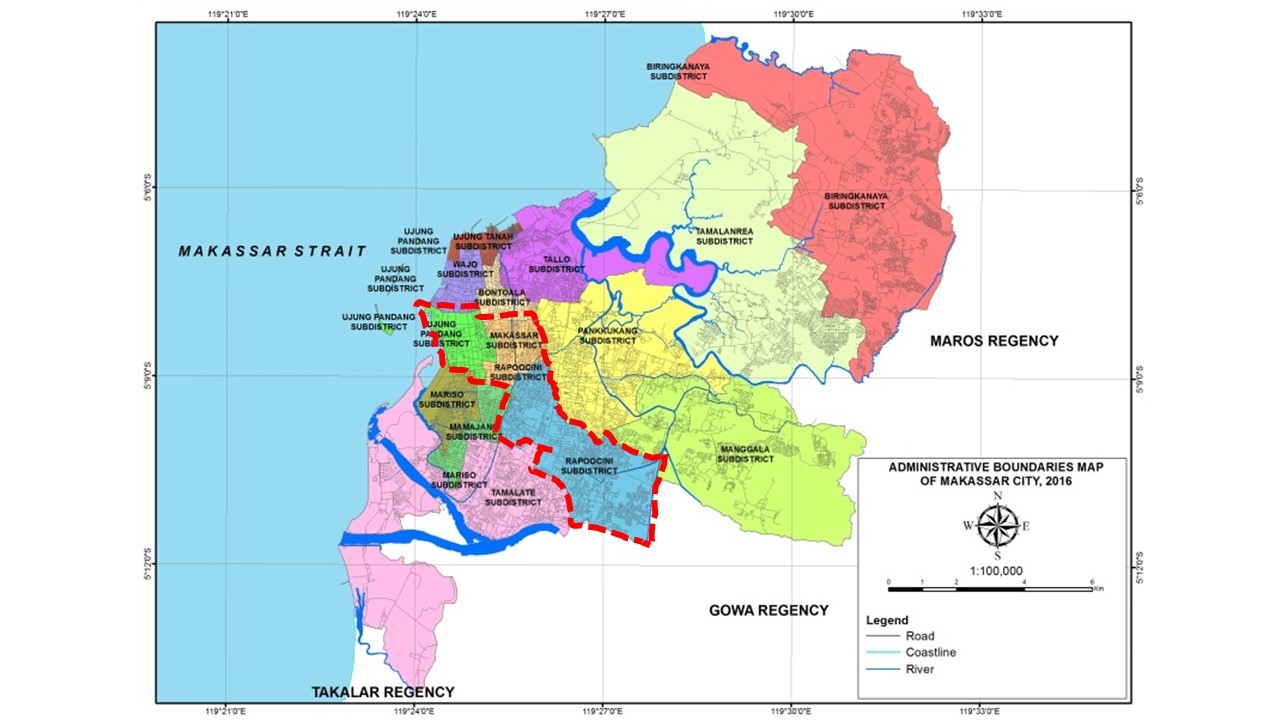
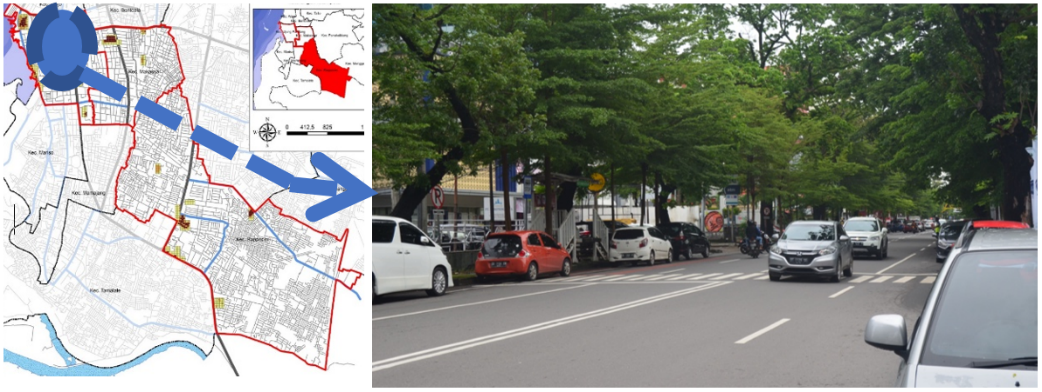
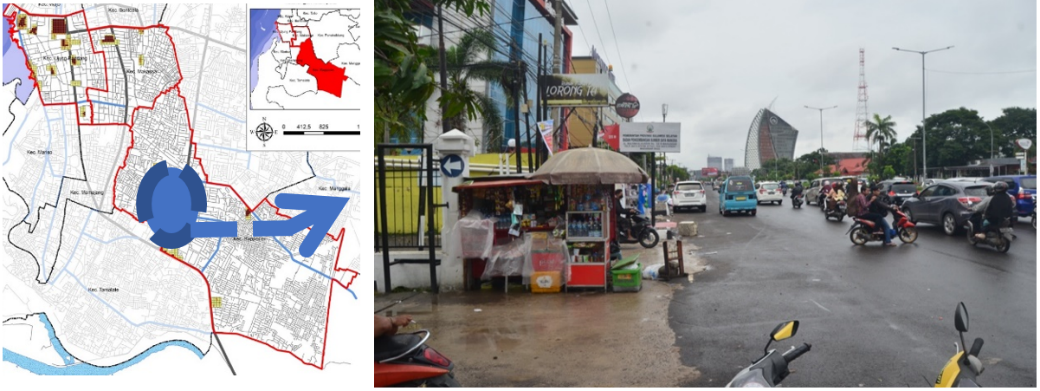
This case study was conducted in Makassar (Figure 1), specifically in three districts: Ujung Pandang, representing the old city, Makassar, representing the development of the old city, and Rappocini, representing the city’s urban expansion towards the suburbs. These three regions showcase the distinct characteristics of street vendor growth centres from the city centre to the outskirts. Gumbo, Geyer, et al. (2018) elucidated the function of space as the core of street vendors' tendencies, which include the central business district, suburban shopping centre, industrial centre, transportation and communication centre, open space, and along the road.
Parameter Decision
The first step was to identify the determinant variables or parameters used to determine the level of feasibility of potential street vendor locations. The determination of supporting parameters (80% coverage) and inhibiting parameters (20% coverage) was achieved through a literature review and interviews with traders, the general public, and policymakers. Following this, the Analytical Hierarchy Process (AHP) techniques of expert choice were used to structure the resulting parameters (Zou, Ma, et al., 2022). The analysis based on the expert system was used to construct a model for location determination, which is a technique for negotiating expert knowledge with a computer. According to Ikram and Qamar (2015), the organisation of a knowledge base is always at the centre of the development of functional expert systems. The user interface allows users to input collected facts into the system and save them to the fact base. According to Ikram and Qamar (2015), the system provides users with results, recommendations, and explanations. In the rule-based expert system (Figure 3), the knowledge is used as the basis of the problem-solving procedures (Hidayat, Terabe, et al., 2018). A rule can reason about the characteristics of a frame by referring to its slot values (Purwohandoyo, Reinhart, et al., 2023). Rules in procedural knowledge form are associated to attribut information to some actions (Susetyo, 2019). Rule-based knowledge representation is used to describe connections, relationships, or causal links (Bhatt and Buch, 2017; Dudek and Śmiałkowska, 2019).
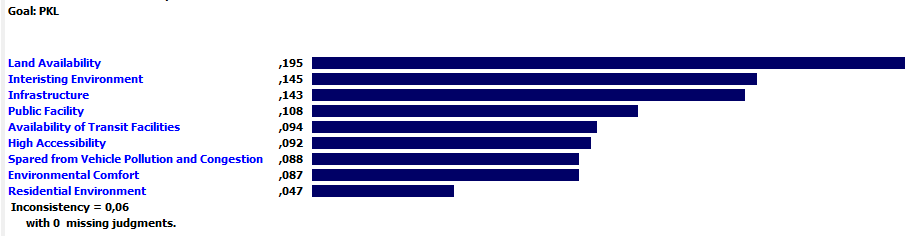
The supporting parameters for street vendor location were structured as stated in the following graphs and tables based on the results of the AHP analysis using expert choice techniques conducted on five academics and practitioners in the field of urban and regional planning at the Faculty of Engineering, Hasanuddin University (Figure 2). When the inconsistency value is less than 0.1, the result is considered consistent and may be used in the next step.
Supporting and Inhibiting Parameters
The parameters were determined using the findings of the literature review to obtain the factors for suitable location determination. These factors were also discovered through the results of questionnaire distributions or in-depth interviews with respondents using purposive sampling techniques. Respondents were drawn from three research areas: Ujung Pandang, Makassar, and Rappocini District. They included members of the informal sector, the general public, and policymakers. The determination of parameters, referring to several results of the literature review, included the following: a) Rochmad (2005) who researched the spatial setting of street vendors, found three factors that determine the distribution of street vendor locations, namely: the area function, distance, and circulation; b) Permatasari, Putro, et al. (2014) whose research analysis on relocating street vendors covered seven aspects to be considered, namely: ease of access, a comfortable place, rent cost, protection guarantee, facilities, regular customers, appreciation; c) Menuk Sri Handayani and Budi Lestari (2017) identified the characteristics of street vendors who sell outside of the centre in terms of demographics, operations, finance and sales. These studies provided principles for a suitable location for street vendors such as accessibility for customers, number of customers, cleanliness of the workplace, quality and sources of cooking/washing water, waste management, traffic disturbances, other public facilities, and comfort.
The questionnaire was distributed to five experts: two university professors (urban planning), a real estate professional planner, an urban planner, and the head of Makassar government urban planning. They filled in the questionnaire to determine the supporting and inhibiting parameters.
The results of the questionnaire indicated that supporting parameters such as availability of empty space, an attractive environment, urban infrastructure, public facilities, proximity to the transit area, accessibility, safety from vehicle pollution, environmental comfort, and proximity to residential areas, are all aligned with the principles of determining street vendor locations (see Table 1).
Table 1. Determination of each supporting parameter values
| No.
|
Description
|
AHP Value
|
Weight (%)
|
| 1 |
Availability of empty space |
19.5 |
15.6 |
| 2 |
Attractive environment |
14.5 |
11.6 |
| 3 |
Urban infrastructure |
14.3 |
11.4 |
| 4 |
Public facilities |
10.8 |
8.6 |
| 5 |
Near a transit area |
9.4 |
7.5 |
| 6 |
Accessibility |
9.2 |
7.4 |
| 7 |
Safety from vehicle pollution |
8.8 |
7.0 |
| 8 |
Environmental comfort |
8.7 |
7.0 |
| 9 |
Near residential areas |
4.8 |
3.8 |
| Total |
|
100 |
80.0 |
In addition, it was found that 87.2 percent of street vendors and 83.3 percent of community respondents believe these supporting factors are feasible. Additionally, whether assessed or not, the inhibiting parameters, such as traffic congestion, flooding, military activity centres, urban infrastructure, slums, and industrial estates, were considered when determining the location of street vendors (See Table 2).
Table 2. Determination of inhibiting parameter values
| No.
|
Description
|
AHP Value
|
Weight (%)
|
| 1 |
Traffic congestion |
22 |
5 |
| 2 |
Floods |
22 |
5 |
| 3 |
Slums |
21 |
3.5 |
| 4 |
Military activity centres and industrial estates |
35 |
6.5 |
| Total |
|
100 |
20 |
The weights of the supporting parameters and inhibiting parameters were determined using a ratio of 80% and 20%, respectively. This is the basic assumption of researchers based on field conditions where the supporting factors are far more dominant than the inhibiting parameters.
Parameter Scoring
Supporting Parameter Scoring
The area of the road within the grid was calculated for road access. The wider the road, the more accessible it is. One grid has a maximum area of 5 ha and a minimum area of 0.32 ha. Another indicator of accessibility is the road type, which includes arterial, secondary, and local roads. If the road’s condition is good, the accessibility will follow. The analysis was conducted using the road data in Table 3:
Table 3. Road status scoring
| Road Status
|
Score
|
| Arterial |
60 |
| Secondary |
30 |
| Local |
10 |
Space availability is critical because street vendors require space for their activities. The required space is an open space beside the road, or a small space available in front of other land uses beside the road. Available open space beside the road has a score of 60. Along roads, where a lot of space is used and there is still some remaining, the score would be 30, and if there is no space at all, the score would be 10. The analysis is carried out using the land use data listed in Table 4:
Table 4. Space availability scoring
| Space
|
Score
|
| Empty space |
60 |
| Little space in front of other land use |
30 |
| No space |
10 |
-
c)
Attractive Environment
An attractive environment refers to the street vendor’s location being close to or not too far from a tourist or commercial area. The closer the street vendor is to a tourist or commercial area, the higher the score. If the street vendor is in the vicinity of an office building, the score would be 30. If the street vendor is located in an area of urban sprawl, the score would be 10. This analysis was conducted using the land use data listed in Table 5:
Table 5. Attractive environment scoring
| Attractive area
|
Score
|
| Tourism and commercial area |
60 |
| Office area |
30 |
| Urban sprawl residential area |
10 |
Street vendors located near public facilities such as rest areas, parks, and markets receive higher scores. The distance should be approximately 50 metres. If the distance is greater than 100 metres, the lowest score is obtained. This analysis was conducted using the land use data listed in Table 6:
Table 6. Public facilities scoring
| Public facility distance
|
Score
|
| Less than 50 metres |
60 |
| 50-100 metres |
30 |
| More than 100 metres |
10 |
A street vendor would receive a high score due to its proximity to a transit area. The maximum score is 60 for distances less than 50 metres between the street vendor and a transit area. The lowest score is 10 for distances greater than 100 metres between the street vendor and the transit area. This analysis used the land use and transit system data in Table 7.
Table 7. Proximity to transit area scoring
| Distance to the transit area
|
Score
|
| Less than 50 metres |
60 |
| 50-100 metres |
30 |
| More than 100 metres |
10 |
-
f)
Safety from Vehicle Pollution and Environmental Comfort
The location of the street vendor is critical for traffic and deceleration of speed, as well as for ensuring a comfortable environment. A high volume of traffic equals a low score because it is assumed a high volume of traffic equals a high level of pollution. A street vendor’s location is ideal if it is not in a high-pollution, noisy area. The data below was used for the analysis, in Table 8:
Table 8. Safety from vehicle pollution and environment comfort distance scoring
| Safety from vehicle pollution and environment comfort distance
|
Score
|
| Less than 50 metres |
60 |
| 50-100 metres |
30 |
| Above than 100 metres |
10 |
-
g)
Near Residential Areas
Street vendors located within walking distance of residential areas score highly. The highest score for proximity to a residential area is 60 for distances less than 500 metres. The lowest score for proximity to a residential area is 10 for distances greater than 1000 metres. The residential land use data utilized for the analysis is shown in Table 9.
Table 9. Near residential areas scoring
| Residential distance
|
Score
|
| Less than 500 metres |
60 |
| 500-1000 metres |
30 |
| Above than 1000 metres |
10 |
Inhibiting Parameters Scoring
If there is heavy traffic on the street, it would be challenging for the street vendor to conduct their activity. Congestion can be determined by examining the road’s level of service (LOS). The highest score is given if the street vendor location is free of traffic congestion or has a low LOS, but not otherwise. See Table 10 below.
Table 10. Traffic congestion scoring
| Traffic congestion
|
Score
|
| LOS A and B |
60 |
| LOS C-D |
30 |
| LOS E-F |
10 |
Certain areas of Makassar city are permanently flooded. This means that the flood is permanent, caused by rain and poor drainage, even during the dry season. The highest score is obtained if the street vendor is not located in a flood zone. See Table 11 below.
Table 11. Flood scoring
| Flood
|
Score
|
| No flood |
60 |
| Temporary |
30 |
| Permanent |
10 |
Makassar has a large number of slum areas. If a street vendor is located near or within a slum area, it will not attract customers. The highest score is obtained if the street vendor is not located in a slum. See Table 12 below.
Table 12. Slums scoring
| Slums
|
Score
|
| Not in a slum area |
60 |
| 500 meters near a slum area |
30 |
| Inside a slum area |
10 |
-
d)
Military Activity Centres and Industrial Estate
Street vendors’ businesses will not thrive in areas adjacent to or very near military activity or industrial estates. A street vendor receives the highest score if it is located away from military activity centres and industrial estates. The lowest score is given to a street vendor located close to military bases and industrial estates. See Table 13 below.
Table 13. Military activity centres and industrial estate scoring
| Military activity centres and industrial estate distance
|
Score
|
| More than 1000 metres |
60 |
| 500-1000 metres |
30 |
| Less than 500 metres |
10 |
Figure 3 presents the expert system analysis based on the supporting and inhibiting parameters. All the parameters were combined to evaluate whether or not to recommend a location for a street vendor.
System Grid Analysis
The model for determining potential street vendor locations was analysed using an equation model called the Certainty Factor (CF) (Figure 4). Meanwhile, the grid-based land surface was assessed using a program called ArcGIS Pro 10.6, specifically its fishnet analysis function (ArcGIS, 2018). Each grid was determined by the coefficient of friction (CF) value of each parameter multiplied by its weight. Due to the scope of the project, an initial grid map of 100x100 m² was created, followed by a more detailed analysis using a grid size of 25x25 m².
The subsequent step (Figure 5) was to compute all the parameters into the mapping grid using GIS analysis techniques such as fishnet and intersect data analysis. To start, the data was gridded into a 100x100 metre grid. Then, using the 100x100 grid, the data was analysed to generate potential locations. The data was subdivided by a 25x25 metre grid to pinpoint the best location for a street vendor. The image below illustrates the logic diagram for each parameter in the grid.

The macroscale analysis employed a 100x100 m² grid. The grid assessment of each parameter was carried out by multiplying the object area of each parameter by the grid area. Environmental comfort, security (crime), accessibility, public facilities (education, health, worship, and public open space), municipal infrastructure (electricity, water, garbage, drainage, sanitation, and waste), attraction (scenic view, recreation), the availability of space used by street vendors at that location, and proximity to transit and residential areas were all evaluated as supporting parameters. Additionally, the parameter value was multiplied by the percentage of CF values for each parameter (as stated above). Some inhibitory parameters (negative values) were assessed, including traffic congestion, flooding, military activity centres, urban infrastructure, slums, and industrial estates.
At the microscale, parameters such as street vendor space availability, attractive environmental conditions, public facility availability, transit facility availability, vehicle pollution-free zone, and environmental comfort were used. Each parameter was multiplied by its weight, as specified in the table below. The result is a total value in percentage units for each grid (CF Micro).
Moreover, CF measurements on a micro-scale were performed using a 25 x 25 m² grid size. The matrix contained grid-based values for potential street vendor locations in Makassar city: row number 1823 for macroscale and row number 1167 for microscale.
The valuation method employed an overlay technique between thematic maps and GIS-based base maps, such that each grid generated a numerical value mathematically. The GIS software scanned the entire grid until it generated scoring levels ranging from lowest to highest. The command to quickly and accurately provide colour by block or grid boundary line would result in a map of the potential grids developed to accommodate street vendors. Finally, grid mapping results were adjusted to the map of the research area, in addition to field observations. The findings of this analysis are expected to depict potential street vendor locations in Makassar.
The method for calculating each parameter is as follows:
CFi
=
∑
i
=
1
n
(
PGCRi
*
Bi
)
/
100
(1)
Descriptions:
CFi = Certainty Factor for each supporting and inhibiting parameter
i = 1 to n parameters
PGCRi = Parameter Grid Coverage Ratio (%) for each supporting and inhibiting parameter
Bi = Value of each supporting and inhabiting parameter
Thematic maps related to supporting factors for determining the location of street vendors in Makassar city include:
Thematic map of the road, scale 1: 1000
Thematic map of congestion (safe from vehicle pollution) scale, 1: 1000
Thematic map of the spread green space (comfort environment), scale 1: 1000
Thematic map of the city’s distribution, scale 1: 1000
Thematic map of attraction (interesting environment), scale 1: 1000
Thematic map of street vendor availability, scale 1: 1000
Thematic map of residential distribution, scale 1: 1000
Thematic map of industrial distribution locations, scale 1: 1000
Thematic map of transit facility distribution, scale 1: 1000
As mentioned previously, the decision-making analysis for potential street vendor locations in Makassar was conducted using a GIS application, which was translated into categories (classification). The analysis was carried out in a systematic grid of geographic references using the maximum implication method, and compiling all outputs from the evaluation results for each predetermined rule. Each grid in an analysis map generated a unique value (measured as a percentage). In this case, the study area was designed as an analysis grid map, with values determined for each grid based on several values for each of the rules/parameters determined in the previous analysis. The grid size selected determined the depth of analysis used to identify potential locations. The smaller the grid size selected, the more detailed the result. Given the size of the research area, the grid size used in the analysis of determining the potential location of street vendors in Makassar was evaluated in stages, which are referred to as macro and micro-scale measurements.
Result and Discussion
The implementation employed ArcGIS to apply the conclusions’ values. The result is a percentage-based total value for each grid. The range of CF values from the lowest to the highest value represented the assessment category in the classification. In this case, macro analysis assigned four categories to the assessment: high suitability, suitable, low suitability, and not suitable. The tabulation table contains output models and implementation of the GIS-based expert system, while the overlay map data are presented in Table 14 and Figure 6 below.
Table 14. Output of model determining potential street vendor locations (macro-scale)
| No.
|
Selected grids
|
Values
|
Location categories
|
| 1 |
4 |
2525 > 3368 |
High suitability |
| 2 |
106 |
1683 - < 2525 |
Suitable |
| 3 |
1399 |
841 - < 1683 |
Low suitability |
| 4 |
314 |
1 - < 841 |
Not suitable |
Based on the arrangement of four types of value intervals, values in the range 2525 to 3368 are classified as having high suitability, values from 1683 up to 2524 are classified as being suitable, values from 841 to 1682 are classified as having low suitability, and values from 1 to 840 are classified as not suitable locations. The values of the four interval categories are depicted in four colour groups on GIS-based maps. Figure 6 illustrates the process of determining the potential location of street vendors in three districts of Makassar using a grid size of 100x100 m2 (macro-scale).
In Figure 6, locations suitable for street vendors (suitable and highly suitable categories) are spread out in a grid-based spread (100x100 m2). The pattern of suitable potential street vendor distribution in the high suitability category (dark-brown notation) consists of only 19 grids, 13 in Ujung Pandang District, two in Makassar, and four in Rappocini.
The distribution of street vendor locations classified as suitable (light-brown notation) results in as many as 30 grids in Ujung Pandang, eight in Makassar, and twenty-four in Rappocini. The distribution of possible street vendor locations is partly colonial (more than one grid). Colony patterns range from two to ten grids. It was discovered that only two locations in Makassar District were patterned with two and six grid colonies, while the remainder had a single grid pattern. At the same time, there were numerous colony patterns in Ujung Pandang and Rappocini districts. However, the distribution of potentially appropriate categorised grids (dark-yellow notation) are very widely distributed throughout Makassar and are not prioritised (Figure 6).
The results of determining the CF from each parameter at the macro scale using a grid size of 100x100 m2 were further analysed using a grid size of 25x25 m2 (micro-scale analysis). Micro-scale analysis applied only to locations classified as suitable up to high suitability. In addition, only selected locations were colonised (at least two grids).
Each parameter was grid-assessed by comparing the object area of each parameter to the grid area (625 m2) and multiplying it by 100. Several supporting parameters were evaluated, including trends in street vendor location, attractive environment, public facilities (education, health, worship, and open green space), transit accessibility, vehicle pollution safety, and environmental comfort. Because inhibiting parameters were considered at the macro stage, they were no longer considered at the micro stage. At the macro stage, the analysed grid identified potential locations that satisfied the requirements of not being inhibited.
To represent the rating category, the CF values were divided into categories from lowest to highest. In this case, microanalysis classified potential into three categories: 1st potential (the highly suitable locations, denoted by a dark-brown notation), 2nd potential (the suitable locations, denoted by a light-brown notation), and 3rd potential (the locations with low suitability, represented by yellow notation). To be clear, the implementation of potential street vendor locations on a micro-level in Makassar city can be seen in the description below. The tabulation table contains the output model and implementation of GIS-based expert systems, while the overlay map data are presented in Table 15 and Figures 7-10 below.
Table 15. Output Application of Model Determining Street Vendor Locations (micro-scale)
| No.
|
Selected grids
|
Values
|
Location categories
|
| 1 |
114 |
5464 - < 7571 |
1st potential, high suitability |
| 2 |
229 |
3357 - < 5464 |
2nd potential, suitable |
| 3 |
821 |
1 - < 3357 |
3rd potential, low suitability |
The map below (Figure 7) illustrates the analysis results in applying the model for determining potential street vendor locations that were generated at a macro scale in the study area in Makassar city. The map shows the results of the microscale analysis above, which indicate that suitable locations for street vendors (1st-3rd potential categories) are spread across several grid points (25x25 square metres). According to the distribution pattern of potential street vendor locations classified as the 1st potential category (dark-brown notation), the Ujung Pandang District contains only 59 grids, while the Rappocini District contains 49 grids. The distribution of street vendors results in the 2nd potential category (light-brown notation), with 94 grids in Ujung Pandang and 100 grids in Rappocini. There are no grids with 2nd category potential in the Makassar District area. The remainder arein the 3rd potential category (yellow notation) and are dispersed throughout the districts, particularly in Ujung Pandang and Rappocini, while Makassar District has only 32 grids per colony.

Additionally, by using a 25x25 m2 grid, the map below depicts the potential distribution of street vendors in the three study areas. For more information, see Figure 7, Figure 8, and Figure 9.
In Figure 10, the locations suitable for street vendors in the 1st potential category (dark-brown notation) are spread out in a grid-based spread (25x25 m2). There are six locations in the Ujung Pandang District: Kartini Street surrounding Karebosi park, on the side of Haeril Anwar Street in the Mandala monument area, Hasanuddin Park–Jend. Sudirman Street, Hasanuddin Street, Macan Park, Ujung Pandang Street in front of Fort Rotterdam Museum, and Losari Beach. Makassar District consists of two points, namely Veteran Street and Urip Sumoharjo Street, located near a gas station. Additionally, there are three locations in Rappocini District: Tamalate Park, Raya Pendidikan Street, the Telkom office area, and Sultan Alauddin Street.
Locations suitable for street vendors in the 3rd potential category (yellow notation) are distributed in a grid-based spread (25x25 m2). There are fifteen locations in the Ujung Pandang District, including Kartini Street, Amannagappa Street, Ince Nurdin Street, Haeril Anwar Street, Lompo Battang Street, Jend. Sudirman Street, Arif Rate Street, Sultan Hasanuddin Street, Penghibur Street, Karunrung Street, Sayarif Al Qadri Street, Monginsidi Street, Komp. Air Minum Street, Maipa Street, and Lamadukelleng. There are two locations in Makassar District: Urip Sumoharjo Street and Veteran Street. Meanwhile, three locations are available in Rappocini District, including Hertasning Street, AP. Pettarani Street, and Sultan Alauddin Street (Figure 11).
Locations suitable for street vendors in the 3rd potential category (yellow notation) are distributed in a grid-based spread (25x25 m2). There are three locations available in Rappocini District, including Hertasning Street, Landak Baru Street, and Sultan Alauddin Street (Figure 12).
In the future, if this step-by-step analysis is applied to every city not only in Makassar but also every city in Indonesia, the vendor location planning problem may be solved through improved planning and regulation based on the results of the analysis. An integrated vendor location plan is needed to make a liveable city, with a high-quality urban environment, less traffic and a high economic impact on society. Citizen and the tourist needs for urban services could also be better met.
Conclusion
Suitable street vendor locations in Makassar can be identified using various parameters interpreted in system grid analyses. There are two types of parameters: supporting and inhibiting. Each parameter has a score calculated in relation to other parameters and is superimposed on the system grid analysis. This method could be applied to another city with similar characteristics to Makassar.
The model’s application in Makassar reveals that the location of the 1st potential category is spread across several points, both on the roadside and in public open spaces such as parks, monuments, meeting centres, and near offices. Karebosi Park, Jend Sudirman Street, Hasanuddin Field, Macan Park, Ujung Pandang Street, and Penghibur Street are all potentially suitable locations. Veteran Utara and Urip Sumoharjo Streets are located in Makassar District. Hertasning Street, Tamalate Park, and Sultan Alauddin Street are located in Rappocini District. The locations in the 2nd potential category are also distributed randomly at several points. Kartini Street, Jend Sudirman Street, Ince Nurdin Street, Hasanuddin Field, Sungai Saddang Street, Sultan Hasanuddin Park, Sultan Hasanuddin Street, Macan Park, Fort Rotterdam Museum area, and Maipa Street are located in the Ujung Pandang District. Urip Sumoharjo Street, Veteran Utara Street, and Kerung-Kerung Street are located in Makassar District. Additionally, there are areas in Rappocini District, along A.P. Pettarani Street, Sultan Alauddin Street, and Hertasning Street that surrounds Tamalate Park. The location of the 3rd potential category locations are spread across several points connected to the roads classified in the 1st and 2nd potential location categories.
Determining suitable locations for street vendors at several points can be the basis for a street vendor placement policy. In this way, it will be easier for the government and the community to control the spread of street vendors, so that they can improve the quality and attractiveness of the city, as well as serve the community’s needs.
Author Contributions
Conceptualization, A.A., A.Y. and A.H.; methodology, A.A. and A.Y..; software, A.H.; investigation, W.W.O.; resources, R.I.; data curation, A.A. and A.Y.; writing—original draft preparation, A.A., A.Y. and A.H.; writing—review and editing, A.A., A.Y., W.W.O., R.I. and A.H; supervision, A.A. and A.Y. All authors have read and agreed to the published version of the manuscript.
Ethics Declaration
The authors declare that they have no conflicts of interest regarding the publication of the paper.
Acknowledgments
The authors would like to acknowledge all the authors for their support writing the paper. In addition, we would like to thank all reviewers who have given comments and insights for improving the paper.
Funding Statement
This research was funded by the Deputy for Research and Development Strengthening, Ministry of Research and Technology of Indonesia.
References
- Akliyah , L. S. (2008). “Kajian Penataan Pedagang Kaki Lima (PKL) Di Kota Tasikmalaya Secara Partisipatif ”. (Thesis), Institut Pertanian Bogor, Indonesia.
- Alves, G. (2021). “Slum Growth in Brazilian Cities”. Journal of Urban Economics, 122, 103327. doi: https://doi.org/10.1016/j.jue.2021.103327.
- Anggeriani , A. Z. (2016). “Kawasan Pedagang Kaki Lima Di Makassar”. (Thesis), Universitas Islam Negeri Alauddin Makassar.
- ArcGIS . (2018). “Create Fishnet”. ArcGIS Resources Help. Retrieved from https://pro.arcgis.com/en/pro-app/latest/tool-reference/data-management/create-fishnet.htm.
- Bhatt , M. R., and Buch , S. H. (2017). “An Expert System of Die Design for Multi Stage Deep Drawing Process”. Procedia Engineering, 173, 1650–1657. doi: https://doi.org/10.1016/j.proeng.2016.12.257.
- Budi , A. S. (2006). “Kajian Lokasi Pedagang Kaki Lima Berdasarkan Preferensi PKL Serta Persepsi Masyarakat Sekitar Di Kota Pemalang”. (Thesis), Universitas Diponegoro.
- Desti, I. (2020). “The Implementation of Street Vendors Regulation Policy in Developing Their Social Order in Majalaya Area of Bandung Regency”. International Journal Pedagogy of Social Studies, 5(1), 1–8. doi: https://doi.org/10.17509/ijposs.v5i1.25912.
- Dudek, T., and Śmiałkowska, B. (2019). “Integrated Quality Assessment of Services in an Adaptive Expert System with a Rule-Based Knowledge Base”. Transportation Research Procedia, 39, 34–41. doi: https://doi.org/10.1016/j.trpro.2019.06.005.
- Fanggidae , L. W. (2021). “The Existence of Street Vendorsas An Element of Urban Space: A Dilemma.” Gewang, 3(2), 31–37.
- Gultom , Y. M. L. (2014). “Explaining the Informal Sector in Indonesia from the Transaction Costs Perspective”. Gadjah Mada International Journal of Business, 16(1), 23–38.
- Gumbo, T., Geyer, M., et al. (2018). “Mapping Spatial Locational Trends of Informal Economic Enterprises Using Mobile Geographic Information Data in the City of in Harare, Zimbabwe”. Data in Brief, 20, 1692–1699. doi: https://doi.org/10.1016/j.dib.2018.09.037.
- Handoyo, E., and Setiawan , A. B. (2018). “Street Vendors (PKL) as the Survival Strategy of Poor Community”. JEJAK, 11(1), 173–188. doi: https://doi.org/10.15294/jejak.v11i1.12510.
- Hermawati, R., Abdoellah , O. S., et al. (2019). “The Social Movement of Street Vendors to Maintain Their Business Places in Bandung”. Masyarakat, Kebudayaan Dan Politik, 32(1), 1. doi: https://doi.org/10.20473/mkp.V32I12019.1-15.
- Hidayat, A., Terabe, S., et al. (2018). “Determine Non-Passenger Data from WiFi Scanner Data (MAC Address), A Case Study: Romango Bus, Obuse, Nagano Prefecture, Japan”. International Review for Spatial Planning and Sustainable Development, 6(3), 154–167. doi: https://doi.org/10.14246/irspsda.6.3_154.
- Ikram, A., and Qamar, U. (2015). “Developing an Expert System Based on Association Rules and Predicate Logic for Earthquake Prediction”. Knowledge-Based Systems, 75, 87–103. doi: https://doi.org/10.1016/j.knosys.2014.11.024.
- Kar, S., and Marjit, S. (2009). “Urban Informal Sector and Poverty”. International Review of Economics & Finance, 18(4), 631–642. doi: https://doi.org/10.1016/j.iref.2008.06.009.
- Malau , N. A. (2016). “Ekonomi Kerakyatan Sebagai Paradigma Dan Strategi Baru Dalam Pembangunan Ekonomi Indonesia”. Jurnal Ilmiah Research Sains, 2(1), 1–8.
- Menuk Sri Handayani, C., and Budi Lestari, B. (2017). “Factors Affecting the Street Vendor Decision to Sell at Outside of the Street Vendor Center”. International Journal of Business and Management Invention, ISSN 6.
- Nguimkeu, P. (2014). “A Structural Econometric Analysis of the Informal Sector Heterogeneity”. Journal of Development Economics, 107, 175–191. doi: https://doi.org/10.1016/j.jdeveco.2013.12.001.
- Nurany, F. (2021). “The Policy Instruments of Street Vendor Relocation in Surabaya Bulak Fish Center”. DIA, 19(1), 68–84. doi: https://doi.org/10.30996/dia.v19i1.4800.
- Nurhayati, C. (2020). “Social Development in the Urban Informal Sector: A Case Study of Street Vendors in Pasar Minggu, Jakarta”. MASYARAKAT: Jurnal Sosiologi, 25(1). doi: https://doi.org/10.7454/mjs.v25i1.10948.
- Octavia, J. (2020). “Towards a National Database of Workers in the Informal Sector: COVID-19 Pandemic Response and Future Recommendations.”
- Pambudi, A. (2020). “Effectiveness of Street Vendor Regulation Policies to Improve Public Order in Yogyakarta, Indonesia”. Journal of Southwest Jiaotong University, 55(3). doi: https://doi.org/10.35741/issn.0258-2724.55.3.42.
- Permatasari, A., Putro , U. S., et al. (2014). “Strategic Analysis Relocating Street Vendor through 3D Negotiation Case Study: Street Vendor Surakarta, Indonesia”. Procedia - Social and Behavioral Sciences, 115, 436–443. doi: https://doi.org/10.1016/j.sbspro.2014.02.451.
- Purwohandoyo, J., Reinhart, H., et al. (2023). “Spatial Multi-Criterion Analysis (SMCA) to Determine the Suitability of Green Open Space (GOS) at Kalurahan Wonokromo, Special Region of Yogyakarta”. International Review for Spatial Planning and Sustainable Development, 11(1), 10. doi: https://doi.org/10.14246/irspsd.11.1_158.
- Rahayu , M. J., Buchori, I., et al. (2019). “The Need for The Improvement of Street Vendors Management in Public Spaces at Surakarta City”. Planning Malaysia, 17. doi: https://doi.org/10.21837/pm.v17i10.636.
- Rochmad , A. N. (2005). “Faktor-Faktor Penentu Pola Distribusi Dan Setting Kios Kaki Lima Di Yogyakarta”. (Thesis), Universitas Gadjah Mada.
- Roever, S., and Skinner, C. (2016). “Street Vendors and Cities”. Environment and Urbanization, 28(2), 359–374. doi: https://doi.org/10.1177/0956247816653898.
- Rothenberg, A. D., Gaduh, A., et al. (2016). “Rethinking Indonesia’s Informal Sector”. World Development, 80, 96–113. doi: https://doi.org/10.1016/j.worlddev.2015.11.005.
- Setyaningsih, I., Sukiman, S., et al. (2019). “The Analysis of Factors Affecting Income Level of Street Vendors”. Eko-Regional Jurnal Pengembangan Ekonomi Wilayah, 14(2). doi: https://doi.org/10.20884/1.erjpe.2019.14.2.1330.
- Susetyo , D. A. (2019). “Systematic Literature Review Of Expert System, Fuzzy Logic And Artificial Neural Network Applications”.
- Vitasurya , V. R. (2004). “Faktor-Faktor Yang Mempengaruhi Hubungan Aktivitas Formal Dan Aktivitas Informal Di Ruang Jalan Jenderal Sudirman Salatiga: Batas Tugu Taman Sari - Jalan A. Yani Salatiga”.
- Warlina, L., Yusuf, M., et al. (2021). “Planning for Relocation Area of Street Food Vendor in Bandung City”. International Journal of Design, 1(1), 37–42. doi: https://doi.org/10.34010/injudes.v1i1.4831.
- Widjajanti, R. (2016). “The Space Utilization by Street Vendors Based on the Location Characteristics in the Education Area of Tembalang, Semarang”. Procedia - Social and Behavioral Sciences, 227, 186–193. doi: https://doi.org/10.1016/j.sbspro.2016.06.061.
- Yuliantari, E., Hafsari , T. A., et al. (2018). “Site Selection for Public Health Centres (Puskesmas) Using Spatial Multicriteria Analysis in Purworejo Region”. International Review for Spatial Planning and Sustainable Development, 6(3), 37–48. doi: https://doi.org/10.14246/irspsd.6.3_37.
- Zhou, T., Zhao, R., et al. (2017). “Factors Influencing Land Development and Redevelopment during China’s Rapid Urbanization: Evidence from Haikou City, 2003–2016”. Sustainability, 9(11), 2011. doi: https://doi.org/10.3390/su9112011.
- Zou, X., Ma, S., et al. (2022). “An Analytical Hierarchy Process Approach for Smart City Assessment in Japan: From Concept to Indicators”. International Review for Spatial Planning and Sustainable Development, 10(2), 58–72. doi: https://doi.org/10.14246/irspsd.10.2_58.