Abstract
One of the fundamental indicators for evaluating visual continuity in the preservation of historical landscapes is the visual experience gained through sequential views in urban space. Controlling the valuable visual qualities is essential to maintain the precious sequential view of the historical landscape. The visual perspective of pedestrians and the wayfinding roles of urban landmarks are central issues in the visual experience of historical cities. The evaluation of visibility analysis is performed using the scene-capturing method via photographic survey. This method is combined with 2D isovist and 3D viewshed analysis as a computational approach applied to five historical landmarks in Malang, Indonesia. The scene-capturing methodology examines the sequential view series of each landmark from various approaching paths by extracting the landmark's silhouette and segmenting the visibly distinct areas of the scene. Subsequently, 2D isovist and 3D viewshed analyses investigate the pattern of the visual field spectrum along each route. As a result, the best visibility rate at the closest observation distance is achieved by the Frateran School Building at 9.58%, while the best visibility at the farthest observation distance is observed at the Kayutangan Church Building at 0.97%. The range of observation distances with a significant percentage of visual sightings is from 75m - 100m, with the closest observation distance ranging from 50 - 75 meters. Combining sequential photo mapping and isovist analysis provides a powerful tool for managing and enhancing the visual experience, which can inform decisions on urban planning, architectural design, and historical preservation.
Introduction
Forming a strong urban imagination can encourage sound judgment and meaning, thereby motivating people to elicit positive responses within their city spaces. Cities should aim to provide a consistently satisfying aesthetic and sensory experience for the community, as the visual aesthetic encounter in urban spaces plays a vital role in creating excellent and healthy urban landscapes (Porteous, 2013).
The visual aesthetic experience for pedestrians holds significant importance in shaping the urban landscape, particularly in historical areas and city landmarks. It is necessary to evaluate the integration of visual quality in spatial layout and paths of human movement in the area of the city's historical landmarks. Evaluating the visual appeal of road corridor landscapes is crucial to preserving the distinct identity of the city's historical landmarks. These studies, related to urban experience and the cumulative impact of sequential views on observers in the urban landscape, are closely tied to Cullen (1961)) theory of serial vision and Lynch (1964)) theory of urban image. The unique visual characteristics physically form a strong environmental identity that is easily imprinted in human memory (Lynch, 1964). This visual character is related to the city's physical form, which must accommodate the emotional values of observers, enabling people to enjoy a high-quality urban environment through psychological and physical sensations (Cullen, 1961). Cullen noted that one of the four aspects of creating a high-quality urban space is the aspect of serial vision containing visual images captured by observers while moving from one place to another in an area. These recorded views combine to form a unified regional image, concurrently building a distinct identity for the observer within that area. Furthermore, the visual aspects of street patterns play the most crucial role, followed by multisensory experiences and affective responses that influence pedestrian route choices (Boumezoued, Bada et al., 2020).
Malang City is one of the cities in Indonesia with many beautiful urban landscapes built during the Dutch colonial period. Malang gets the nickname Parijs van Oost-Java because the city's beauty is like the city of "Paris" in the east of Java. Moreover, Malang also got the nickname Switzerland van Java since the city's beauty, surrounded by mountains and proper city planning resembles the Swiss country in Europe. Three periods promoted three crucial developments of Dutch architecture style in Malang, namely the Indische Empire style in the 19th century (1850-1900), the early modern colonial style in the early 20th century (1900-1915), and the Nieuwe Bouwen style in the 20th century (1916-1940). On the other hand, the rapid development of Malang has led to the formation of uncontrolled urban space landscapes, especially in the spatial formation of the street corridor in the historical area. This condition has weakened the visual quality of the road corridor (region) near historical landmark buildings. It is feared that the quality of people's visual aesthetic experience will degrade while the distinctiveness of regional identity will be eliminated. Therefore, it is necessary to control the visual quality of the historical region’s landscape to create a sequential visual of historical landmark buildings that supports the excellent image and identity of the urban area.
One form of the visual quality controlling the historical area landscape lies in the aspect of historical landmark building visibility identified in the visual experience of each observation point within the pedestrian space. Evaluation methods related to visual experience can be performed through the visibility analysis method. The visibility analysis method studies the accumulation of visual effects of space occurring across sequential views. The imaginary mental patterns created by a series of sequential observations will influence people's perception of the environment. The aesthetic experience gained through moving observations is identified as Kinesthetic Experience and is essential in the visual dimension of the city environment. Serial vision is an analysis technique of sequential view for the Kinesthetic Experience. One method of analysing relevant visual experiences is sequential scenes method analysis, which is investigated from various observation pathways integrated into the city region node (Kalın and Yılmaz, 2012). The analysis technique is to assess extracted landmark building silhouettes and building appearance segmentation from different observation areas.
Visibility generally refers to the degree to which an object can be seen or observed by an individual, group, or technology. It can be defined as the clarity or degree of clearness of the observed object or phenomenon. Visibility evaluation of historical buildings through sequential views involves assessing the visibility of a building and its features from different perspectives and angles over time. This approach can comprehensively understand the building's historical context and evolution and inform conservation and restoration efforts (Sukwai, Mishima et al., 2022). This evaluation is typically carried out to inform conservation and restoration efforts and preserve the building's historical integrity.
A photographic survey is a method of assessing the visibility and historical context of a building by taking a series of photographs from different viewpoints and angles over time in sequential views. This approach helps identify changes in visibility and the impact of surrounding development or landscape changes on historical buildings. These photographs are then analysed to determine the visibility of the building and its features. Sequential views are an essential aspect of this survey as they allow for the identification of changes in the visibility and context of the building over time (Bagnolo and Manca, 2019; Mor, Fisher-Gewirtzman et al., 2021).
Viewshed analysis is a method of assessing the visibility of a building or landscape from different viewpoints and angles. Viewshed analysis involves using geographic information system (GIS) software to create a digital model of the urban environment surrounding the heritage building. The software then uses this model to calculate the visible area from different viewpoints and angles, known as the viewshed (Dungan, White et al., 2018; Kantner and Hobgood, 2016; Ren and Cao, 2021). It can help to identify areas where the building is significant to the urban landscape and to identify areas where the visibility of the building is threatened by surrounding development or landscape changes.
Several studies have been conducted to evaluate the visibility of historical buildings (Kalın and Yılmaz, 2012; Kiruthiga and Thirumaran, 2017; Leduc, Miguet et al., 2010), single building façades (Bhatia et al., 2012; Stolk, 2014a), urban environments (Ascensão, Costa et al., 2019; Kim, Kim et al., 2019; Koltsova, Tunçer et al., 2013; Morello and Ratti, 2009; Yu and Ostwald, 2018), indoor environments (Grasso, Verbree et al., 2017; Lu, 2011), and even risk communication (Lonergan, 2014).
The methods used in such studies are varied: taking a picture of each building in historical areas and examining the architectural elements that affect visual perception through an empirical analysis (Kiruthiga and Thirumaran, 2017), using a visibility analysis tool for 3D urban environments to analyse the visibility of facade surfaces (Koltsova, Tunçer et al., 2013), using a space syntax analysis to measure the visibility of spaces (Ascensão, Costa et al., 2019; Bendjedidi, Bada et al., 2019; Tutuko, Bonifacius et al., 2021), using geo-visualisation (Lonergan et al., 2014), implementing isovist method (Bhatia, Chalup et al., 2012; Grasso, Verbree et al., 2017; Kim, Kim et al., 2019; Leduc, Miguet et al., 2010; Lu, 2011; Morello and Ratti, 2009; van Bilsen, Jauslin et al., 2014; Yu and Ostwald, 2018), and conducting sequential photo mapping (Kalın and Yılmaz, 2012).
There are positive and negative impacts of each method used in such research. Applying parametric tools for design practice can establish better communication between design theory and practice and improve the quality of future urban spaces through better-informed design processes (Koltsova, Tunçer et al., 2013). On the contrary, some disadvantages also appear when the architects and planners lack sufficient knowledge and skill to operate specialised computational applications. On the other hand, the traditional method, such as sequential photo mapping, takes a shorter period of data gathering and analysis since the technique does not require complicated steps and specific computational skills. However, the results will be less detailed than those produced by the more complicated visualisation methods and technologies.
Hence, the study aims to evaluate the visibility of historical urban landmarks, preserve valuable visual qualities, and maintain the precious sequential view of the historical landscape based on the visual perspective of pedestrians and the wayfinding roles of urban landmarks. The evaluation of visibility through photographic survey and coupled with the 3D isovist or viewshed analysis as a computational method was analysed for five historical landmarks in Malang, Indonesia. The scene-capturing methodology examined the sequential view series of each landmark from different approaching paths by extracting the landmark's silhouette and segmenting the visibly different areas of the scene. The 3D isovist or viewshed analysis approach investigated the pattern of the visual field spectrum for each route.
Materials and Methods
Case study area
The research location is in the central area of Malang, which is in the province of East Java, Indonesia. This area marks the initial phase of growth and development for Malang City during the Dutch East Indies colonial era. To this day, it remains a preserved cultural heritage area of Malang City. This research focuses on historical landmark buildings in Malang, specifically those that played a significant role in shaping the city's identity until 1935 (Pettricia, Wardhani et al., 2014). These buildings are registered as cultural heritage assets by the Malang City government for preservation and conservation purposes. They also serve as prominent elements in Malang City's cultural landscape (see Figure 1).
The total population of historical landmark buildings in Malang comprises eight buildings. From this pool, representative samples will be selected as subjects for this research study. The sample selection criteria are limited to historical landmark buildings that can adequately represent various building position criteria within regional corridors. These selected buildings also reflect three key periods of Dutch architectural styles in Malang: the Indische Empire style in the 19th century (1850-1900), the early modern colonial style in the early 20th century (1900-1915), and the Nieuwe Bouwen style. Consequently, five historical landmark buildings have been chosen: the PLN Building, Kayutangan Church, Malang City Hall, Malang Railway Station, and Frateran School. The latitude and longitudinal coordinates of these locations can be found in Table 1.

Table 1. Location coordinates of five historical landmark buildings in Malang
| No.
|
Building
|
Year Built
|
Address
|
Measuring Point
|
Coordinate Location
|
| Longitude
|
Latitude
|
| 1. |
PLN Building |
1930 |
Jl. Jenderal Basuki Rahmat No.100, Klojen, Kec. Klojen, Kota Malang |
1 |
112.629894 |
- 7.974733 |
| 2 |
112.629945 |
- 7.974624 |
| 3 |
112.630066 |
- 7.974667 |
| 4 |
112.630168 |
- 7.974415 |
| 5 |
112.630181 |
- 7.974335 |
| 6 |
112.630283 |
- 7.974372 |
| 2. |
Kayuta
ngan Church
|
1905 |
Jl. MGR Sugiyopranoto No.2, Kiduldalem, Kec. Klojen, Kota Malang |
1 |
112.630810 |
- 7.980633 |
| 2 |
112.630787 |
- 7.980755 |
| 3 |
112.631025 |
- 7.980814 |
| 4 |
112.631053 |
- 7.980691 |
| 5 |
112.631031 |
- 7.980785 |
| 6 |
112.631048 |
- 7.980717 |
| 3. |
Malang City Hall |
1927 |
Jl. Tugu No.1, Klojen, Kec. Klojen, Kota Malang |
1 |
112.633699 |
- 7.977873 |
| 2 |
112.633894 |
- 7.977987 |
| 3 |
112.633901 |
- 7.977961 |
| 4 |
112.634069 |
- 7.977986 |
| 5 |
112.634068 |
- 7.978013 |
| 6 |
112.634259 |
- 7.977975 |
| 4 |
Malang Railway Station |
1920 |
Jl. Trunojoyo No.10, Kiduldalem, Kec. Klojen, Kota Malang |
1 |
112.637040 |
- 7.977139 |
| 2 |
112.637130 |
- 7.977132 |
| 3 |
112.637193 |
- 7.977954 |
| 4 |
112.637118 |
- 7.977955 |
| 5 |
112.637089 |
- 7.977606 |
| 6 |
112.636996 |
- 7.977610 |
| 5 |
Frateran School |
1926 |
Jl. Jaksa Agung Suprapto No.21, Samaan, Kec. Klojen, Kota Malang |
1 |
112.631327 |
- 7.971261 |
| 2 |
112.631134 |
- 7.971651 |
| 3 |
112.630639 |
- 7.971403 |
| 4 |
112.630798 |
- 7.971071 |
| 5 |
112.630877 |
- 7.971106 |
| 6 |
112.630757 |
- 7.971339 |
Research method
The evaluation of visibility analysis involved a photographic survey, 2D isovist area analysis, and 3D isovist or viewshed analysis. Photographic surveys were conducted in the field to obtain sequential photo mapping, which was then processed using the segmented visual analysis view method in graphical representation. The analysis of the 2D isovist area aimed to determine the observer's field of view from the observation point during the sequential photo mapping stage. Meanwhile, 3D isovist or viewshed analysis produced a pattern of the visual field spectrum as visualisation tools for assessing historical urban landmarks.
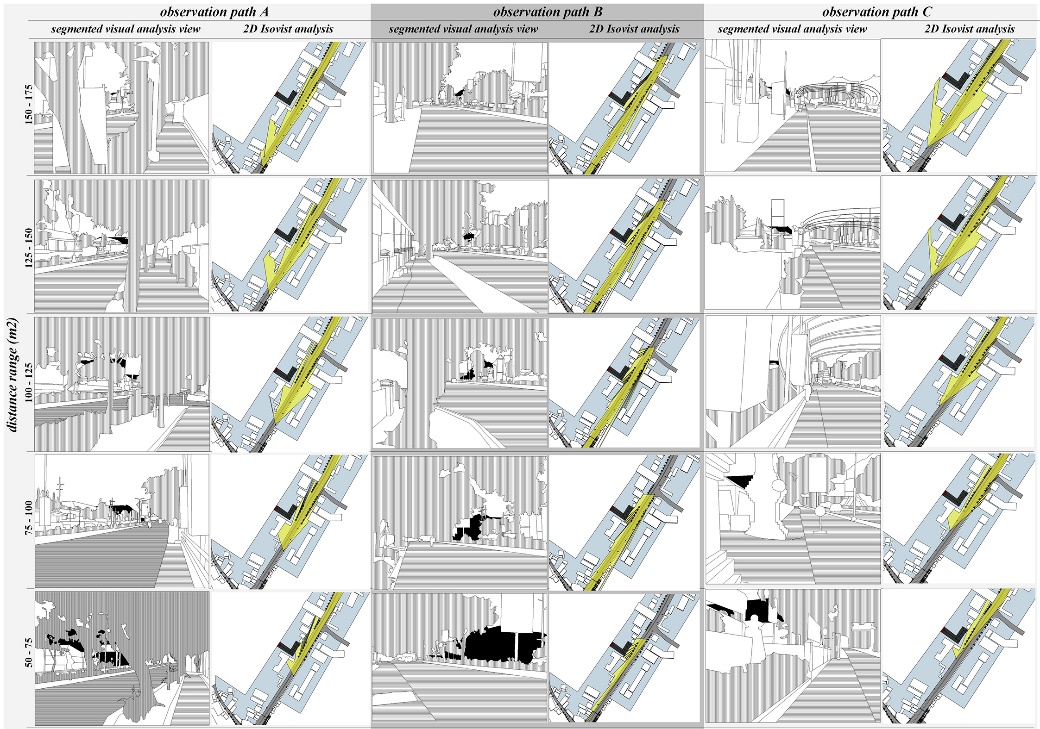
This study investigated a sequential view series of selected buildings, which are historical landmarks in Malang. These buildings were chosen along transportation and accessibility centrelines, focusing on the most prominent visibility points and intervals in these series. Three road axes were selected for analysis representing different perception ranks, including ascending and descending motion pathways and vertical and horizontal directions through historical landmark buildings (Chen, Lin et al., 2016). The points where sequential photos were taken were at consistent distance intervals (Liu and Nijhuis, 2020). Sequential photo mapping was divided into five distance ranges in meters: 50-75, 75-100, 100-125, 125-150, and 150-175 meters, with each range spanning approximately 25 meters. The shortest distance was 50 meters, and the longest was 175 meters, based on the average farthest distance visible for each historical building object. An overview of the overall research method procedure can be seen in Figure 2.
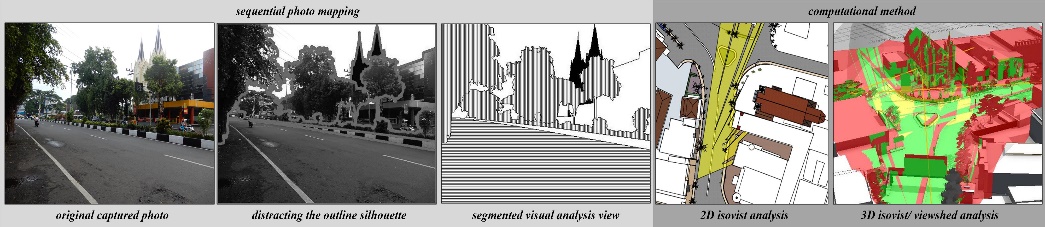
In the first stage, sequential view analysis cards are configured to elucidate the visibility of historical landmark buildings in the acquired sequential photos. The next step involves applying the interference of the outline silhouette and segmentation systems to construct sequential view frames within these cards. Then, the sequential view sets, illustrated with charts, are prepared. Furthermore, converting photo series into abstract representations is needed to thoroughly interpret the constant distinction, rhythm, visual entity, and building visibility. Consequently, visual photo sets have been constructed, comprising a linear visual photo created through the segmentation method, including the point from which the photo was taken and the movement path. During this stage, the measurement of the visibility percentage of each historical landmark appearance against fields of view in each observation path is also conducted.
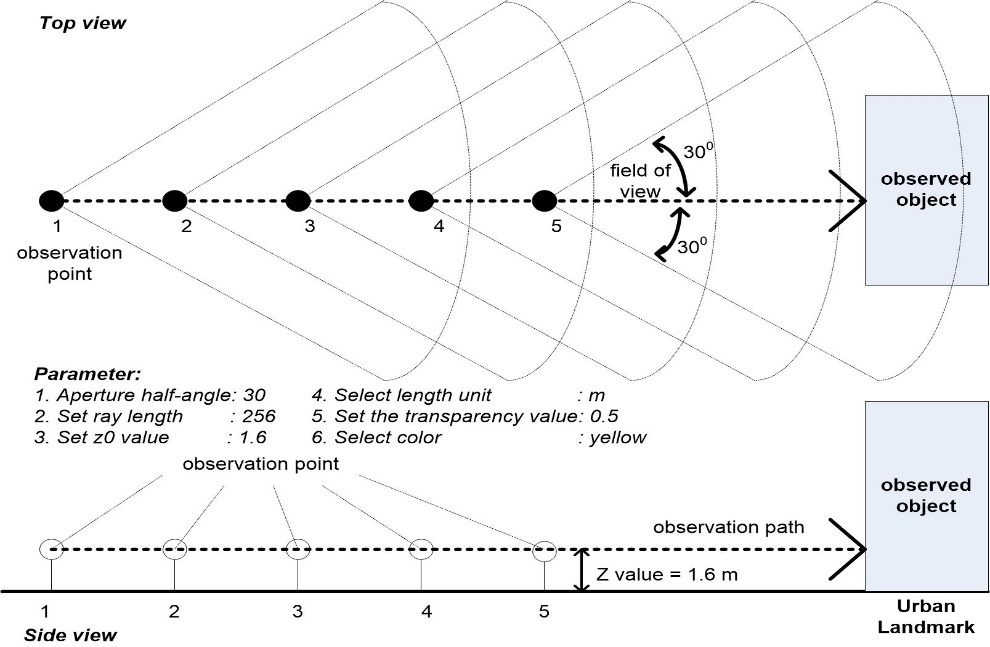
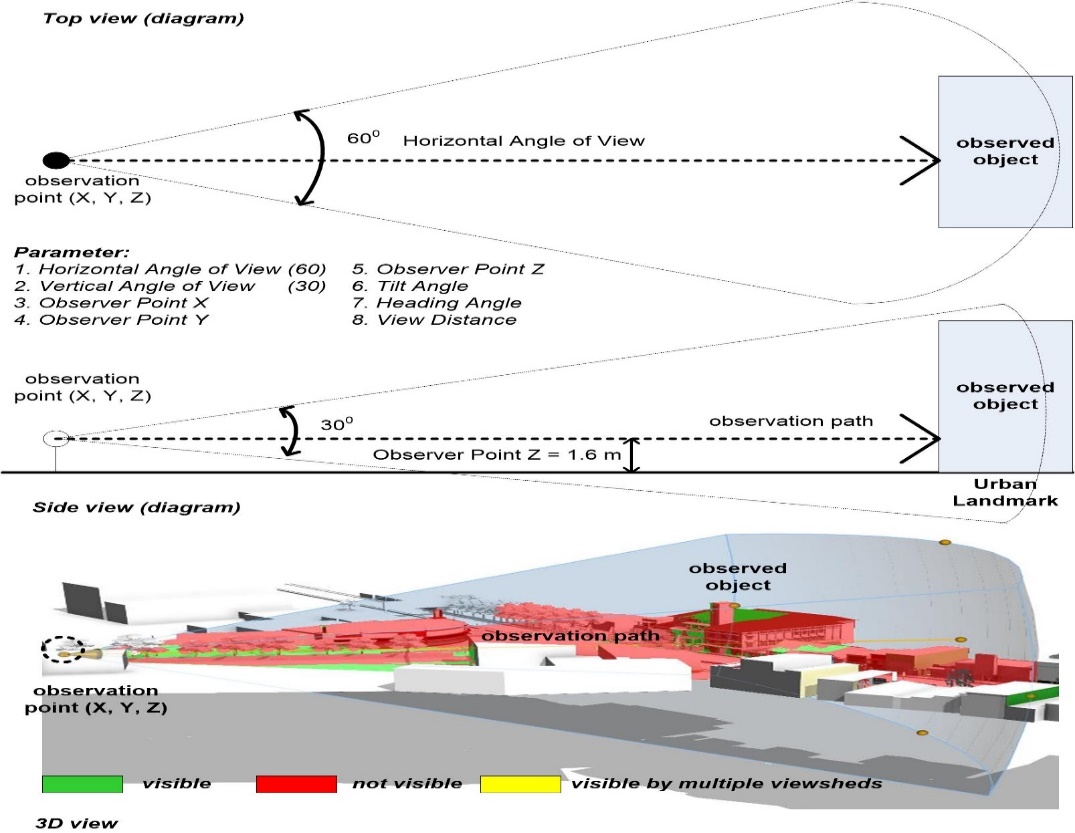
The 2D and 3D isovists are essential tools for performing visibility analysis. Visibility analysis is one of six predominant mapping methods available and is efficient for interpreting and understanding spatial-visual landscape characteristics (Liu and Nijhuis, 2020). Initially, computational 3D modelling analysis is performed through 2D isovist area analysis, utilising the SketchUp plugin T4SU, a tool developed by Harwell and Leduc in 2016 for SketchUp software (Hartwell and Leduc, 2016). Isovists represent the visible surface in two and three dimensions at a given point defined by the built environment, typically at a pedestrian or driver's eye level (1.6 meters) with a field of view of 60°. The isovist concept is established at a particular observation point, causing changes in the shape of the visible surface as the observation point moves, offering insights into how people interact with and navigate through urban spaces (Chen, Lin et al., 2016). This method helps in comprehending how people perceive and navigate urban spaces. Isovist analyses define visibility within the built environment, where fields of view from the periphery of the historical building are applied to calculate visible or invisible areas by the observer.
In the subsequent stage, the 2D isovist area is analysed with the help of computational 3D modelling within each historical landmark area. 2D Isovist analysis uses the help of SketchUp software with the T4SU plugin developed by Hartwell and Leduc (2016). Subsequently, the isovist area at each observation point is analysed and calculated (Hartwell and Leduc, 2016). The results of the 2D isovist area measurements determine the extent of the observer's viewing area in each observation path within each historical landmark area (see Figure 3).
The 3D isovist or viewshed analysis employed computational 3D viewshed analysis using City Engine software (Kelly, 2021). The analysis of 3D isovist or viewshed uses the help of a new Visibility Analysis tool, the viewshed tool, on CityEngine software. The Viewshed Creation tool shows visibility from a camera-like observer to a specified target in order to identify visible and non-visible objects in a specified extent. Besides delivering visibility calculations by highlighting model areas that are visible or not from a specific location under a specific field of view, City Engine offers a variety of tools for measuring distances and areas in 3D scenes. This viewshed analysis generates the visual field spectrum, creating a distinctive pattern indicating the visibility of each historical landmark building due to the three-dimensional mapping of observation fields along the three sequential view paths. The results of this 3D isovist or viewshed analysis will provide an interactive three-dimensional visualisation of each building. There are three colour spectrum categories, green, yellow, and red, symbolising the level of visibility in sequence (see Figure 4).
Results
Visibility is a crucial aspect of urban design, as it can influence the perception and experience of the built environment, especially for historical landmark buildings. One approach to investigating visibility is through sequentially captured photos, which can provide insights into how the visibility of a particular object or feature changes over time or from different vantage points. Visibility analysis calculates the visibility percentage by dividing the area of the historical building visible from the observer's point by the total area of the urban scape visible from the same point. This results in the proportion measurement of the urban scape visible from the historical building's location.
Sequential Photo Mapping
Photographic surveys of sequential views are essential for assessing the visibility and historical context of urban heritage sites. They provide a valuable record of the changes that have occurred over time and can help to inform conservation, management, and research efforts. There is no single best visibility percentage for a historical building in an urban scape. The ideal visibility percentage will depend on the building's historical and cultural significance, location within the urban scape, and intended use and purpose. A higher visibility percentage may be desirable for historical buildings that serve as landmarks or tourist attractions, as this can increase their visibility and promote their cultural and historical value.
Sequential photo mapping analysis on three observation routes of the five historic landmark buildings in Malang City presents the results of a segmented visual analysis view, which shows measurements of the proportion of visual visibility of historic landmark buildings to the entire urban scape area captured in photo mapping at each observation point. In addition, based on the results of the degree of visibility of historical landmark buildings at each observation point on each observation path, it shows how stable and continuous the appearance of the form or visual clues of historical landmark buildings is and will have a high chance of contributing to the attractive historical visual character of the city image.
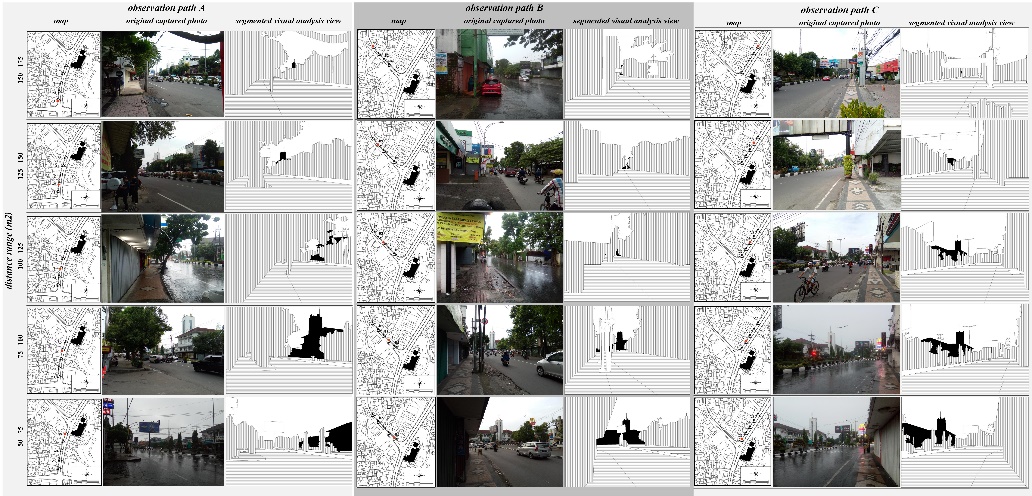
Sequential photo mapping analysis results on PLN buildings show that Route A and Route C have a better visual visibility pattern or building visual clue than Route B (see Figure 5). The percentage of PLN building visibility on route B does not show a representative proportion of building visual visibility due to the curved shape of the observed roads, causing other buildings and road furniture to cover the visual appearance of the PLN building.
Sequential photo mapping analysis results for the Kayutangan Church building show that only route A exhibits a better visual continuity pattern or visual building clues compared to routes B and C. The percentage of the Kayutangan Church visible on routes B and C does not optimally represent the proportion of the building's visibility due to the curved shape of these roads, which have inclines causing other buildings, trees, pedestrian bridges, and various road furniture to obstruct the Kayutangan Church's visual appearance.
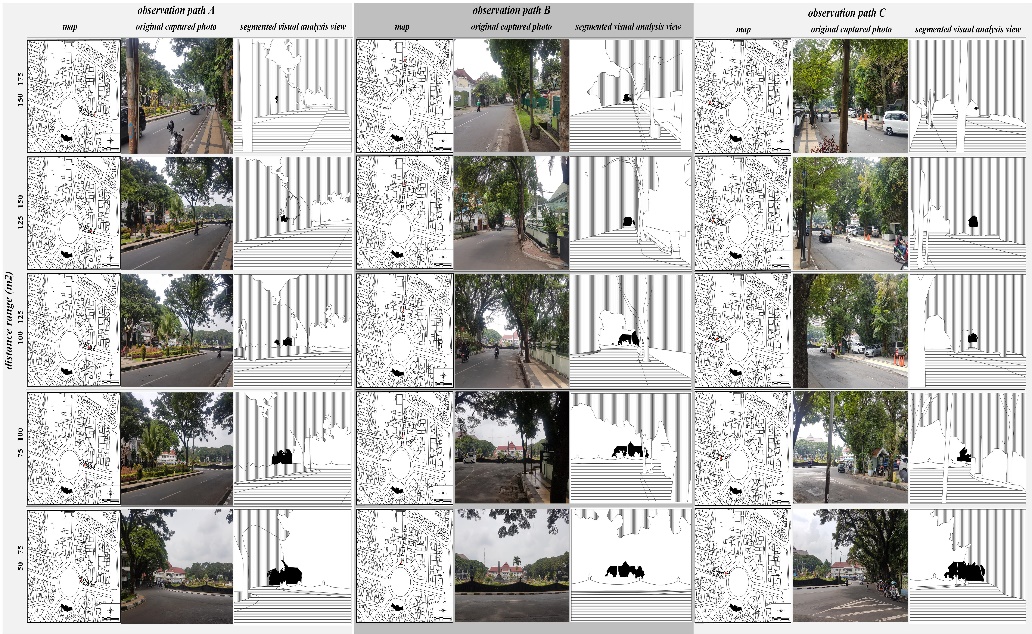
Sequential photo mapping analysis results for Malang City Hall reveal that only lane B displays better visual continuity patterns or building visual clues than lanes A and C. The visibility percentage of Malang City Hall on lanes A and C does not adequately represent the visibility of the buildings due to the positions of roads B and C. These roads do not lead directly to the Malang City Hall building, and there is a significant volume of dense trees along routes A and C.
Sequential photo mapping analysis results at Malang Railway Station show that lines A and B have better visual continuity patterns or visual building clues than line C due to the position of the two roads perpendicular to the station building. The visibility percentage of Malang Railway Station on line C does not show a representative proportion of visible buildings due to the density of trees along the station building, which covers most of the building's visual appearance.
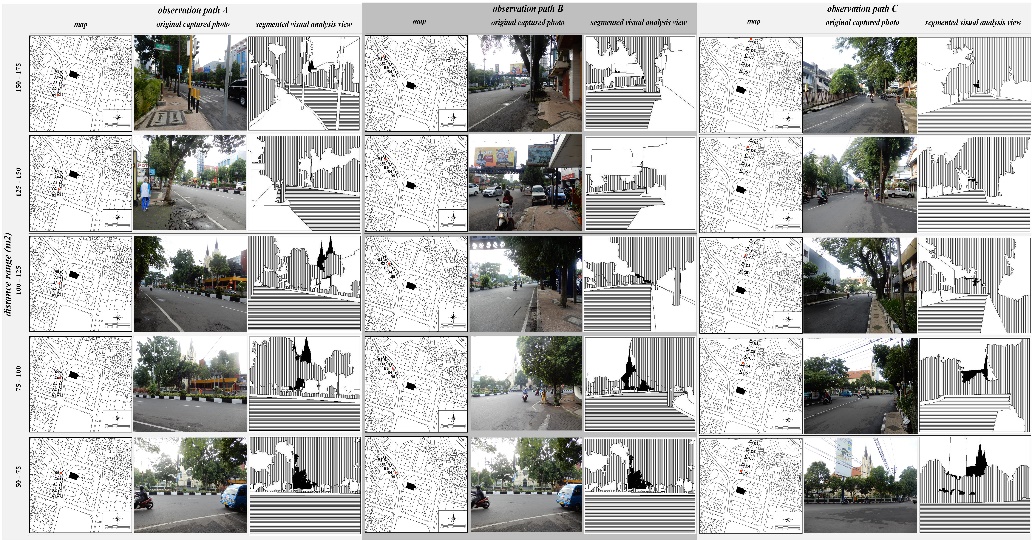
Sequential photo mapping analysis results at Frateran School show that observation route B has a better visual continuity pattern or building visual clue than routes A and C because the road elevation is almost parallel to the Frateran School building's ground level. Meanwhile, the percentage of Frateran School visibility on lines A and C does not show a representative degree of the proportion of visible buildings due to the height of the road surface, which is lower than the ground level of the Frateran School building, as well as the curved shape of the road and the observation position, which is mainly covered by trees and road furniture.

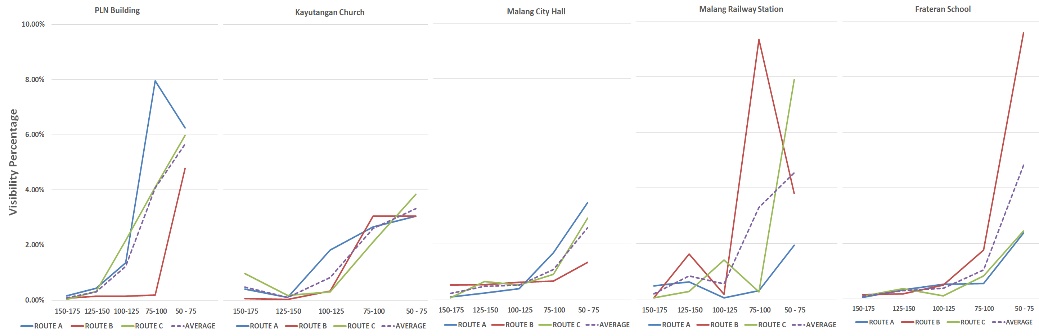
Based on the overall sequential photo mapping analysis, the historical landmark building with the highest percentage of visibility in the distance range of 150-175 meters is Kayutangan Church, while that in the distance range of 125-150 meters is Malang Railway Station. The PLN Building ranks the highest percentage visibility value in the distance range of 100-125 meters, followed by Malang Railway Station in the distance range of 75-100 meters. Meanwhile, the landmark building with the highest percentage visibility value in the distance range of 50-75 meters is Frateran School (see Table 2).
Table 2. Visibility percentages of historical landmark buildings based on sequential photo mapping analysis
| Observation Path
|
Distance Range (meter)
|
| 150-175 |
125-150 |
100-125 |
75-100 |
50 - 75 |
| Visibility Percentage
|
PLN Building |
A |
0.16% |
0.44% |
1.36% |
7.95% |
6.24% |
| B |
0.07% |
0.14% |
0.15% |
0.19% |
4.78% |
| C |
0.02% |
0.32% |
2.17%
|
4.09% |
5.97% |
| Kayutangan Church |
A |
0.40% |
0.11% |
1.83% |
2.65% |
3.05% |
| B |
0.05% |
0.03% |
0.33% |
3.04% |
3.05% |
| C |
0.97%
|
0.17% |
0.31% |
2.11% |
3.84% |
| Malang City Hall |
A |
0.07% |
0.22% |
0.38% |
1.68% |
3.50% |
| B |
0.50% |
0.52% |
0.62% |
0.65% |
1.33% |
| C |
0.04% |
0.64% |
0.51% |
0.90% |
2.94% |
| Malang Railway Station |
A |
0.47% |
0.61% |
0.05% |
0.30% |
1.94% |
| B |
0.05% |
1.63%
|
0.17% |
9.35%
|
3.80% |
| C |
0.04% |
0.27% |
1.41% |
0.25% |
7.89% |
| Frateran School |
A |
0.05% |
0.32% |
0.52% |
0.56% |
2.38% |
| B |
0.15% |
0.18% |
0.50% |
1.75% |
9.58%
|
| C |
0.09% |
0.37% |
0.11% |
0.83% |
2.45% |
Note: The shaded cell indicates the highest percentage
Based on sequential photo mapping analysis, the visibility graph shows that the PLN building (route A & C), Kayutangan Church (route A & C), Malang City Hall (route B), Malang Railway Station (route A & B), and Frateran School (route B) have better continuity stability and percentage of visual visibility of historical buildings. This result is indicated by the average percentage value of visual visibility of historical buildings from the farthest to the closest observation distance (see Figure 10).
The 2D isovist analysis
Isovist analysis is used as a tool for understanding the spatial properties of buildings and urban environments. It can also be used to design more functional and liveable cities. The shape and size of isovists can reveal how people perceive and navigate through spaces (Hillier, 2007). Isovist analysis can be a valuable tool for urban designers and planners seeking to understand the complex relationships between urban form and human experience. By providing insights into how spatial configurations impact the experiences of residents and visitors, isovist analysis can inform urban design interventions that aim to improve the quality of life in these areas. In particular, isovist analysis can identify historical district areas that may require interventions to enhance accessibility, wayfinding, and legibility.
Table 3. 2D Isovist area of each observation path
| Observation Path
|
Distance Range (meter)
|
| 150-175 |
125-150 |
100-125 |
75-100 |
50 - 75 |
| 2D Isovist Area (m²)
|
PLN Building |
A |
6393 |
5573 |
8129 |
1630 |
744 |
| B |
4029 |
2467 |
2013 |
1082 |
1949 |
| C |
6986 |
7376 |
6993 |
5486 |
1212 |
| Kayutangan Church |
A |
5930 |
7228 |
1154 |
1574 |
582 |
| B |
9017 |
8344 |
6474 |
4775 |
2589 |
| C |
4898 |
3227 |
3030 |
3496 |
1610 |
| Malang City Hall |
A |
11136 |
11519 |
11439 |
10991 |
10227 |
| B |
967 |
6064 |
4544 |
13229 |
12973 |
| C |
3835 |
5269 |
6074 |
9606 |
11275 |
| Malang Railway Station |
A |
5273 |
4868 |
7211 |
7144 |
4628 |
| B |
7270 |
7122 |
7078 |
3465 |
979 |
| C |
23614 |
36138
|
45048
|
46805
|
37006 |
| Frateran School |
A |
31704
|
35660 |
37042 |
39042 |
38698
|
| B |
19913 |
19640 |
18656 |
17191 |
6659 |
| C |
31607 |
28546 |
28118 |
33363 |
33890 |
Note: The shaded cell indicates the widest area
The results of the 2D isovist analysis show that the field of view on the observation route of historical landmark buildings at Malang Railway Station Route C and Frateran School Route A has an isovist 2D area that increases gradually from the farthest to the closest observation point. Such a viewport form is the best form of progressively increasing sequential space experience that helps with interesting wayfinding in exploring the historical city space (see Table 3). Overall, a comparison of the results of the segmented visual analysis view with 2D Isovist analysis in the following figure explains the correlation of the percentage appearance of historical landmark buildings with fluctuating changes in isovist areas along the five observation points on three road routes attached to the position of historical landmark buildings (see Figures 11 to 15).
The 2D isovist area is the area of view of the observer from each observation point. Since the largest 2D isovist area represents the most extensive viewing area, it can support building visibility. If the 2D isovist area in one series of observation lines is almost always the same, it means that the road corridor has a constant field of view, as shown for PLN Building (route A & C), Kayutangan Church (route B & C), Malang City Hall (route B & C), Malang Railway Station (route B & C), and Frateran School (route B). On the contrary, if the 2D isovist value in one path fluctuates, it means that the area of view is not continuous, which can affect the value of building visibility in Malang, as shown for PLN Building (route B), Kayutangan Church (route A), Malang City Hall (route A), Malang Railway Station (route A), Frateran School (route A & C), and Malang City Hall (route B) (see Figure 16).
3D isovist or viewshed analysis
Viewshed analysis is an essential technique in visibility analysis that can be used to evaluate the visual impact of historical buildings in urban environments. City Engine is one tool of 3D modelling and urban design software that allows for creating detailed 3D models of urban environments, including historical buildings. The software includes a viewshed analysis tool that can be used to calculate the areas that are visible from a specific point or object in the 3D model. These tools can help identify the best locations for viewing historical buildings and help inform decisions on the placement of interpretive displays or other visual aids for visitors, as seen in Figure 17.
To conduct a viewshed analysis in City Engine, a 3D model of the urban environment must first be created. The 3D models must be constructed from external sources or using City Engine's built-in modelling tools. Once the 3D model is complete, the viewshed analysis tool can calculate the visible areas from a specific point. The viewshed analysis in City Engine uses a similar process to other viewshed analysis tools, where it considers the observer's height, the object being observed, and the surrounding topography. The resulting viewshed can be visualized in the 3D model, allowing for a detailed understanding of the visible or obscured areas from a specific point.
Viewshed analysis can be carried out simultaneously on several observation paths, and the identification of the visibility of historical landmark buildings can be seen directly on the exterior surface of the building. There are three colour symbols mapped on the exterior surface of the building, which symbolize the level of visibility of the building. The red colour represents the part of the building that cannot be seen; the green colour represents the part that can be seen, while the yellow colour represents the part of the building that can be seen from various observation paths from various street corridors. As illustrated in Figure 17, a viewshed analysis can be observed that can represent the area of view of observation in three dimensions (3D isovist) and can be equalised to the visibility percentage for each historical landmark building.
The viewshed analysis of five historical landmark buildings resulted in the production of an interactive and accurate mapping of the exterior of these buildings based on their level of visibility. These results help determine the optimal locations for viewing each historical building in the urban environment. By calculating the visible areas from specific points, it is possible to identify areas that provide the best views of the building, which can inform decisions on the placement of interpretive displays or other visual aids for visitors.
Conclusion and Future Work
The result of visibility analysis on five historical landmarks; the PLN building (route A & C), Kayutangan Church (route A & C), Malang City Hall (route B), Malang Railway Station (route A & B), and Frateran School (route B) have better continuity stability and have a representative percentage of visual visibility of historic buildings indicated by the average percentage value of visual visibility of historical buildings from the farthest to the closest observation distance range. While the result of the 2D isovist area, PLN Building (route A & C), Kayutangan Church (route B & C), Malang City Hall (route B & C), Malang Railway Station (route B & C), and Frateran School (route B) has a constant field of view and has the highest capability in supporting building visibility. Both results between sequential photo mapping and isovist analysis have similarities in most of the visibility levels in the five building study objects, strengthening the evaluation of visibility levels of the historical landmark buildings. Meanwhile, using the visual spectrum field through the help of computational 3D isovist or viewshed analysis, a mapping of the level of visibility of the building appearance of historical landmark buildings can be modelled in three dimensions from different observation routes accurately.
This study also pointed out three patterns of visibility of historical landmark buildings that were influenced by three patterns of building position on the pattern of the road corridor that crosses the building, namely the position of the building which is (1) on the crossing path (PLN Building, Kayutangan Church, Malang Railway Station), (2) on one road lane (Frateran School), and (3) on the ring road square (Malang City Hall). Therefore, several findings that affect the continuity and level of visibility for each historical landmark building can be identified as follows:
-
1.
The shape of the road is curved so that building elements and road furniture, including trees along the observation path, cover the visual appearance of historic landmark buildings
-
2.
The pattern of observed roads that do not directly form a continuous space for historic landmark buildings, and the position of the building is on one side of the movement path around a circular plaza
-
3.
The ground-level position of historic landmark buildings is higher than the high-level position of the observed route.
-
4.
The dimensions and width of the roads correlate with the horizontal and vertical dimensions of historic landmark buildings, which affect the level of visibility of buildings.
-
5.
The density of trees along the observation route on the road section covers the skyline openings and blocks the exposure of historic landmark buildings.
-
6.
The shape of the canopy character and the height of the trees affect the visibility of the position of the field of view of the observed historical landmark building.
In summary, combining analytical techniques between sequential photo mapping, 2D isovist analysis, and 3D isovist or viewshed analysis can enrich a comprehensive understanding of environmental spatial properties and provide valuable insights into the visitor experience and the effectiveness of signage and wayfinding in historical landmark building areas. Furthermore, historical landmark buildings with high cultural and historical significance should be prominent, while those with moderate or low significance may benefit from limited visibility to create a more immersive visitor experience. Therefore, the factors of the location and position of landmark buildings within paths of movement, the dimensions and width of the streets, the degree of openness of a building's skyline, as well as the control of the type and arrangement of street furniture elements, are essential as fundamental considerations in the planning and design of historical city spaces.
In conclusion, sequential photo mapping and isovist analysis are two complementary techniques that can be used to understand and analyse the spatial properties of architectural and urban environments. Sequential photo mapping can provide a highly detailed representation of the environment, while isovist analysis can provide insights into the visual and accessibility properties of space. The correlation between the results of sequential photo mapping and isovist analysis can be helpful in several ways. Isovist analysis can identify areas of interest or significance within a space, and sequential photo mapping can provide more detailed information about those areas. Similarly, sequential photo mapping can provide information about the physical properties of an environment that can be used in isovist analysis to understand the visual properties of space better. Preliminary research has proven that using the photographic survey method is an essential foothold in the visibility evaluation research of historical buildings (Kalın and Yılmaz, 2012). In comparison, current research has developed and implemented many computational tools by developing isovist, viewshed, and other computational analysis methods (Ascensão, Costa et al., 2019; Bhatia, Chalup et al., 2012; Chen, Lin et al., 2016, 2018; Dungan, White et al., 2018; Grasso, Verbree et al., 2017; Hartwell and Leduc, 2016; Kantner and Hobgood, 2016; Kelly, 2021; Kim, Kim et al., 2019; Koltsova, Tunçer et al., 2013; Mor, Fisher-Gewirtzman et al., 2021; Othman, Mohd Yusoff et al., 2019; Ren and Cao, 2021; van Bilsen, Jauslin et al., 2014; Yu and Ostwald, 2018). However, to the researchers’ knowledge, only a few studies have used a combination of photographic survey methods with isovist and viewshed analysis in evaluating the visibility of historical landmark buildings (Liu and Nijhuis, 2020; Sukwai, Mishima et al., 2022).
Hence, controlling the valuable visual qualities and maintaining the precious sequential view of the historical landscape is essential to produce and maintain a continuous visual experience of pedestrians and the wayfinding roles of urban landmarks. A combination of visibility analysis methods through sequential view mapping, 2D isovist calculations, and 3D isovist or viewshed analysis in 3D modelling of historical landmark areas has the potential to provide a comprehensive visibility analysis and can be developed for similar research.
Author Contributions
Conceptualisation, H.S., A.Y.., H.T. and F.R.S.; methodology, H.S., A.Y., and F.R.S.; software, H.S. and M.S.A.; investigation, H.S.; resources, A.Y. and E.Z.; data curation, H.S. and E.Z.; writing—original draft preparation, H.S. and E.Z.; writing—review and editing, H.S., A.Y. and E.Z.; supervision, H.S. and F.R.S. All authors have read and agreed to the published version of the manuscript.
Ethics Declaration
The authors declare they have no conflicts of interest regarding the paper's publication. All co-authors have seen and agree with the manuscript's contents, and we certify that the submission is original work and is not under review at any other publication.
Acknowledgments
The authors gratefully acknowledge that the present research is supported by the Ministry of Research and Technology and the Higher Education Republic of Indonesia. We are also grateful to the LPPM Universitas Brawijaya for financial support for our research. Finally, we would like to express our sincere gratitude to all the individuals and organisations who have contributed to the publication of this research paper.
Funding Statement
This research was funded by the research grant Hibah Penelitian Unggulan (HPU) LPPM Universitas Brawijaya of 2022 Contract Number: 975.45 / UN10.C10 / PN / 2022.
References
- Bagnolo, V. and Manca, A. (2019). "Image Beyond the Form. Representing Perception of Urban Environment". Architecture, Civil Engineering, Environment, 12(2), 7-16. doi: https://doi.org/10.21307/acee-2019-018.
- Bendjedidi, S., Bada, Y., et al. (2019). "Urban Plaza Design Process Using Space Syntax Analysis: El-Houria Plaza, Biskra, Algeria". International review for spatial planning sustainable development, 7(2), 125-142. doi: http://dx.doi.org/10.14246/irspsda.7.2_125.
- Bhatia, S., Chalup , S. K., et al. (2012). "Analyzing Architectural Space: Identifying Salient Regions by Computing 3d Isovists". Proceedings of 46th annual conference of the architectural science association (AN-ZAScA), Gold Coast, QLD, Queensland, Griffith University.
- Boumezoued, S., Bada, Y., et al. (2020). "Pedestrian Itinerary Choice: Between Multi-Sensory, Affective and Syntactic Aspects of the Street Pattern in the Historic Quarter of Bejaia, Algeria". International review for spatial planning sustainable development, 8(4), 91-108. doi: http://dx.doi.org/10.14246/irspsda.8.4_91.
- Chen, C.-H., Lin, T.-J., et al. (2016). "From Isovist to Spatial Perception: Wayfinding in Historic Quarter". Environment-Behaviour Proceedings Journal, 1(3), 300-310. doi: https://doi.org/10.21834/e-bpj.v1i3.374.
- Chen, C.-H., Lin, T.-J., et al. (2018). "An Isovist Study for Wayfinding in Historic Quarter". Asian Journal of Behavioural Studies, 3(13), 8-21. doi: https://doi.org/10.21834/ajbes.v3i13.139.
- Cullen, G. (1961). The Concise Townscape. Reed Educational Professional Publishing, London.
- Dungan , K. A., White, D., et al. (2018). "A Total Viewshed Approach to Local Visibility in the Chaco World". Antiquity, 92(364), 905-921. doi: https://doi.org/10.15184/aqy.2018.135.
- Grasso, N., Verbree, E., et al. (2017). "Strategies to Evaluate the Visibility Along an Indoor Path in a Point Cloud Representation". ISPRS Ann. Photogramm. Remote Sens. Spatial Inf. Sci., IV-2/W4, 311-317. doi: https://doi.org/10.5194/isprs-annals-IV-2-W4-311-2017.
- Hartwell, K. and Leduc, T. (2016). "T4su : Analyses Et Représentations Des Vues Du Ciel, Du Soleil Et Des Saillances Paysagères Dans Le Contexte D'un Outil De Cao". Paper presented at the SAGEO 2016, Nice, France. https://hal.science/hal-01402727.
- Hillier, B. (2007). Space Is the Machine: A Configurational Theory of Architecture. Cambridge University Press, Cambridge.
- Kalın, A. and Yılmaz, D. (2012). "A Study on Visibility Analysis of Urban Landmarks: The Case of Hagia Sophia (Ayasofya) in Trabzon". Metu Journal of the Faculty of Architecture, 29(1), 241–271. doi: https://doi.org/10.4305/METU.JFA.2012.1.14.
- Kantner, J. and Hobgood, R. (2016). "A Gis-Based Viewshed Analysis of Chacoan Tower Kivas in the Us Southwest: Were They for Seeing or to Be Seen?". Antiquity, 90(353), 1302-1317. doi: https://doi.org/10.15184/aqy.2016.144.
- Kelly, T. (2021). "Cityengine: An Introduction to Rule-Based Modeling". In Shi, W., Goodchild, M. F., et al. (Eds.), Urban Informatics (pp. 637-662). Springer Singapore, Singapore. Retrieved from https://doi.org/10.1007/978-981-15-8983-6_35. doi: https://doi.org/10.1007/978-981-15-8983-6_35.
- Kim, G., Kim, A., et al. (2019). "A New 3d Space Syntax Metric Based on 3d Isovist Capture in Urban Space Using Remote Sensing Technology". Computers, Environment and Urban Systems, 74, 74-87. doi: https://doi.org/10.1016/j.compenvurbsys.2018.11.009.
- Kiruthiga, K. and Thirumaran, K. (2017). "Visual Perception on the Architectural Elements of the Built Heritage of a Historic Temple Town: A Case Study of Kumbakonam, India". Frontiers of Architectural Research, 6(1), 96-107. doi: https://doi.org/10.1016/j.foar.2016.10.002.
- Koltsova, A., Tunçer, B., et al. (2013). "Visibility Analysis for 3d Urban Environments". Proceedings of eCAADe 2013: Computation and Performance–Proceedings of the 31st International Conference on Education and research in Computer Aided Architectural Design in Europe, Delft, The Netherlands, September 18-20, 2013, Faculty of Architecture, Delft University of Technology; eCAADe (Education … 375–383.doi: https://doi.org/10.52842/conf.ecaade.2013.2.375.
- Leduc, T., Miguet, F., et al. (2010). "Towards a Spatial Semantics to Analyze the Visual Dynamics of the Pedestrian Mobility in the Urban Fabric". In Painho, M., Santos, M. Y., et al. (Eds.), Geospatial Thinking (pp. 237-257). Springer Berlin Heidelberg, Berlin, Heidelberg. Retrieved from https://doi.org/10.1007/978-3-642-12326-9_13. doi: https://doi.org/10.1007/978-3-642-12326-9_13.
- Liu, M. and Nijhuis, S. (2020). "Mapping Landscape Spaces: Methods for Understanding Spatial-Visual Characteristics in Landscape Design". Environmental Impact Assessment Review, 82, 106376. doi: https://doi.org/10.1016/j.eiar.2020.106376.
- Lonergan , C. D. (2014). "Advancing Tsunami Risk Communication through Geographic Visualization". (Master), Simon Fraser University.
- Lu, Y. (2011). "Directed Visibility Analysis: Three Case Studies on the Relationship between Building Layout, Perception and Behavior". (Doctor), Georgia Institute of Technology.
- Lynch, K. (1964). The Image of the City. MIT press, Cambridge, Massachusetts.
- Mor, M., Fisher-Gewirtzman, D., et al. (2021). "3d Visibility Analysis for Evaluating the Attractiveness of Tourism Routes Computed from Social Media Photos". ISPRS International Journal of Geo-Information, 10(5), 275. doi: https://doi.org/10.3390/ijgi10050275.
- Morello, E. and Ratti, C. (2009). "A Digital Image of the City: 3d Isovists in Lynch's Urban Analysis". Environment and Planning B: Planning and Design, 36(5), 837-853. doi: https://doi.org/10.1068/b34144t.
- Othman, F., Mohd Yusoff, Z., et al. (2019). "Isovist and Visibility Graph Analysis (Vga): Strategies to Evaluate Visibility Along Movement Pattern for Safe Space". IOP Conference Series: Earth and Environmental Science, 385(1), 012024. doi: https://doi.org/10.1088/1755-1315/385/1/012024.
- Pettricia , H. A., Wardhani , D. K., et al. (2014). "Elemen Pembentuk Citra Kawasan Bersejarah Di Pusat Kota Malang". RUAS, 12(1), pp.10-23. doi: https://doi.org/10.21776/ub.ruas.2014.012.01.2.
- Porteous , J. D. (2013). Environmental Aesthetics: Ideas, Politics and Planning. Routledge, New York.
- Ren, L. and Cao, Y. (2021). "Gis-Based Viewshed Analysis on the Conservation Planning of Historic Towns: The Case Study of Xinchang, Shanghai". Int. Arch. Photogramm. Remote Sens. Spatial Inf. Sci., XLVI-M-1-2021, 609-616. doi: https://doi.org/10.5194/isprs-archives-XLVI-M-1-2021-609-2021.
- Sukwai, J., Mishima, N., et al. (2022). "Identifying Visual Sensitive Areas: An Evaluation of View Corridors to Support Nature-Culture Heritage Conservation in Chiang Mai Historic City". Built Heritage, 6(1), 23. doi: https://doi.org/10.1186/s43238-022-00071-z.
- Tutuko, P., Bonifacius, N., et al. (2021). "Measuring Spatial Arrangement of Indonesian Colonial Cities Using Depth and Connectivity Calculations: Ratio Study on Master Plans Using Space Syntax". International review for spatial planning sustainable development, 9(4), 67-81. doi: https://doi.org/10.14246/irspsd.9.4_67.
- van Bilsen, A., Jauslin, D., et al. (2014). "3d Isovist Analysis-Discovering New Horizons in Architecture as Landscape". Paper presented at the Geodesign Summit Europe, Delf. https://www.researchgate.net/publication/277476334.
- Yu, R. and Ostwald, M. J., (2018). "Spatio-Visual Experience of Movement through the Yuyuan Garden: A Computational Analysis Based on Isovists and Visibility Graphs". Frontiers of Architectural Research, 7(4), 497-509. doi: https://doi.org/10.1016/j.foar.2018.08.003.