Planning Analysis and Simulation
Evaluation of Special Economic Zone (SEZ) Impact on Economic Growth: Evidence of Simalungun Regency, North Sumatera, Indonesia

2023 Volume 11 Issue 4 Pages 113-130
Details
2023 Volume 11 Issue 4 Pages 113-130
This study examines the causal effect of the Sei Mangkei Special Economic Zone (SEZ) on the economic growth of Simalungun Regency, North Sumatera using the Synthetic Control Method (SCM). This study uses macro data at the district/city level in Indonesia. The counterfactual in this study was built using a synthetic control unit derived from data from 290 regencies/cities in Indonesia from 2006 to 2020. The results of the analysis conclude that the existence of the Sei Mangkei SEZ has not yet had an economic impact on the economic growth of Simalungun Regency. This finding contrasts with most previous studies which have found that SEZs positively impact the economic growth of the host region. The Sei Mangkei SEZ has not yet had an impact because currently, the utilisation of land and the search for new business actors who are expected to invest in the Sei Mangkei SEZ are still below the target.
The development of the global economy has encouraged many countries around the world to undertake various efforts to improve their economies. One such effort involves the development of special zones known by various names, including Special Economic Zones (SEZs), Bonded Zones (BZs), Free Trade Zones (FTZs), Export Processing Zones (EPZs), and others. In the mid-20th century, the three leading countries in SEZ management include: 1) The United States, as the SEZ pioneer, 2) China's Shenzhen city with the most successful SEZ model, and 3) India, which has the largest SEZ, used the policy of SEZ formation as a crucial component of their development strategies (Pakdeenurit, Suthikarnnarunai, et al., 2014). However, the development of special zones has raised a lot of debate among economists regarding their economic impact.
Special zones are oriented towards the export market through industrialization strategies. SEZs are usually small areas operating under more liberal economic regulations than is usually the case in the country. Through legislation, the government provides special treatment in the form of fiscal incentives that are not found outside the zones, to encourage regional economic growth (World Bank, 2009). In general, countries share a common direction and purpose in creating SEZs: increasing investment, reducing barriers to operations, and attracting investors. However, this policy brings diverse experiences and policy implications across different countries (Akinci and Crittle, 2008).

Like other countries in the world, over the last 10 years, the Indonesian government's initiatives to develop special zones have re-emerged with the establishment of Special Economic Zones in various regions in Indonesia. These SEZs represent the development of various economic zones that existed in the previous period. The main objective of SEZ development is to increase investment, foster economic growth, promote equitable development, and increase the nation's competitiveness (SEZ National Council Annual Report, 2018). In pursuit of this goal, the government provides incentives contained in the Economic Policy Package Volume VI, including tax, customs, and excise incentives, and facilitates the process of various forms of licensing related to economic activities in the SEZ (BAPPENAS, 2015).
The first industry based SEZ to be established and become operational was the Sei Mangkei SEZ in Simalungun Regency, North Sumatra. This SEZ was established through Government Regulation No. 29 of 2012 on February 27, 2012, and has been operational since 2015. The SEZ covers a land area of 2,002.7 hectares. By 2020, a total of 11 investors had invested in SEZ Sei Mangkeian investment commitment of 11.56 trillion rupiahs.
As a first-generation KEK, the marketing program for SEZ Sei Mangkei was extensive, both domestically and internationally. Some of the events used to promote the potential of Sei Mangkei included Thailand Inventors Day 2019 in Bangkok, 2nd Indonesia Investment Day 2019 in Singapore, Market Sounding Exhibition in South Korea, Regional Investment Forum (RIF) in Tangerang, and Indonesia Infrastructure Week (IIW) 2019 in Jakarta.
Sei Mangkei SEZ is sought to be the centre for downstream palm oil and rubber industries that have the carrying capacity for raw materials originating from North Sumatra. Sei Mangkei SEZ’s export destinations are spread across 39 countries with an export value of IDR 5.18 trillion in 2020 (SEZ National Council Annual Report, 2020). Interestingly, this is the first industrial area to have a railway line and the only SEZ with access to the Malacca Strait. The Sei Mangkei SEZ is directly connected to Kuala Tanjung Global Hub as a multipurpose port. This integrated transportation system is sought to facilitate the flow of goods so that business actors can be more efficient in operations and logistics. Consequently, it will increase the attractiveness for investors and ultimately have a significant impact on the economic growth of Simalungun Regency.

Based on Figure 2, over the last 15 years, the GRDP of Simalungun Regency has continued to increase. In 2020, the economic growth of Simalungun Regency experienced a slowdown, growing by only 1.01 percent compared to the previous year. The decline in economic performance was due to policy restrictions on mobility and community activities, including production activities and other economic activities as a result of the increasingly widespread Covid-19. Several economic sectors experienced contraction due to the decline in economic activity. The three sectors with the highest contraction were accommodation, construction, and manufacturing. However, not all sectors experienced contraction; there were sectors with high growth, namely the information and communication sector with a growth of 6.89 percent.
The economic sectors that make the largest contribution to the GRDP of Simalungun Regency are the agriculture, forestry, and fisheries sectors. One of the agricultural commodities that plays a major role in the economy of Simalungun Regency is oil palm (Statistics of Simalungun Regency, 2020). However, the value added of oil palm commodities, both in Simalungun Regency and at the national level, is still low because most of the harvested produce is only processed into crude palm oil (Fiscal Policy Agency, 2012). This encourages the government to make it easier for foreign and domestic investors to invest their capital through one of the downstream CPO industry cluster loci, namely SEZ Sei Mangkei.
According to the SEZ National Council Report, the cost of SEZ development reached 5.1 trillion rupiahs. Additionally, there is an opportunity cost from the fiscal incentives provided. Opportunity costs from fiscal incentives in SEZs have the potential to reduce state and local government revenues in terms of taxation and import duties. Besides the costs and opportunity costs incurred, there is a social cost of developing SEZs. The social costs manifest in the form of transferring resources from outside the area to SEZs without added economic value (only relocation and substitution effects), land acquisition, loss of agricultural land, and the possibility of regional economic disparities (Sihaloho and Muna, 2010). From the potential costs that may arise, the government hopes that they will be offset by the achievement of one of the SEZ development goals, namely increasing economic growth.
There is empirical evidence about the benefits of developing SEZs. The existence of SEZs has externalities and spillover effects on the local economy, including an increase in foreign investment, growth in the gross domestic product (GDP), wages, and employment opportunities in the SEZ location or in the surrounding area (Alder, Shao, et al., 2016; Cai, Xin, et al., 2021; Frick and Rodrígues-Pose, 2019; Jones, Li, et al., 2003; Leong, 2013; Pan and Ngo, 2016; Widianto and Yudhisthira, 2021).
Furthermore, potential positive effects from SEZs can be created through industrial agglomeration. The great success in places such as Third Italy, Baden-Wurttemberg, Silicon Valley, and Hollywood shows the role of industrial agglomeration through increasing productivity (Dursun, 2018). companies tend to cluster because Industrial agglomeration reduces the costs of transporting goods, labour, and ideas (Marshall, 1920; Niu, Liu, et al., 2018). When companies concentrate their production in SEZs, backward and forward linkages are created between companies located in SEZs and those outside (World Bank, 2017).
Backward linkage occurs when the location is between the supplier and the adjacent company, thereby reducing transportation costs for both raw materials and semi-finished goods. Meanwhile, forward linkage occurs when the agglomeration effect is reinforced through demand for production output (Ottaviano and Puga, 1998). Thus, companies within the SEZ can increase their productivity and produce on a more efficient scale through agglomeration compared to companies outside the SEZ (Aritenang and Chandramidi, 2020; Li, Wu, et al., 2021). It is further explained that the increased performance of companies within SEZs is also due to a selection effect, where SEZs strengthen competition between firms and crowd out firms with low efficiency, leaving only high-efficiency companies. Most companies located in SEZs achieve higher export values, higher output per worker, and higher capital intensity compared to companies located outside the SEZ in the same industry (Schminke and Van Biesebroeck, 2013).
On the other hand, SEZs may have a negative relationship with economic growth (Quaicoe, Aboagye, et al., 2017; Zheng, Barbieri, et al., 2016), which can be caused by exporting products originating from SEZs of low quality, leading to lower prices in the international market. Thus, the debate continues on whether the existence of SEZs can indeed increase the economic growth of the host district/city.
Most of the existing literature uses descriptive analysis, and not much is known about the effectiveness of SEZ formation on economic growth in Indonesia. Hence, it is important to assess their actual development impacts. Therefore, the main objective of this study is to evaluate the effectiveness of the policy.
Assuming direct and immediate spillover effects, this study examines the impact of special economic zones (SEZ) development on economic growth in Simalungun Regency using the Synthetic Control Method (SCM) designed by Abadie and Gardeazabal (2003). As a new method for impact evaluation, SCM can control confounding factors by utilising panel data. This paper makes two contributions. Theoretically, it investigates the impact of SEZs on economic growth in Simalungun Regency. Methodologically, it establishes a quasi-experimental design and adopts SCM to enhance causal inference. The analysis is conducted in two stages. First, a synthetic control region (counterfactual) is constructed through a combination of other regencies/cities that did not have an SEZ before the establishment of the Sei Mangkei SEZs in Simalungun Regency. Second, using 2015, which is the official year when the SEZ Sei Mangkei began operating as a natural experiment to estimate the impact of the existence of SEZs on economic growth in Simalungun Regency.
This study is structured as follows: Section 2 presents the literature review and hypothesis. Section 3 discusses the data and empirical methodology, while Section 4 discusses the empirical results. Section 5 presents the discussion, and Section 6 presents the conclusions.
According to the World Bank, Special Economic Zones (SEZs) with their various types —free trade zones, free ports, foreign trade zones, export processing zones, special economic zones, free export zones, trade and economic cooperation zones, economic processing zones, and free zones (Farole, 2011)— are areas that are geographically delimited by a separate customs area, controlled by regulatory agencies, and offer certain incentives for physically located businesses in the zone (Akinci and Crittle, 2008). Bernstein (2012), Farole (2011), and Murray (2013) define SEZ as an area with defined privileges by a country to attract foreign investors to invest in that country. SEZs provide convenience for investors in the form of preparing areas with access to global markets both through ports and airports, thus facilitating the implementation of export and import activities. In addition, SEZs offer both fiscal and non-fiscal incentives in the form of licensing, taxation, customs and excise, goods traffic, immigration, employment, and land (National Council for Special Economic Zones, 2019; Wang, 2013). The incentives given by the government are to increase competitiveness, especially in terms of attractiveness to Foreign Direct Investment (FDI), promote economic development, and accelerate industrialization (Zheng, Barbieri, et al., 2016).
The existence of this SEZ not only benefits the companies operating in it but also the regional and national economy. For host countries, SEZs can increase job creation, tax revenues obtained from companies operating in SEZs, and demand for input goods produced by the domestic market (Warr and Menon, 2015). Wang (2013) in his study concluded that SEZs increase FDI per capita by 21.7 percent in Chinese municipalities around SEZs. It is stated that foreign direct investment drawn by SEZs is a new activity, not a reallocation from non-SEZ areas. This finding is supported by Cheng and Kwan (2000) who use the province as the unit of observation. The province that hosts the SEZ attracts significantly more FDI than the other provinces.
Impact of Special Economic Zones (SEZ) on Economic GrowthSEZ is part of the government's strategy that aims to stimulate and catalyse economic development. The government hopes that providing incentives and facilities for investors in SEZs will pay off with the creation of a significant spillover effect on the local economy and long-term economic growth (World Bank, 2017). Empirically, several works of literature try to assess whether the existence of SEZs has a positive or negative impact on economic growth. Using city-level data in China, Jones, Li, et al. (2003) reported that special economic zones (SEZs) increase the economic growth of cities in China by 5.5 percentage points per year. Furthermore, it is explained that SEZs have an indirect impact on economic growth through their ability to attract foreign direct investment. The same result was presented by Pan and Ngo (2016), namely that the establishment of SEZs in Vietnam plays an important role in increasing economic growth. They explained that in Vietnam, SEZs tend to receive significant support from the government, thereby increasing FDI. Reinforcing previous findings, Leong (2013) in his analysis concluded that the presence of SEZs in China and India boosted regional growth, although it had little effect.
More recent studies by Alder, Shao, et al. (2016) analysed the effect of SEZ formation on economic development in China using GDP and light intensity as proxies for economic growth. The estimation used is difference-in-differences (DID) with the conclusion that the establishment of SEZ has a positive effect on GDP and GDP per capita of the city where the SEZ is located. The same proxy was used by Frick and Rodrígues-Pose (2019) who concluded that SEZs have a positive impact on the economic growth of the area around the zone, but the spillover impact decreases with increasing distance from the SEZ.
The same conclusion was conveyed by Cai, Xin, et al. (2021), by investigating through impact evaluation using pseudo DID decomposition. The results found that FTZ has a positive effect on local GDP growth rates and contributes to GDP per capita growth ranging from one-fourth to one-third of Shanghai's total GDP per capita growth rate. This effect is largely derived from the growth of the tertiary sector. In the context of Indonesia, Widianto and Yudhisthira (2021) conducted a study related to the influence of SEZs on regional economic growth. The study concludes that SEZs have a significant positive impact on district or city economic growth. However, the impact is relatively small.
Not all studies related to the role of SEZs in creating economic growth reach positive conclusions. According to (Quaicoe, Aboagye, et al., 2017), SEZ has a negative and significant relationship with economic growth in Ghana. As mentioned in his analysis, this is because most of the free zones are treated as enclaves, so the impact is not felt in the wider economy. However, the policy to expand the pocket is not the right decision. This statement is supported by Zheng, Barbieri, et al. (2016) who apply a two-way fixed effect model to examine the expansion of SEZs in China. They concluded that the size of the development zones —include free trade zones (FTZs), export processing zones (EPZs), high-tech development zones (HTDZs), economic and technological development zones (ETDZs), and industrial parks—has not proven to contribute to economic growth.
A study on the evaluation of the economic impact of the FTZ was also conducted by Possebom (2017). The results conclude that FTZ has a significant positive effect on real GDP per capita and total service sector production per capita. On the other hand, FTZ has a significant negative effect on total agricultural sector production per capita.
Overall, the relevant studies show mixed results regarding the spillover effects of Special Economic Zones (SEZs) on economic growth. However, in general, special economic zones are believed to have a positive impact on economic growth through their ability to attract FDI. This is consistent with the Harrod-Domar growth model (Todaro and Smith, 2015), that is, any net addition to the capital stock in the form of new investment will increase the flow of national output (GDP).
Empirical evidence related to the impact of special economic zones on local economic growth, especially in Indonesia, is still rarely examined in the previous literature. Analysis in this study using SCM allows researchers to systematically select a comparison group. In addition, this method can also explain the effect of confounding characteristics that change over time, through the weighted average of the control group. So that researchers can obtain more accurate analysis results.
This study uses annual panel data at the regency/city level in Indonesia covering the period from 2010 to 2020. The Sei Mangkei SEZ in Simalungun Regency officially operated in 2015, so this study uses the period before Sei Mangkei SEZ was in operation, namely from 2010 to 2014. The post-treatment period lasted from 2015 to 2020. The outcome variable in this study is the annual economic growth at the regency/city level which is approximated by GRDP growth data at the 2010 constant prices at the regency/city level. The data is sourced from the publication of the Regency/City Gross Regional Domestic Product (GRDP) in Indonesia. Due to the data availability of predictor variables, this study established an observation period from 2006 to 2020.
The predictor employed for the study was adapted from the variables used by Jones, Li, et al. (2003). Jones, Li, et al. (2003) estimate the effect of SEZ on economic growth by using Gross Domestic Product (GDP). The predictors of economic growth outcomes used in this study are investment (Foreign Investment (PMA) and Domestic Investment (PMDN)), population growth, human capital investment, and realization of local government capital expenditures (LGCE). Human capital investment is proxied by the percentage of the population aged 15 years and over with a high school diploma and above. This proxy is based on the highest employment absorption during the study period, namely workers with a high school education and above.
MethodologyThe methodology used to evaluate the impact of SEZ on economic growth follows the seminal articles written by Abadie and Gardeazabal (2003) and Abadie, Diamond, et al. (2010), using the Synthetic Control Method (SCM). SCM estimates treatment impact by constructing a weighted combination of pre-treatment outcomes from selected donor areas as counterfactuals. In contrast to the comparative Difference-in-differences (DID) study, which assumes the unobserved confounding effect is constant over time (parallel trend assumption), the SCM estimation method allows this effect to change over time. To capture this changing effect, the control group was weighted so that it had similar pre-treatment characteristics to the treated group.
The above procedure reduces the flexibility in selecting a comparison group for the units that receive treatment and forces the researcher to show characteristics that are as similar as possible between areas that receive treatment and those that do not. The selection of donor groups and their weighting is influenced by the outcome variable itself and the predictor variables that affect the outcome before treatment. The resulting synthetic control region closely matches the results of the affected area before the treatment was enacted and is counterfactual for the post-treatment affected area. After the treatment, the difference in outcomes between the areas that received the treatment and their synthetic controls indicates the effectiveness of SEZ development. Based on the previous description, SCM is an appropriate method for analysing the impact of the development of Special Economic Zones in Simalungun Regency.
Regency/City SelectionThe treated unit in this study consists of one regency, namely Simalungun Regency. The donor pool in the analysis using SCM consists of regencies/cities that do not have economic zones or areas that receive fiscal incentives from the government. Strict assumptions as in panel data regression and DID are not needed in estimating using SCM. However, there are 3 conditions needed to become a donor group from a synthetic control region for SCM to accurately estimate the impact of changes due to treatment (McClelland and Gault, 2017). First, regencies/cities in potential donor groups should not be exposed to the same or greater treatment as the regencies/cities receiving treatment. Second, data must be available for some periods before the treatment for both regencies/cities receiving treatment and regencies/cities in potential donor groups. Third, regencies/cities that become donor groups must have predictor values close to those of regencies/cities that received treatment in the pre-treatment period to avoid possible interpolation bias.
Among the 514 regencies/cities in Indonesia, 108 regencies/cities in which there are industrial areas — refers to the special area with many firms of the industrial and service sectors gathering within a certain region (Zhen, Gao, et al., 2017)— Integrated Economic Development Zones (KAPET), Free Trade Zones (FTZ), and other Special Economic Zones (SEZs) were issued from the donor group. This is done to fulfil the first absolute condition. Removing a regency or some regencies that have areas with fiscal incentives in them is justified because their existence tends to bias the impact of SEZ development on economic growth in Simalungun Regency. Furthermore, to fulfil the second absolute requirement, the 131 regencies that underwent division/merger during 2006-2020 were omitted from the analysis related to data availability. So that the remaining 290 regencies/cities will become donor groups. The third absolute requirement will be discussed in the next section.
ModelsThe model specification is based on the work of Abadie, Diamond, et al. (2010). In this model,
As only the first region (region “one”) is exposed to the treatment and only after period
The next step involves estimating
Since
Here,
Here,
The accuracy of the synthetic control model is assessed using the root mean square prediction error (RMSPE), a measure of the discrepancy between the path of the actual outcome variable for any regency/city and its synthetic counterpart (Abadie, Diamond, et al., 2015). The formula for RMSPE is:
A well-fitted model will yield a low RMSPE in the pre-treatment period, indicating that the synthetic control effectively replicates the actual outcomes with minimal error. The RMSPE is measured in the same units as the outcome variable and its level depends on the range of outcome variables.
In addition to the four control variables mentioned earlier, the predictor variables in this study also include the lag of the outcome variable. McCleland and Gault (2017) emphasized that the inclusion of lags affects the selection of donor groups and, consequently, the synthetic control model. Therefore, crafting an appropriate synthetic control model requires a judicious combination of lagged outcome variables. However, as noted by Kaul, Klößner, et al. (2015), including all lags for all years prior to treatment would render the other predictor variables ineffective.
Table 1 presents the variation in RMSPE across different lag combinations. The optimal RMSPE was achieved with a combination of four years (2006, 2008, 2011, and 2013). The inclusion of lag in this model did not significantly reduce the RMSPE or alter the estimation results. As such, this study utilises the combination of these four years of lagged data. The control variables are obtained from publications by the Ministry of Investment (BKPM) and the Central Statistics Agency (BPS).
| Lags of Outcome Variable | RMSPE |
|---|---|
| 2006 | 0.405508 |
| 2007 | 0.536054 |
| 2008 | 0.467179 |
| 2009 | 0.495164 |
| 2010 | 0.581733 |
| 2011 | 1.148209 |
| 2012 | 0.505764 |
| 2013 | 0.697622 |
| 2014 | 0.858820 |
| 2006; 2014 | 0.316946 |
| 2006; 2008; 2011 | 0.207503 |
| 2006; 2008; 2011; 2013 | 0.171222 |
In addition to assessing RMSPE, this method allows for placebo studies to be conducted to ensure that the observed discrepancies are attributable to the establishment of SEZs or due to other factors.
Placebo TestA placebo test was employed to evaluate the significance of the treatment effect (Abadie, Diamond, et al., 2015). In this study, the placebo test was utilised to assess whether the estimated impact was driven by the existence of SEZs or other factors. Specifically, a series of placebo trials was conducted by iteratively estimating the effect of the "placebo" treatment for each district/city within the donor group (i.e., regencies/cities that did not receive the actual treatment). This was achieved by initially assuming that these regencies/cities had SEZs introduced in the same year as Simalungun Regency and subsequently running a Synthetic Control Method (SCM) analysis. This iterative process generates a distribution of estimated “placebo” treatment effects for regencies/cities that do not have SEZs. If the distribution of placebo effects yields a gap as substantial as the treated area, it is deduced that there is insufficient significant evidence supporting the influence of the operation of Sei Mangkei SEZ on the economic growth of Simalungun Regency, and vice versa.
From this placebo test, statistical significance will be derived using the methodology established by Galiani and Quistorff (2017). The advantage of this nonparametric test lies in its avoidance of imposing any specific distribution on the error term. Given that the hypothesis formulated in this study pertains to the influence of the existence of SEI Mangkei on Simalungun’s economic growth, the two-sided p-value for each post-treatment year is as follows:
Where
This section will present the impact of the Sei Mangkei SEZ on the economic growth of Simalungun Regency and the placebo test.
Main ResultsThis section highlights an important feature of synthetic control estimators, namely the predictor means. To ascertain the impact of the Sei Mangkei SEZ, it is necessary to create a synthetic Simalungun Regency. The synthetic Simalungun Regency was formed by using a combination of other regencies/cities in the donor pool that were most similar to Simalungun Regency in terms of the pre-treatment period values of the predictor variables. The results are presented in Table 2, which presents a comparison of the pre-treatment predictor variables that reflect the characteristics of Simalungun Regency and its synthetic counterpart.
| Variables | Simalungun Regency | Average of control regencies | |
|---|---|---|---|
| Treated | Synthetic | ||
| Population Growth | 0.240528 | 0.221871 | 1.515432 |
| Human Capital Investment | 33.501390 | 33.053380 | 31.250815 |
| Investment | 181.542,9 | 179.224,2 | 396.393,6 |
| LGCE | 207.342800 | 204.843900 | 226.959338 |
| Economic growth 2006 | 4.755381 | 4.679543 | 6.137906 |
| Economic growth 2008 | 4.686577 | 4.610302 | 5.955208 |
| Economic growth 2011 | 5.960849 | 5.870032 | 6.22891 |
| Economic growth 2013 | 5.254180 | 5.164469 | 6.134756 |
Note: Average of control regencies means all other regencies from the donor group
In addition, these results were also compared with the average of 290 other regencies/cities in the donor pool. The average predictor variable for regencies/cities that did not receive similar or greater treatment did not appear suitable to be the control group in Simalungun Regency. Meanwhile, the synthesis of Simalungun Regency is quite accurate in forming the average value of predictor variables that are close to the actual data.
| Regencies/Municipalities | Weight | Regencies/Municipalities | Weight |
|---|---|---|---|
| Southeast Aceh | 0.001 | Purworejo | 0.120 |
| Samosir | 0.297 | Wonogiri | 0.017 |
| Medan Municipality | 0.142 | Surakarta | 0.008 |
| Cirebon Municipality | 0.051 | Yogyakarta Municipality | 0.030 |
| Kebumen | 0.317 | Bangkalan | 0.002 |
Note: only displays regencies/municipalities with non-zero weight
Table 3 displays the weights assigned to each regency/city in constructing the synthetic Simalungun Regency. The synthetic GRDP of Simalungun Regency before the establishment of Sei Mangkei in 2015 is best formed by a combination of 10 other regencies/cities, namely Southeast Aceh (0.001%), Samosir (0.297%), Medan City (0.142%), Cirebon City (0.051%), Kebumen (0.317%), Purworejo (0.120%), Wonogiri (0.017%), Surakarta (0.008%), Yogyakarta City (0.030), and Bangkalan (0.002). Meanwhile, the other 280 regencies/cities in the group have a weight of 0.
Figure 3 on the left illustrates the trajectory of economic growth in Simalungun Regency and its synthetic counterpart during the period 2006 to 2020. The red line represents the year when the Sei Mangkei SEZ was established. The trajectory formed by the synthetic control in the pre-treatment period indirectly validates the reliability of the SCM. The alignment of the synthetic control trajectory with the Simalungun Regency's actual trajectory before the establishment of the Sei Mangkei SEZ confirms the accuracy of the synthetic control method. The pre-treatment period prior to the formation of the Sei Mangkei SEZ is effectively replicated by each synthetic control, demonstrating the SCM's capability to accurately estimate the counterfactual and thereby assess the impact of the SEZ's establishment.
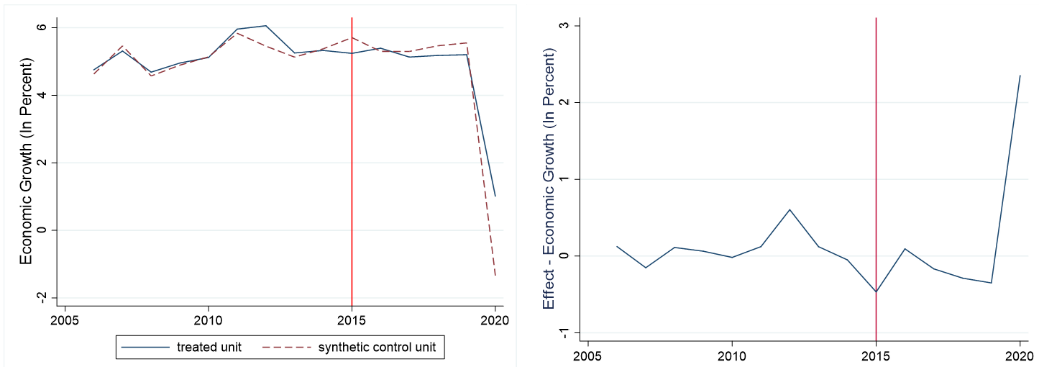
The estimation results regarding the impact of the operation of the Sei Mangkei SEZ on economic growth in Simalungun Regency are depicted through the gap between Simalungun and its synthetics which is visualized in Figure 3 on the right. In the period after the operation of the SEZ, namely 2015-2020, the economic growth gap between Simalungun and its synthetic area is very small and inconsistent, ranging from -0.17 to 2.33. In 2020, the estimated economic growth of Simalungun Regency will be about 2.33 percent higher relative to the Simalungun synthetic. From the estimation results, it can be said that the operation of the SEZ has not had an impact on the economic growth of Simalungun Regency. However, testing is needed to evaluate the significance of the estimation results. Referring to Abadie, Diamond, et al. (2015), this study conducted a placebo test in which the treatment was transferred to another regency/city.
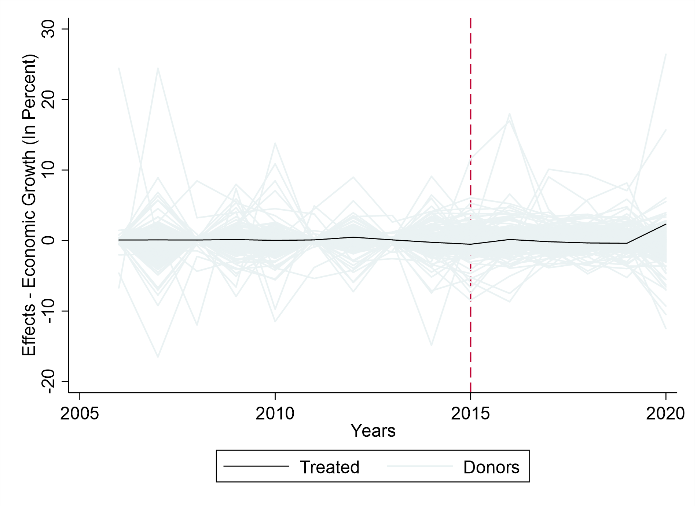
Placebo TestA graphical representation of the placebo gap estimate compared to Simalungun can be seen in Figure 4. The gap in economic growth between each regency/city in the donor group and their respective synthetic versions is represented by the grey line. The orange line shows the estimated gap for Simalungun Regency with its synthesis.
The orange line indicates that the synthetic method provides a very good fit for the economic growth of Simalungun Regency before Sei Mangkei SEZ officially operates. The pre-treatment RMSPE for Simalungun and the median pre-treatment RMSPE for the 290 regencies/cities in the donor group are quite small, namely 0.1712 and 0.6385, respectively. This shows that SCM can provide a good fit for economic growth before Sei Mangkei SEZ operates for most of the regencies/cities in the donor group.

However, for some regencies/cities, economic growth during the 2006-2014 period could not be reproduced properly by the convex combination of regency/city economic growth in the donor group. The regency/city with the worst suitability in the period before the operation of the Sei Mangkei SEZ was Bojonegoro Regency with an RMSPE of 8.99. The same problem arose in other regencies/cities with extreme economic growth values during the period before the operation of the Sei Mangkei SEZ.
If the synthetic control cannot accurately replicate Simalungun's economic growth during the pre-treatment period, then any interpretation of the post-treatment gap between Simalungun and its synthetic counterpart becomes unreliable. Similarly, placebo regencies/cities with poor fit during the pre-treatment period cannot provide a precise understanding of the treatment's effect (Abadie, Diamond, et al., 2010; 2011). Therefore, in this section, regencies/cities with pre-treatment RMSPE values exceeding 20 times that of Simalungun's RMSPE are excluded when generating placebo test charts and calculating p-values (Figure 5 on the left). However, there are still several lines with gaps that deviate from zero in the pre-treatment period. Figure 5 on the right is based on a lower cut-off, excluding districts with a pre-treatment RMSPE more than five times Simalungun's RMSPE. Figure 5 illustrates the estimated gap in Simalungun's economic growth and the distribution of the gap across 183 regencies/cities.

Figure 6 exclusively contains regencies/cities as good as Simalungun in the 2006-2014 period, namely regencies/cities with RMSPE pre-treatment not more than twice the RMSPE Simalungun. The evaluation results based on Figure 6 show that there is no significant difference between the Simalungun gap and the distribution of the remaining 50 regencies/cities gaps. Overall, based on the results of the placebo test both through graphic visualization and the pvals_std with a significance level of 5 percent, it can be concluded that Sei Mangkei SEZ has not significantly influenced the economic growth of Simalungun Regency.
The result of this study is in line with the findings of Quaicoe, Aboagye, et al. (2017) and Zheng, Barbieri, et al. (2016). Although SEZs have infrastructure that is generally superior to other regional economies outside SEZs, the impact has not yet been felt in the wider economy because the utilisation of various facilities, incentives, and ease of investment provided by the government has not resulted in the low productivity of SEZs as a pillar of development. Until now, land use and the search for new business actors who are expected to invest in Sei Mangke SEZ are still below the target (RI SEZ Council Year-End Report 2020, 2020). It was recorded that from 2015 to 2020 11 investors invested in Sei Mangkei SEZ. Of the 11 investors, four main players have operated and are engaged in the palm oil processing industry. The business actor occupies an area of 88.68 hectares or 6.12 percent of the total land area designated for industrial estates, which is 1349.42 hectares. So land use is still not optimal.
In 2020, investment commitments in the Sei Mangkei SEZ amounted to IDR 11.56 trillion, but only 45.5 percent was realized (IDR 5.26 trillion), so there has been no significant investment economically. In addition, the Sei Mangkei SEZ has only been operating for six years so the SEZ has not been able to have a significant impact on the economic performance of Simalungun Regency. It is hoped that optimal management of the SEZ, both in terms of land use and investment realisation, will be able to encourage Simalungun Regency's economic growth. This argument is reinforced by investment commitments which reach 11.56 trillion rupiahs or 41.85 percent of Simalungun Regency's GRDP in 2020, which is 27.62 trillion rupiahs.
Amirahmadi and Wu (1995) state the pitfalls limiting spillover effects from SEZs stem from inappropriate site selection, inadequate infrastructure, and poor institutional arrangements. Factors that influence the success of SEZs include the economic, institutional, and site selection factors (Ge, 1999). The World Bank (2017) describes several factors that influence the success of an SEZ: First, the preparation and design of the SEZ program as a whole which includes incentives, requirements for companies to obtain incentives, and program characteristics. Second, the characteristics of the SEZ are related to the location, the targeted sector, as well as the services and infrastructure within the SEZ. Third, the regional and national contexts where SEZs are located, which include the business climate, rule of law, access to markets, income levels, quality of human resources, and population density.
This study examines the effect of the Sei Mangkei SEZ on economic growth in Simalungun Regency using an SCM. The estimation results show that the establishment of Sei Mangkei SEZ, which began operating in 2015, has not had a significant impact on the GRDP of Simalungun Regency. This conclusion is also reinforced by the results from the placebo test, where the estimated gap for Simalungun Regency during the post-treatment period (2015-2020) is very small compared to the distribution of the gap for regencies/cities in the donor group.
This research contributes to the literature review related to the macroeconomic impact of the existence of SEZs on GRDP. While previous studies mostly showed the positive impact of SEZs, this study shows that there is no significant effect of the existence of SEZs in Simalungun Regency. We suspect that this insignificant impact of the Sei Mangkei SEZ on regional economic growth is due to the low level of investment. Only 45.5 percent of investment commitments have been realized since 2015. Apart from the fact that the Sei Mangkei SEZ has only been operating for the last six years, the impact of the SEZ depends on the preparation and design of the SEZ program as well as the specific local characteristics of the host area. Given that there is no economic impact caused by Sei Mangkei SEZ, the results of this study can be used as an evaluation or consideration for the Government. The government can improve flexibility of SEZ policies, so that it can increase the attractiveness to investors which will ultimately create an economic abundance for Simalungun Regency in the future.
This study only highlights whether the existence of SEZs affects economic growth in Simalungun Regency at the macro level. This study has not been able to explain the impact of SEZs in areas outside Simalungun Regency and the impact of Sei Mangkei SEZ in the long term due to limited data. Therefore, this study suggests further research using micro-level data so that it can measure the impact more deeply and capture the spillover impact of the SEZ on areas outside Simalungun Regency. In addition, in-depth research is needed to determine the long-term impact of the existing SEZ so that it can predict the magnitude of the SEZ’s impact in the future.
Conceptualization, N.H.S. and A.F.; methodology, N.H.S. and A.F.; software, N.H.S.; investigation, N.H.S. and A.F.; resources, N.H.S.; data curation, N.H.S.; writing original draft preparation, N.H.S.; writing review and editing, N.H.S. and A.F.; supervision, N.H.S. and A.F. All authors have read and agreed to the published version of the manuscript.
The authors declare that they have no conflicts of interest regarding the publication of the paper.
The authors would like to thank the Central Bureau of Statistics Indonesia for funding this study. Any flaw or weakness is the responsibility of the authors.
This research was funded by Central Bureau of Statistics Indonesia