Planning Strategies and Design Concepts
The Impact of Land Use Change on Land Surface Temperature 1990-2020 for Environmental Monitoring in Kapota Island, Wakatobi Regency, Indonesia

2024 Volume 12 Issue 2 Pages 43-
Details
2024 Volume 12 Issue 2 Pages 43-
Small islands have unique ecosystems and are vulnerable to land degradation and ecological threats. Integrating spatial and landscape ecology approaches greatly influences the effectiveness and efficiency of environmental monitoring and future environmental management planning. Uncontrolled land conversion, extreme climate conditions, high biophysical land constraints, and anthropogenic and political factors contribute to biodiversity pressures. This study aimed to measure the impact of land use and land cover changes on the LST, NDVI, and NDWI as well as changes in landscape patterns and structures for environmental monitoring and ecological sustainability on Kapota Island. The LST values in 1990 ranged from 21.50°C to 25.40°C, and from 22.63°C to 32.56°C in 2020. In contrast, the NDVI values in 1990 ranged from -0.765 to 0.754 and from -0.241 to 0.514 in 2020. The surface temperature increased in vegetated areas with low density, as well as in non-vegetated areas and settlements. Habitat fragmentation was relatively high, as indicated by the SHDI value closer to 1. Moving forward, future research should delve deeper into the specific drivers of biodiversity pressures, including uncontrolled land conversion, extreme climate conditions, biophysical constraints, and anthropogenic and political factors. Moreover, efforts should be directed toward maintaining a green cover exceeding 30%, enhancing vegetation density, minimizing land-clearing activities, and encouraging the cultivation of crops with good water storage capabilities. This research lays the foundation for a more nuanced understanding of the intricate dynamics at play on small islands and sets the stage for informed conservation and management strategies.
Climate change has been a global issue for several decades. Land and environmental degradation, the massive conversion of green fields to built-up land, mining activities, and the use of fossil fuels, are suspected to be among the causes of the increase in the Earth's surface temperature. Efforts to address this issue have led to its inclusion as one of the Sustainable Development Goals (SDGs) that must be achieved by 2030 (UNDP, 2023). The phenomenon of increasing surface temperatures on Earth is evident from geophysical disasters such as heatwaves that have recently affected several regions in Asia, including India, Bangladesh, Myanmar, China, Thailand, and Laos, with temperatures exceeding 40°C. Meanwhile, in Indonesia, temperatures have reached 34°C to 36°C (BMKG, 2023). In 2022, heatwaves occurred in Argentina, Uruguay, and Australia, with temperatures ranging from 44°C to 50°C (BMKG, 2023).
Land management and land use land cover (LULC) play a crucial role in land surface temperature regulation, as highlighted by Luyssaert, Jammet et al. (2014). According to Pal and Ziaul (2017), changes in LULC patterns are correlated with changes in land surface temperature (LST). The LST of an area is influenced by various factors, including the composition of the soil surface, vegetation cover, water availability, urban areas, and climatic conditions (Guha, Govil et al., 2020). Measuring LST and greenness indices can serve as indicators for drought levels (Karnieli, Agam et al., 2010) , sustainable urban planning, climate change adaptation (Maimaitiyiming, Ghulam et al., 2014), as well as spatial policy planning and control (Tran, Pla et al., 2017).
Spatial planning variation of the land and population growth contribute to an accelerated rate of land conversion, which consequently affects LST as green cover decreases. The conversion of forests into settlements has been known to lead to an increase in temperature (Fu and Weng, 2016), thus contributing to the formation of urban heat islands, particularly in developed urban areas. Additionally, extreme climatic conditions characterized by imbalanced rainfall and drought, as well as rock geomorphology dominated by coral formations with low absorption and high reflection or scattering, also influence surface temperature. Moreover, the conversion of land, variations in LST, and climate change collectively have significant impacts on the decline of biodiversity (Kafy, Al Rakib et al., 2021) .
Small islands possess valuable resources that, if properly managed, can contribute to the economic improvement of the local community and region. However, the development of small islands also pressures the environment, particularly the land. Small inhabited islands are highly vulnerable to the impacts of climate change. Phenomena such as sea level rise (Nerem, Beckley et al., 2018) and drought increase the risks of species extinction due to habitat destruction and fragmentation. Therefore, prioritizing land management and conservation efforts on small islands is essential for ensuring long-term sustainability. Additionally, changes in LULC are closely intertwined with socioeconomic patterns (Buyantuyev and Wu, 2010). Spatial approaches can be employed to manage land use and facilitate ecological planning for small islands (Ai, Yang et al., 2022).
Kapota Island, located in the Wakatobi Regency, possesses great potential as a tourist destination that can contribute to the economic development of the region. Its natural beauty and cultural heritage make it an attractive location for tourists to visit. However, to fully harness this potential, it is crucial to have adequate tourism infrastructure and facilities, particularly in terms of accessibility to tourist attractions, accommodation, souvenir outlets, clean water supply, restaurants, and other supporting amenities. However, on the other hand, the growth of tourism has become a driving force behind urbanization and land use changes (Shi, Jiang et al., 2023). As a result, the impact on the environment and the management of Kapota Island may intensify due to land availability and the imbalance between supply and demand. The imbalance between the demand for resources and the availability of land on small islands can be managed and monitored by leveraging remote sensing technology, GIS, and landscape ecology. The utilization of technology for environmental monitoring offers high efficiency and numerous advantages due to the availability of diverse data and information collected from various sources. This serves as the underlying rationale for conducting this research.
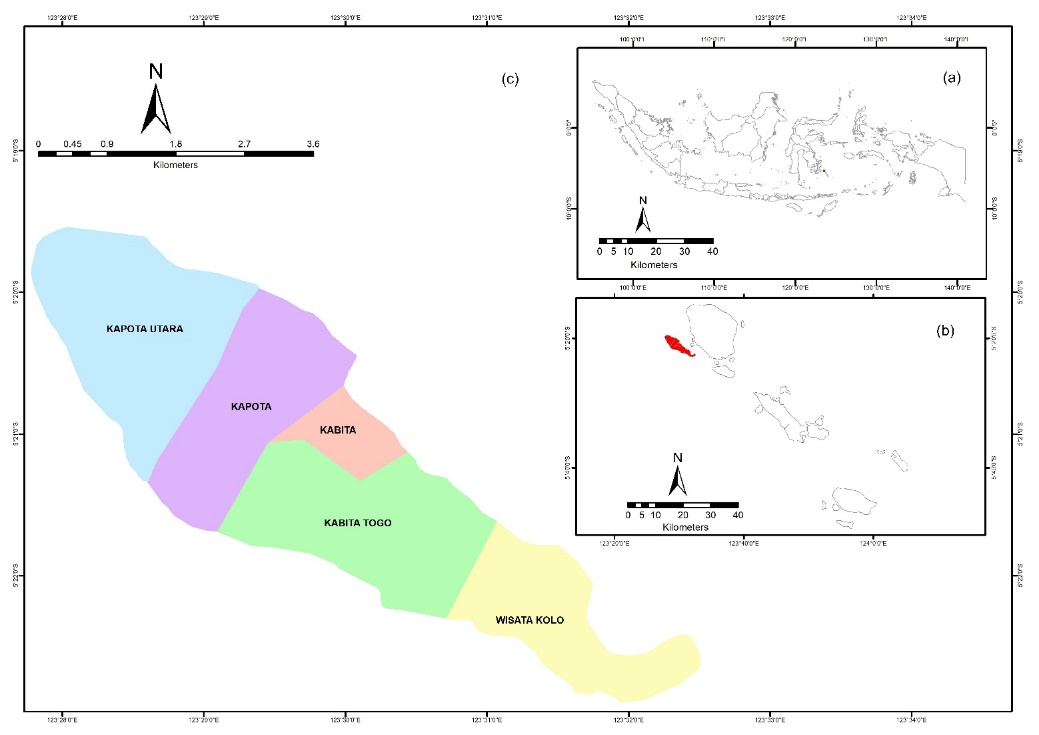
Kapota is one of the islands in the Wakatobi Archipelago, located southwest of Wangi-Wangi Island, the capital of Wakatobi. Administratively, it consists of five villages: Kapota, Kapota Utara, Kabita, Kabita Togo, and Kollo, with a population of 1.479 people in the year 2022 and a total area of 1.802,73 hectares (BPS Kabupaten Wakatobi, 2023). There is no climate observation station on Kapota island, therefore weather data used in this study was obtained from the Meteorological Station Class III in Betoambari, BauBau, Southeast Sulawesi. The island has a moderate or semi-arid climate, with an average annual temperature ranging from 41.8°C to 32.10°C during 2012-2022. Dry months occur in August, September, and October, with the peak of the dry season in August. On the other hand, the wet season (rainy season) takes place in December, January, and February, with the peak occurring in December.
The data used in this research consists of multitemporal satellite imagery, climate data, socio-economic data, and biophysical data. The satellite imageries used have cloud cover of less than 15%, considered the best data available on the USGS website https://earthexplorer.usgs.gov/ (Table 1). Landsat 7 ETM+ experienced stripping issues in 2003, therefore for 2009, Landsat 5 TM data was used. They were used for LULC classification and LST analysis. Schematically, the steps to obtain LULC and LST data are depicted, starting from satellite image processing, land cover classification, land cover change, and land surface temperature (LST) as shown in Figure 4. Climate data, including temperature, humidity, and precipitation, were obtained from PowerNASA to provide an overview of the local climate conditions. Since the research location does not have a weather observation station, weather data was obtained from the Meteorological Station Class III in Betoambari, located in the city of Baubau. Tourist visitor data and economic growth rates were obtained from multi-year statistics of Wakatobi Regency. Biophysical environmental data including soil types, rock formations, morphology, and slopes, were extracted from the Wakatobi Regency’s planning documents.
| Sensor | Acquisition Dates | Bands | Resolution | Cloud cover |
|---|---|---|---|---|
| Landsat 5 TM | 1990-07-19 | 3,2,1,6 | 30 (m) | <15% |
| Landsat 7 ETM+ | 2001-08-10 | 3,2,1,6 | 30 (m) | <15% |
| Landsat 5 TM | 2009-06-21 | 3,2,1,6 | 30 (m) | <15% |
| Landsat 8 OLI | 2020-08-22 | 4,3,2,10 | 30 (m) | <15% |
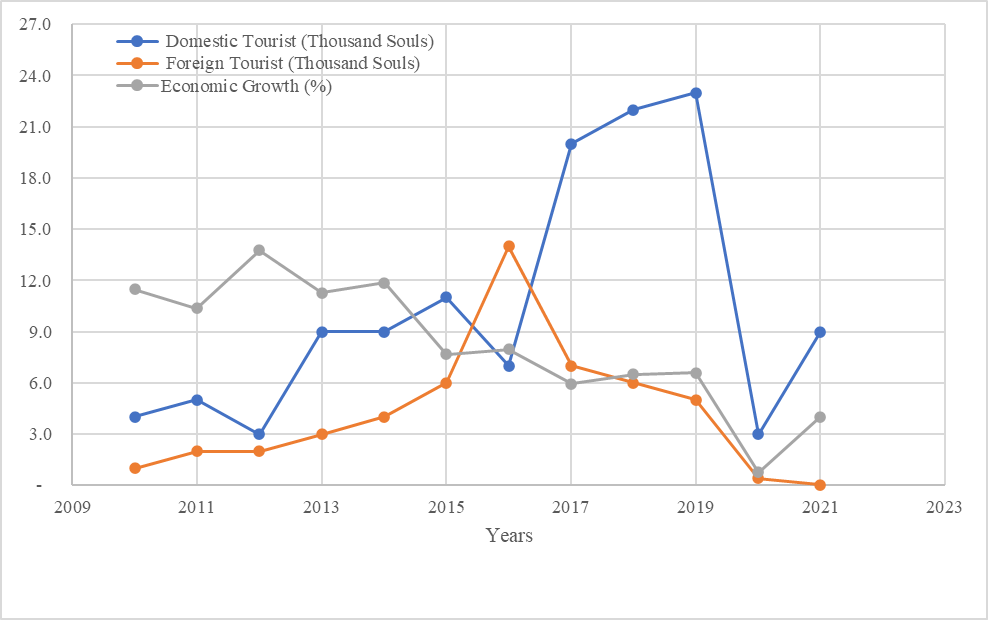
Wakatobi Regency has been designated as one of the ten National Strategic Tourism Areas by the Indonesian government through Government Regulation Number 50 of 2011 concerning the Master Plan for National Tourism Development. The purpose of this designation is to enhance the country's revenue from the tourism sector. Data indicates that from 2010 to 2019, the number of domestic and international tourist visits to Wakatobi Regency steadily increased (BPS Kabupaten Wakatobi, 2022). However, in 2020, there was a decline in tourist arrivals due to the impact of COVID-19. The decrease in the number of tourists has affected several service sectors and consequently influenced the rate of economic growth (Figure 2).
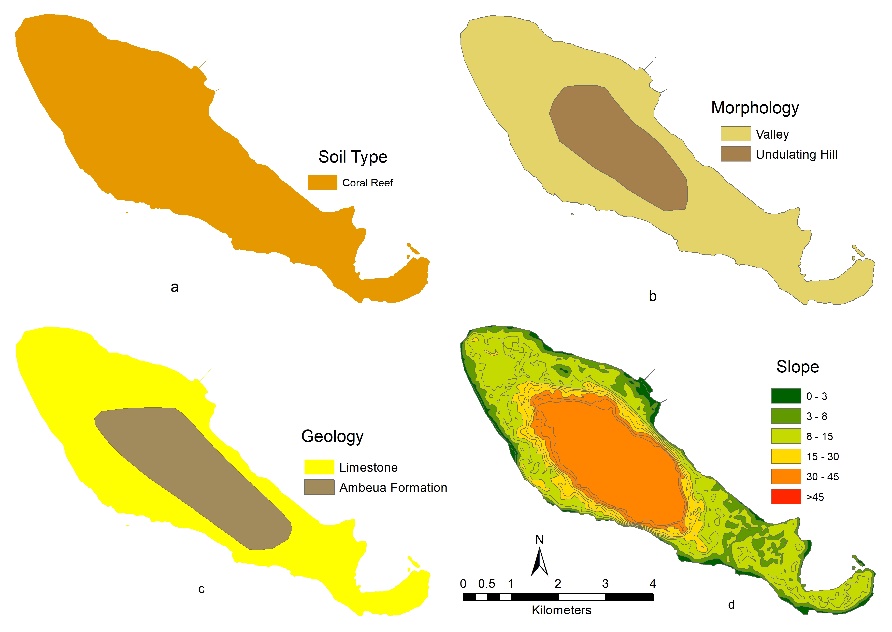
The biophysical environmental conditions of Kapota Island consist of predominantly coral rock soil types. The rock formation is composed of limestone and ambeua formation. The island's morphology is characterized by valleys and undulating hills, while the elevation ranges from 0 to >45 meters above sea level. Literature studies indicate that biophysical environmental factors also influence the land surface temperature (LST) values in an area.
The pre-processing stage involved downloading Landsat 5 TM images for the years 1990 and 2009, Landsat 7 images for the year 2001, and Landsat 8 images for the year 2020 from the website https://earthexplorer.usgs.gov/. The next step was image processing, which consisted of band compositing, correction, and determining the area of interest (AOI). The image classification used the supervised classification with the maximum likelihood method. The band composites used for Landsat 5 TM and Landsat 7 ETM were 321, and 432 for Landsat 8. These band composites were used for environment visualization. The supervised classification process was also assisted by comparing the composited band with the visualization on Google Earth and available in-situ information. Google Earth provided very high-resolution imagery and served as the best reference information for the classification process for each satellite image time series. The land use was divided into five categories: vegetation (secondary forests, gardens, and mixed gardens with shrubs), settlements, water bodies (lakes), open land, and beaches. The image processing (band compositing, radiometric correction, and geometric correction) and area of interest (AOI) selection were performed using ENVI 5.2 software, followed by the classification process and time series map layout by using ArcGIS 10.6 software.

The analysis of Land Surface Temperature (LST) was conducted using thermal Band 6 (10.40-12.50 µm) with a resolution of 120 m for Landsat 5 TM, while for Landsat 8 OLI, Band 10 TIRS-1 (10.60-11.19 µm) with a resolution of 100 m. Meteorological variables that influence the land temperature conditions in Kapota island were obtained from the Meteorological station Class III Betoambari for the years 2010 and 2020 (data for 1990 and 2000 were not available). Based on the image acquisition data for December 2010, the recorded rainfall was 288.2 mm, with 19 rainy days, an average temperature of 28.45°C, and humidity of 86%. In August 2020, no rainfall was recorded, with 2 rainy days, an average temperature of 27.3°C, and humidity of 68%. The meteorological station Class III Betoambari in Baubau is located approximately 99.9 km away from the study site.
LST analysis was calculated using the following equation:
Convert DN to Radiance (Tran, Pla et al., 2017)
Where
Convert Radiance to BT (Tran, Pla et al., 2017)
Where T_B is At-satellite brightness temperature (K), L_λ is top of atmosphere (TOA) spectral radiance (Watts/(m2 Srad µm)), K_1 is Band specific thermal conversion constant from the metadata (K1_CONSTANT_BAND_x, where x is the thermal band number), K_2 is Band specific thermal conversion constant from the metadata, (K2_CONSTANT_BAND_x, where x is the thermal band number).
Convert Kelvin to Celsius degree (Kafy, Al Rakib et al., 2021)
LST conversion for Landsat 8 with the following equation:
Where, λ is wave length of emitted radiance, ρ = h x c/δ = 1.438 x 10²mK; h= (6.626 x 10⁻³⁴ Js); c (light speed) = (2.998 x 10⁸ ms-1); δ= 1,380649 x 10⁻²³ JK-1 and ε (surface emissivity) = 0.004 pv + 0.986, dengan PV = (NDVI-NDVImin /NDVImax – NDVImin).
NDVI and NDWI analysisTo measure NDVI and NDWI multispectral and multitemporal satellite imageries from 1990, 2001, 2009, and 2020 were used. NVDI was calculated with the following equation (Pal and Ziaul, 2017; Townshend and Justice, 1986):
Where: NIR band is the Near Infra Red Band (Band 4 for Landsat 5 TM and Band 5 for Landsat 8 OLI), and Red Band is Band 3 for Landsat 5 TM and Band 4 for Landsat 8 OLI. The NIR spectrum has a high reflectance value for vegetation, while the Red spectrum has the ability to differentiate leaf pigments in vegetation structures based on absorption capacity. The NDVI values range from -1 to 1 to depict vegetation cover, where values closer to 1 indicate higher vegetation density. Vegetated surfaces tend to have positive values (closer to 1), open fields tend to approach 0, and water bodies tend to have negative values (McFeeters, 1996).
To measure the NDWI index, the following equation was used (McFeeters, 1996; Pal and Ziaul, 2017):
Where the Green Band is Band 2 for Landsat 5 TM and Band 3 for Landsat 8 OLI, and the NIR Band is Band 4 for Landsat 5 TM and Band 5 for Landsat 8 OLI. The NDWI values range from 0 to 1. Water bodies or aquatic land cover types tend to have positive values, while terrestrial vegetation typically has values close to 0 or negative (McFeeters, 1996).
Landscape ecological Metric CalculationThe landscape ecological index describes the landscape pattern and land use types in a particular area (Shi, Jiang et al., 2023). The observed landscape indices in this study included indicators such as area, fragment area, fragment shape, and landscape biodiversity. The mathematical equations for each indicator are presented in Table 2. The values of the Ecological Index were obtained through analysis using Fragstats v4.2.
Table 2. Mathematical equations for calculating Landscape Indices (Hesselbarth, Sciaini et al., 2023; Shi, Jiang et al., 2023).
| Landscape Indices | Equation | Range | Description | |
|---|---|---|---|---|
| Class Area (CA) |
|
CA > 0 | Describing the patch structure (the smallest homogeneous polygon in an area) | |
| Number of Patches (NP) |
|
NP > = 1 | Describing fragmentation in a landscape, but not always providing information about the configuration or composition of a landscape | |
| Patch Density (PD) (#100ha) |
|
0 < PD ≤ 1 x 10⁶ | The larger the number of fragments per unit area, the finer the segmentation of the fragments. | |
| Landscape Shape Index (LSI) |
|
LSI > = 1 | Describing the characteristics of fragment shape in a landscape. The larger the value, the more isolated the fragment becomes | |
| Largest Patch Index (LPI) (%) |
|
0 < LPI < = 100 | Depicting the percentage of landscape coverage by the largest patch in the landscape | |
| Shannon’s Diversity Index (SHDI) |
|
SHDI > = 0 | The greater the value, the greater the number of fragment types and and their distribution on the landscape | |
| Simpson’s Diversity Index (SIDI) |
|
0 < = SIDI < 1 | The probability of two randomly selected cells being in the same class. | |
| Shannon’s Evenness Index (SHEI) |
|
0 < = SHEI < 1 | Describing dominance size | |
| Simpson’s Evenness Index (SIEI) |
|
0 < SIEI < = 1 | Depicting the ratio between the actual Simpson Diversity Index and the maximum theoretical Simpson Diversity Index | |
|
Interspersion and Juxtaposition Index (IJI) (%) |
|
0 < IJI < = 100 | The IJI closer to 0 when there are only two adjacent classes, and IJI = 100 when all classes are adjacent to each other. This condition requires a minimum of three classes. | |
|
Contagion Index CONTAG (%) |
|
0< CONTAG < = 100 | Measuring fragmentation and aggregation based on proximity/contiguity across the entire landscape |
Land use and land cover (LULC) on Kapota Island were classified into five categories: vegetation, open land, bodies of water, settlements, and beaches. These LULC types collectively formed the total land area of Kapota, which was approximately 1806.75 hectares. The analysis results indicated that vegetation has been the dominant land cover on the island from 1990 to 2020, followed by open land, beaches, settlements, and bodies of water (Table 3). In 2001, vegetation had the smallest area compared to other years, covering 960.57 hectares. Conversely, open land had the largest area in that year, reaching 707.94 hectares. However, the distribution of open land decreased in 2009 and 2020.
Settlement areas have consistently expanded from 14.22 hectares in 1990 to 43.92 hectares in 2020. This was influenced by the increasing population of Kapota Island. The beach area experienced fluctuations, influenced by tidal conditions and sea waves. Tidal fluctuations, sea reflections, and the influence of spatial resolution might influence the analysis outcomes of the beach category. The beaches are one of the island's attractions that can be developed as a tourism destination on Kapota Island if managed and preserved sustainably. Open land decreased from 576.81 hectares in 1990 to 428.49 hectares in 2020. The dominant limestone and coral soil types in Kapota (as shown in Figure 3) along with low rainfall greatly affected plant growth on the island. As a result, it could be challenging to restore vegetation on the open land until the peak rainy season arrives.
| Landuse | Year (hectares) | |||
|---|---|---|---|---|
| 1990 | 2001 | 2009 | 2020 | |
| Vegetation | 1111.59 | 960.57 | 1283.49 | 1227.60 |
| Beach | 98.10 | 105.75 | 65.16 | 101.79 |
| Openland | 576.81 | 707.94 | 426.87 | 428.58 |
| Waterbody | 6.03 | 7.92 | 4.23 | 4.77 |
| settlements | 14.22 | 24.57 | 27.00 | 44.01 |
| Total | 1806.75 | 1806.75 | 1806.75 | 1806.75 |
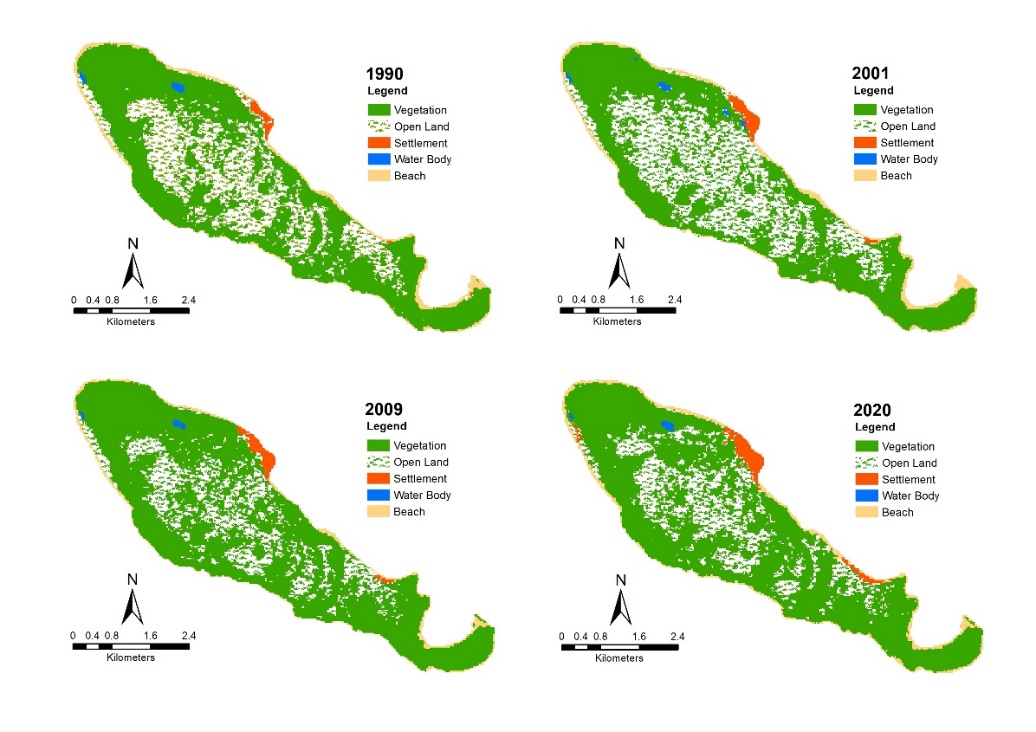
In 2020 as can be seen in Figure 5, settlements have also spread to the southern part of Kapota Island. The conversion of land, influenced by the availability and demand for areas designated for settlements and agriculture, is a crucial factor. This expansion can be attributed to the designation of Wakatobi as a National Park in 1996 and the subsequent establishment of the administrative region in 2003. These developments have encouraged the growth of the area to support administrative activities and boost the local economy. Noteworthy events in this context include the designation of approximately 1.39 million hectares as a conservation area in 1996. Subsequently, in 2003, this area was officially established as a definitive regency. In 2016, Kapota Island was designated as one of the 10 National Strategic Tourism Areas, emphasizing its importance for tourism. However, in 2021, there was a reduction in the size of the National Park area, reflecting a shift in priorities to support development initiatives.
Literature studies indicated that the people of Kapota are traders and tend to migrate to more developed areas. However, after being designated as a National Park and an administrative region, the population has continued to increase, leading to an increased demand for land for settlements and agricultural activities. The rising need for agricultural land is driven by the necessity to meet food requirements. Considering that Wakatobi Regency consists of small islands and staple foods like rice are supplied from the mainland of Pulau Buton, it is essential to be self-sufficient in food production, particularly during extreme weather conditions, such as high waves and strong winds during the peak of the sea waves season.
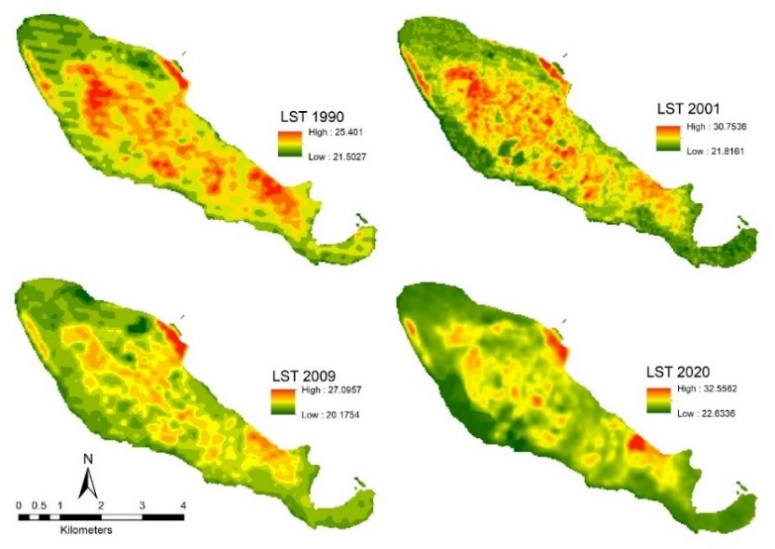
Land surface temperature (LST) for Kapota IslandIn this study, LST analysis was focused on the dry season, specifically from June to August, to understand the temperature patterns during the peak of the dry season. The recorded Landsat images in Kapota showed cloud cover exceeding 15% throughout the year, making the availability of images with less than 15% cloud cover limited. The distribution of LST obtained from the multi-temporal Landsat dataset can be seen in Figure 6. In 1990, the LST ranged from 21.50°C to 25.4°C, lower compared to 2020 which ranged between 22.63°C to 32.56°C. Higher LST values in Kapota were observed in open land and settlement areas. Gupta and Aithal (2022), stated that densely expanding urban structures, lacking vegetation and open space, can notably affect the region's microclimate, raising concerns about heat-related issues for residents. Furthermore, LST is predominantly influenced by factors such as material composition, the rate of urban expansion, and the presence of vegetated and open areas (Gupta and Aithal, 2022). Monitoring the fluctuation of land surface temperature in Kapota through recording the radiative energy emitted by objects on the surface was highly effective and efficient (Arnfield, 2003; Pal and Ziaul, 2017; Voogt and Oke, 2003).
The NDVI analysis was conducted to examine the influence of vegetation index on LST. Figure 7 illustrates the spatial patterns of NDVI obtained from the multi-temporal satellite images. The NDVI values of Kapota Island in 1990 ranged from -0.764 to 0.754, while in 2020 they ranged from -0.241 to 0.514, indicating a continuous decrease in vegetation density. The NDVI can be used to observe the level of vegetation density, plant age, and plant health within the vegetation structure based on the pixel values of near-infrared and red wavelengths. The vegetation index depicted the level of greenness in plants, with pixel values ranging from -1 to 1. A pixel value closer to 1 signified high vegetation density, while a value of -1 indicated low vegetation density. The greenness of plant leaves is influenced by the chlorophyll content. Vegetation has the characteristic of reflecting higher amounts of green light compared to red and blue light in the visible spectrum, and it exhibits the highest reflectance in the NIR spectrum. The interaction between vegetation and the wavelength spectrum is also influenced by the mesophyll tissue structure (parenchyma tissue) of leaves, which contains a high concentration of chloroplasts and plays a role in leaf development. This tissue consists of palisade tissue and spongy tissue, which are sites for photosynthesis processes (Hidayat, 1995). Chloroplasts are cell organelles that contain pigments such as chlorophyll, β-carotene, phycocyanin, and phycoerythrin, which are most abundant in the palisade tissue. The morphological and anatomical structures of leaves, such as color, hairiness level, leaf hairs (trichomes), leaf thickness, leaf surface, and leaf tissue, affect the absorption and reflection of the wavelength spectrum. Leaves with smooth and thick surfaces exhibit higher reflectance of NIR wavelengths due to the presence of a wax layer. This layer can enhance wave reflection by up to 5-20%.

The analysis of NDVI and NDWI (Normalized Difference Water Index) was used to measure the influence of vegetation cover and bodies of water on LST values. LULC and NDVI exhibit a negative correlation with LST. The larger and denser the green cover in a land use area, the higher the NDVI value and the lower the LST value. On the other hand, NDWI has a positive correlation with the NDVI value. Figure 8 illustrates the distribution of the highest LST values based on LULC in 2001 in the settlement areas, while in 2020, it was observed in open land areas.
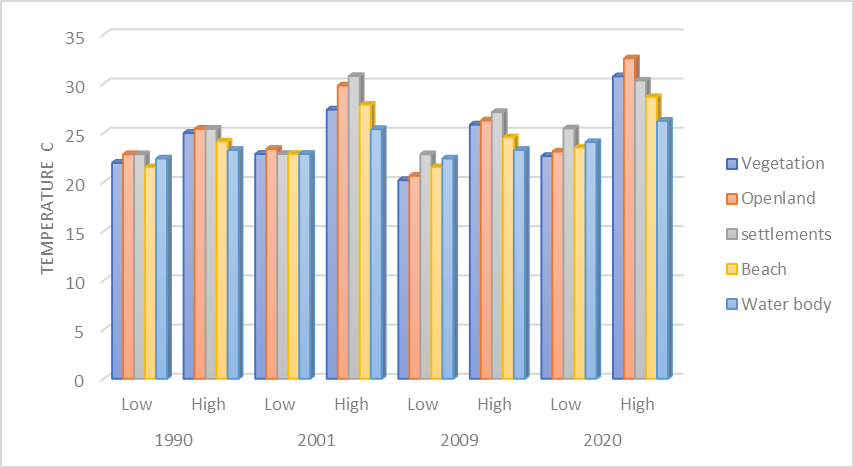
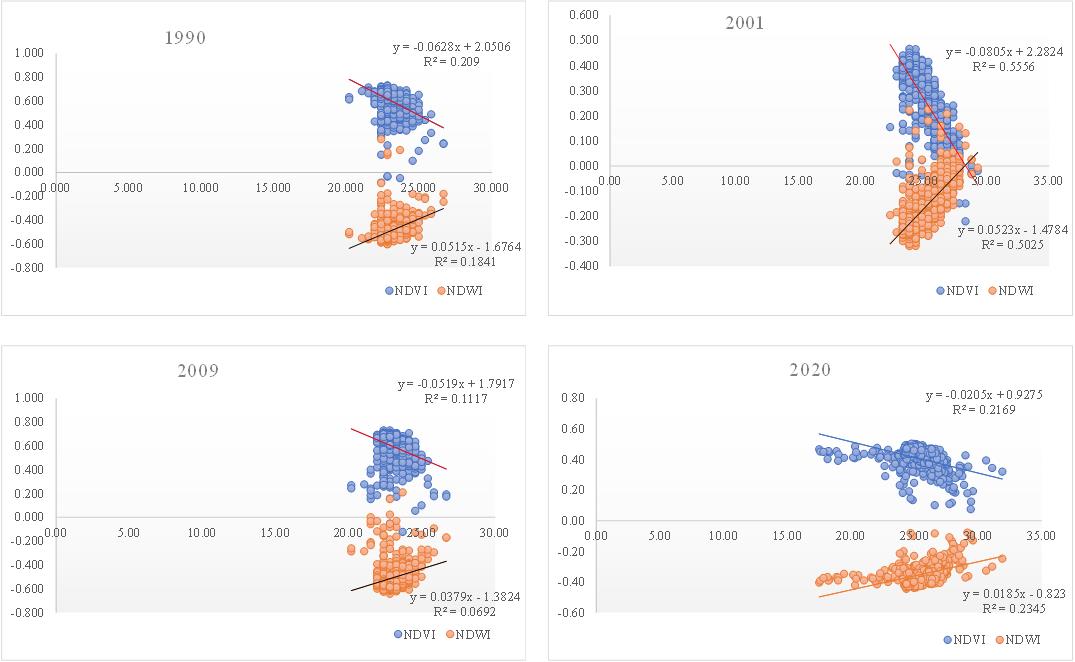
The correlation between NDVI and LST for the periods of 1990, 2001, 2009, and 2020 indicated that the distribution of LST values tended to be higher in built-up areas (settlements) and open areas, and lower in water bodies and dense vegetation cover (Figure 9). LST in vegetation-covered areas can be lower because the temperature is regulated by the vegetation through processes such as transpiration, which helps maintain a cooler temperature due to higher oxygen production. The analysis of land cover, vegetation index, and their relationship with land surface temperature is crucial for environmental monitoring, weather conditions, and climate assessment (Alam, Alam et al., 2022).
The LST and NDVI indices were influenced by climatic conditions, so it is important to observe the climate during the acquisition of satellite image data for the study (Table 4). For the period of 1990-2020, June showed the highest average air temperature ranging from 27.17°C to 27.88°C, humidity 76.69% to 81.06%, high rainfall 2.35 mm/day to 10.52 mm/day, surface soil wetness from 0.8 to 0.93, and profile soil moisture from 0.75 to 0.92. As a result, the LST during the June acquisition period ranged from 20.17°C to 27.09°C, while the NDVI ranged from -0.771 to 0.738. The climatic conditions in June had higher air temperature, however, air and soil humidity was higher, resulting in lower LST compared to the acquisition period in July and August. In August, the average air temperature ranged from 27.1°C to 28.08°C, humidity ranged from 76.19% to 78.44%, precipitation ranged from 0.12 mm/day to 1.11 mm/day, surface soil wetness ranged from 0.55 to 0.68, and 0.56 to 0.66. The LST ranged from 21.8161 to 30.75 in 2001 and from 22.63 to 32.56 in 2020, while the NDVI ranged from -0.545 to 0.507 in 2001 and from -0.241 to 0.514 in 2020. Surface soil wetness and profile soil moisture also influence the LST index. The data shows that August has drier climatic conditions compared to other months.
| Month | Year | Temperature (oC) | Humidity (%) | Precipitation (mm/day) | Surface Soil Wetness (1) | Profile Soil Moisture (1) | ||
|---|---|---|---|---|---|---|---|---|
| Max | Min | Average | ||||||
| June | 1990 | 28.79 | 25.98 | 27.39 | 78.38 | 2.35 | 0.8 | 0.75 |
| 2001 | 28.34 | 26.00 | 27.17 | 81.06 | 10.52 | 0.93 | 0.92 | |
| 2009 | 29.1 | 26.26 | 27.68 | 76.69 | 2.37 | 0.80 | 0.76 | |
| 2020 | 29.05 | 26.71 | 27.88 | 79.62 | 4.51 | 0.88 | 0.84 | |
| July | 1990 | 27.72 | 25.55 | 26.64 | 79.94 | 2.22 | 0.7 | 0.66 |
| 2001 | 27.66 | 24.99 | 26.33 | 77.19 | 1.48 | 0.85 | 0.83 | |
| 2009 | 28.03 | 25.73 | 26.88 | 76.69 | 2.01 | 0.68 | 0.66 | |
| 2020 | 27.69 | 26.26 | 26.98 | 79.5 | 2.76 | 0.83 | 0.8 | |
| August | 1990 | 28.08 | 25.06 | 26.57 | 76.62 | 0.98 | 0.59 | 0.59 |
| 2001 | 27.1 | 24.95 | 26.03 | 76.19 | 0.43 | 0.68 | 0.66 | |
| 2009 | 27.68 | 25.44 | 26.56 | 77.31 | 0.12 | 0.55 | 0.56 | |
| 2020 | 27.92 | 25.51 | 26.715 | 78.44 | 1.11 | 0.68 | 0.66 | |
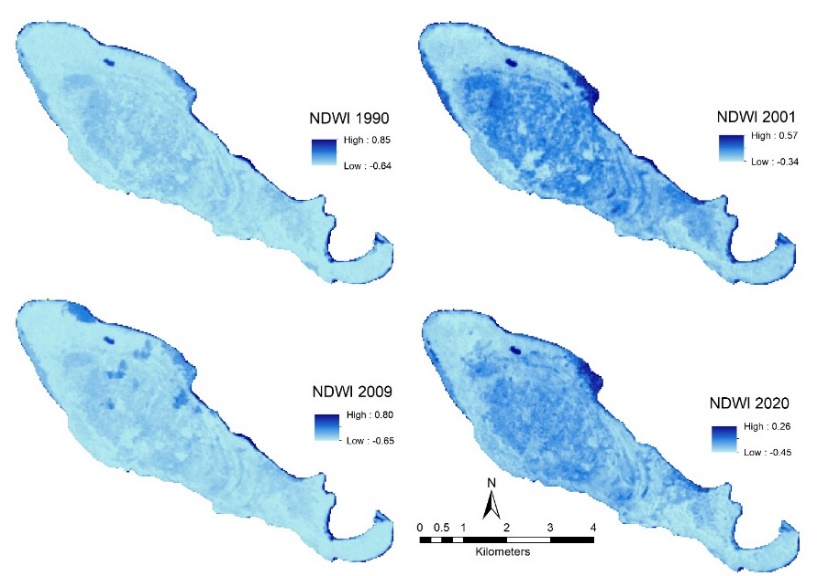
Based on the existing conditions on Kapota Island, there are no permanent surface rivers, only lakes. The community relies on groundwater from wells for clean water supply. Figure 10 shows the highest NDWI values in the water bodies (lakes) and beach areas. The NDWI values for 2001 and 2020 were lower compared to 1990 and 2009. The NDWI in 2001 ranged from -0.34 to 0.57, while in 2020 it ranged from -0.45 to 0.26. This indicates that 2020 was drier compared to 2001, 2009, and 1990. Besides rainfall, fluctuations in inundation in coastal areas were influenced by tidal cycles. Remote sensing is a technology that can be used for monitoring water availability and managing aquatic environments in the future (Campos, Sillero et al., 2012). Specifically, for coastal areas, monitoring inundation areas can serve as a reference for assessing sea-level rise by considering the highest and lowest tide conditions during observations and the impact of waves on coastal erosion.
Landscape ecology in Kapota IslandLandscape ecology is a quantitative approach to analyze the level of biodiversity in a landscape structure (land cover) based on land use expressed through a landscape index (Prasetyo, 2017). The analysis of landscape structure and patterns aimed to enhance information on ecosystem dynamics occurred in Kapota Island which is within the Wakatobi National Park during the years 1990, 2001, 2009, and 2020. The analysis was conducted at the landscape metric level, which included Class Area (CA), Number of Patches (NP), Patch Density (PD), Landscape Shape Index (LSI), Largest Patch Index (LPI), Shannon's Diversity Index (SHDI), Simpson's Diversity Index (SIDI), Shannon's Evenness Index (SHEI), Simpson's Evenness Index (SIEI), Interspersion and Juxtaposition Index (IJI), and Contagion Index (CONTAG) (Table 5).
| Indicator | Landscape metrics | 1990 | 2001 | 2009 | 2020 |
|---|---|---|---|---|---|
| Area | CA/ TA | 1806.75 | 1806.75 | 1806.75 | 1806.75 |
| Fragment area | NP | 239.00 | 261.00 | 318.00 | 262.00 |
| PD | 13.23 | 14.45 | 17.60 | 14.50 | |
| Landscape shape | LSI | 11.63 | 11.69 | 11.90 | 11.80 |
| LPI | 57.41 | 32.39 | 70.22 | 65.85 | |
| Landscape biodiversity | SHDI | 0.88 | 0.95 | 0.78 | 0.87 |
| SIDI | 0.52 | 0.56 | 0.44 | 0.48 | |
| SHEI | 0.55 | 0.59 | 0.49 | 0.54 | |
| SIEI | 0.65 | 0.70 | 0.55 | 0.60 | |
| Landscape fragment | CONTAG | 58.55 | 55.93 | 61.85 | 58.72 |
| IJI | 31.60 | 34.31 | 29.74 | 35.89 |
Table 5 shows an increase in PD and LSI values from 1990 to 2009, followed by a decline in 2020. The increase in PD and LSI values indicates a dispersed landscape pattern, while the LPI metric fluctuated and reached its lowest point in 2001. An increase in LPI signified a more clustered pattern. A landscape with higher PD values and smaller patch sizes will have a higher fragmentation index. This condition indicates a higher level of isolation and thus an increased risk of biodiversity loss. The SHDI index closer to 1 indicates a higher number of fragment types and their distribution. The landscape ecology approach can be used to address problems caused by changes in landscape patterns and structures in an ecosystem by measuring landscape heterogeneity. It also plays an important role in ecosystem management and spatial planning (Li, Zhao et al., 2023; Wang, Zhao et al., 2019; Zhao, Wen et al., 2020).
Impact of land use land change and land surface temperatureLand use changes on Kapota Island were influenced by anthropogenic activities and natural factors. Anthropogenic activities include land conversion for settlements and agriculture activities. Natural factors were influenced by extreme climatic conditions such as low rainfall, as well as the island’s biophysical conditions characterized by a geological structure dominated by limestone and weathered coral rock soil types. As indicated in Table 6, there have been changes in the land use area from 1990 to 2022. The development of settlement areas includes houses, roads, public facilities, and tourist support facilities. The vegetation categories in this study include cultivated land, mixed gardens and shrubs, and shrubland. The cultivated land in this area is predominantly coconut, cassava, and banana plantations. Open land in this location refers to open land due to human activities or natural factors. The bodies of water refer to natural lakes found on Kapota Island.
| Beach | Settlements | Open land | Water body | Vegetation | Grand Total | |
|---|---|---|---|---|---|---|
| Beach | 2.79 | 0.003 | 0.09 | 0.50 | 3.39 | |
| Settlements | 0.09 | 0.44 | 0.64 | 0.29 | 1.46 | |
| Open land | 0.05 | 0.01 | 11.33 | 0.01 | 2.89 | 14.28 |
| Waterbody | 0.15 | 0.003 | 0.16 | |||
| Vegetation | 0.33 | 0.02 | 7.17 | 0.042 | 33.35 | 40.92 |
| Grand Total | 3.27 | 0.47 | 19.23 | 0.20 | 37.04 | 60.21 |
The annual climate description of Kapota Island is presented using data from PowerNASA to understand the influence of climate on the distribution of Land Surface Temperature (LST) from 1990 to 2020. Figure 11 shows the fluctuation of average temperature during this period, increasing from 27.65°C in 1990 to 29.30°C in 2020. The humidity ranged from 81.5% to 77.75%, with the highest precipitation occurring in 2010 at 6.98 mm/day. Solar radiation exhibited fluctuations, with a maximum of 35.78 MJ/m2/day and a minimum of 35.74 MJ/m2/day. Notably, these climate trends align with the observed increase in LST through remote sensing analysis. However, potential limitations between the presented climate data and remote sensing-derived LST could include differences in temporal and spatial resolutions, sensor characteristics, data processing techniques, and the need for validation and calibration to ensure accurate correlation.

The literature review indicates the strengths of studies employing GIS and Remote Sensing technologies, particularly in the context of coastal resource management, encompassing spatial planning (Alwedyan, 2023), and climate change adaptation (Islam, Yeasmin et al., 2023). Utilizing Land Surface Temperature (LST) information enhances spatial planning, contributing to more effective coastal resource management. This is particularly crucial for small islands facing the impacts of climate change, aiding in disaster risk management and adaptation planning (Yang, Luo et al., 2020; Yuliastuti, 2023). The integration of GIS and Remote Sensing technologies not only provides valuable insights into coastal dynamics but also offers practical solutions for sustainable development and climate resilience.
Land use analysis has revealed substantial changes to the landscape over the study period, impacting incoming and outgoing solar radiation and causing a notable increase in LST. Based on the multitemporal satellite imagery analysis conducted in 1990, 2001, 2009, and 2020, the land use categories identified in Kapota Island were vegetation, open land, water bodies, settlements, and beaches. The findings revealed a consistent increase in the area of settlements from 14.22 hectares in 1990 to 43.92 hectares in 2020. Open land areas decreased from 707.94 hectares in 2001 to 428.49 hectares in 2020. The extent of the beaches fluctuated due to tidal conditions, and the presence of white sandy beaches remains a key tourist attraction on Kapota Island that should be preserved. The Land Surface Temperature (LST) experienced a continuous increase from 21.50°C to 25.4°C in 1990 to 22.63°C to 32.56°C in 2020, with the highest LST values observed in open land and settlement areas. Surface soil wetness and profile soil moisture also influenced the LST on Kapota Island. The structure and pattern of the Kapota Island landscape, as indicated by the Simpson's Diversity Index (SHDI), ranged from 0.78 to 0.95, indicating a highly fragmented landscape with a widespread distribution.
Regulations in Indonesia mandate that the minimum green cover on small islands should be 30% of the island's total area. In the case of Kapota Island, the quantity of green cover meets the requirement, but based on NDVI analysis, it has a sparse vegetation index. Visual observations from satellite images and Google Earth show that the dominant land use and green cover on the island consist of shrubs and mixed dryland agriculture. Therefore, to enhance environmental sustainability, there is a need to improve the quality of green cover through vegetation planting that can enhance ecological functions such as water retention, heat absorption, and economic benefits.
Due to spatial resolution limitations, vegetation classification on Kapota Island is presently limited to a general classification, lacking in more specific differentiation (e.g., agricultural land, forests, and shrublands). It is recommended to refine these classifications to enhance the informativeness of Kapota Island's land use data by using higher spatial resolution imagery data in the future. Such refinement is crucial for a comprehensive understanding of the distinct impacts exerted by various land use types on Land Surface Temperature (LST) values across Kapota Island. Further investigation can focus on assessing the specific drivers behind the consistent increase in settlement areas and the decrease in open land, considering both natural and anthropogenic factors. Understanding the nuanced dynamics of beach areas influenced by tidal conditions could be explored in more detail, emphasizing the preservation of white sandy beaches as a crucial aspect of tourism attraction. Additionally, there is a need for research on the potential implications of the observed LST increases, especially in open land and settlement areas, for local ecosystems and community well-being. Investigating the influence of surface soil wetness and profile soil moisture on LST can provide valuable insights into the complex interplay of environmental factors.
S designed the research and wrote the initial draft of the manuscript; NH, HR, ASL designed the research, SB revised the manuscript. All authors contributed to the article and approved the submitted version.
The authors declare that they have no conflicts of interest regarding the publication of the paper.
This research was supported by the Geospatial Information and Land Use Planning Laboratory, Department of Soil Science, Faculty of Agriculture, Hasanuddin University, Makassar. We greatly appreciate the comments of anonymous reviewers for their valuable suggestions for improving the manuscript.