Planning Analysis and Simulation
Impact of Urbanization on the Vegetation Dynamic in Tama River Basin

2024 Volume 12 Issue 2 Pages 119-137
Details
2024 Volume 12 Issue 2 Pages 119-137
Vegetation dynamic in river basins is significantly considered in environmental studies. However, the relationship between urbanization, vegetation change, and its driving factors are still lacking a connection in the previous study. Therefore, this study aimed to examine the impact of urban development on vegetation dynamics in the Tama River from 1990 to 2021 to enable future planning. In this study, vegetation dynamics were quantified with the Normal Difference Vegetation Index (NDVI) to provide information on the vegetation quality in the area. The regional climate and surface land uses were analyzed to determine the intensity of urban development. Regional Climate in spatial analysis can be computed with Land Surface Temperature (LST), whereas the surface conditions can be computed using Land Use Classification. The results showed that from 1990 to 2021, the NDVI trend continued to increase, whereas LST decreased. Furthermore, a positive and negative correlation was found between LST and NDVI in the Tama River Basin. This shows that changes in LST and NDVI are also influenced by other factors, such as seasonal change and socioeconomic factors. The overall vegetation trend shows an increasing trend in all seasons. This study's findings prove that the Tama River environmental management plan is a good example of a functional river rehabilitation plan. Thus, it is important to understand the spatial and temporal development of vegetation coverage and anticipate future patterns while comprehending climate shifts. This study will also provide recommendation recommendations for effective urban planning alongside rivers.
There has been an increasing concern over urban development, which has led to the focus of academic research to shift to the relationship between the development area and the terrestrial ecosystem. In any urban area, urbanization is necessary for a country’s development, especially economic development. However, development also negatively affects natural resources and surface temperatures (Mohammad and Goswami, 2022). Furthermore, urban development in the river basin area leads to land use changes and affects water resources, which eventfully leads to climate change (Praskievicz and Chang, 2011). As cities continue to expand into rural areas and encroach into vital natural habitats such as river basins, it is imperative that we carefully consider the growth’s long-term consequences to the human population and ecosystems.
Acknowledging these impacts of urbanization, the Tama River basin emerges as a focal point of this relationship between urbanization and environmental shifts, particularly in vegetation dynamics. The basin embodies the places where the effects of urban sprawl are most apparent due to its distinctive biodiversity and vital role in maintaining the natural balance of the region. Historical data indicates a remarkable evolution of the basin's landscape, marked by decreasing green spaces and altered land surface properties, highlighting an urgent need for a deeper, data-driven investigation into these trends. The urgency is not merely academic; the insights gained are crucial for policymakers and stakeholders involved in urban planning and environmental conservation, underlining the need for balanced strategies that accommodate both human progress and ecological preservation.
This research aims to bridge the understanding of how relentless urbanization impacts vegetation dynamics within this vital basin. This study was conducted to assess changes in vegetation dynamics and land surface temperature in the Tama River basin between 1990 and 2021, representing the past and current situation of the basin. This study employed satellite image data of NDVI, land use, and LST from Landsat 5 and Landsat 8 to achieve this objective. We focused on exploring the relationships between urbanization, which showed in the land use change and temperature patterns as possible drivers of vegetation dynamics observed in the Tama River basin. We conclude by discussing our results' detailed interpretations and implications for Tama River basin planning and management.
The Tama River, situated in Japan’s metropolitan region, holds the distinction of being a significant first-class river and playing a crucial role in the basin’s ecological and environmental dynamic. Over time, the population of the basin has increased, and about 3.3 million in the middle and lower plains, which occupies about one-third of the area of the basin, and most of them are concentrated in the metropolitan area, especially in Tokyo area.
Hashiba, Kameda et al. (2000) expressed that the urbanization and substantial land cover phenomenon in the Tokyo area has caused widespread ecological disruptions that have affected not only plant life but also animal species and ecosystem services, such as water quality regulation, soil stability, and carbon storage capacity reduction, which could be detrimental worldwide to biodiversity conservation efforts if left unchecked and unmitigated for extended periods. Studies also have shown that the ecosystem of the Tama River Basin has considerably been impacted since 1990 (Sato-Takabe, Hirose et al., 2020). Examining the vegetation within the Tama River basin holds significant importance due to its strategic location and pressing ecological issues. Presently, the research in this area primarily centres on investigating temperature change, stormwater management, and ecological studies (Sato-Takabe, Hirose et al., 2020; Yamashita, Sekine et al., 1986). While research on the vegetation change and its future trend is relatively scarce, the impact of urbanization on vegetation dynamics in the Tama River basin is still rarely observed.
Some researchers have investigated the influence of urban expansion on vegetation dynamics through various methodological approaches. For instance, Nse, Okolie et al. (2020) employed a comprehensive framework encompassing NDVI and LST and involved quantitative analyses, such as Pearson correlation, to seek the relationships between these parameters. In different research, Zhang, D., Sun et al. (2022) explored multivariate linear regression analysis and allowed them to quantify the contributions of various variables, including NDVI, within their study.
The research on urbanization, vegetation change, and their relationship has a particular research foundation. However, there are still many gaps in the research on the interaction process and the critical links between the aspects, particularly in the river basin area. Therefore, observing changes in river basins over time is vital to understanding the spatial and temporal development of vegetation coverage and anticipating future patterns while comprehending climate shifts.
Studies on the relationship between urbanization, climate and vegetation dynamicUrbanization refers to the phenomenon wherein rural populations and non-agricultural production elements become increasingly centred in urban settings, leading to the conversion of rural regions into urban zones Chopra, Singh et al. (2022); Mberego and Li (2017). This encompasses population migration, ensuing shifts in social composition, industrial transformations, as well as the progressive alteration of the urban landscape Liu, Dong et al. (2021). The study of vegetation dynamics is essential when understanding the impact of human activities on the environment since the river basin area has an essential position with the incredible natural spaces and their valuable existence from an environmental point of view. The Normalized Difference Vegetation Index (NDVI) is a valuable tool researchers use to assess changes in vegetation cover over time (Islam, Yeasmin et al., 2023). This remote-sensing technique utilizes satellite images to quantify live green plant material within a specific region and can reveal patterns that indicate alterations in the ecosystem’s health.
Several studies have examined vegetation dynamics and their driving factors in river basins. Chen, Liu et al. (2021) explored the NDVI using MODIS and GIMMS data in the Wulagai River Basin, China, while Zhang, Z., Liang et al. (2023) analyzed the vegetation dynamic in response to a climate change in Hanjiang River Basin, China. Moreover, studies have indicated that temperature variations, land use changes, and the implementation of soil and water conservation measures have significantly influenced vegetation dynamics (Jia and Tamai, 1998). Research has also confirmed that vegetation plays a critical role in reducing the heat island effects in urban areas (Yamashita, Sekine et al., 1986).
In addition to assessing NDVI values, temperature patterns are crucial for evaluating land use change impacts and modifications to the surrounding flora and fauna populations. Evaluating the regional climate for land cover is also used to understand the basin's ecosystem process and sustainable development proposes. Researchers rely heavily on such indicators as they provide insight into how different facets of nature interact with each other as a result of urbanization's constant impact on the environment. The analysis of land surface temperatures using satellite images is crucial for assessing the impact of urbanization on temperature patterns. For researchers, this kind of study findings can be used to ensure urban development and minimize urban heat islands or understand surface temperature prediction for policymakers (Ullah, Ahmad et al., 2023).
In a previous study, Cheng, Zhang et al. (2022) proved that changes in climate patterns have an adverse influence on vegetation dynamics within the Yellow River basin, whereas human activities, such as afforestation and animal husbandry control, exert a positive impact. However, research conducted by Liu, Dong et al. (2021) demonstrated that in the Manas River basin, characterized by relatively limited social and economic advancement, the progression of urbanization yielded detrimental impacts on the natural ecosystem. Furthermore, a strong correlation was found between the decline of vegetation cover and the rise of surface temperature which have a significant impact on local, regional, and global warming effects (Jiang, Niu et al., 2022; Wang, Ju et al., 2022). Other factors also prove to have an impact on the relationship between urbanization and vegetation dynamic, such as precipitation (Cheng, Zhang et al., 2022) and anthropogenic factors (Wang, Ju et al., 2022).
It can be seen that the relationship between urbanization, climate, and vegetation change is very complex, and the social, economic, and ecological effects caused by urbanization vary according to the city’s context and developmental stage. Thus, the consequences of urbanization lack universality, and it is misguided to extend findings to other cities. It is important to analyze the relationship among urbanization, climate, and vegetation within a specific research area to establish a scientific foundation for urban planning and effective ecosystem management strategies.
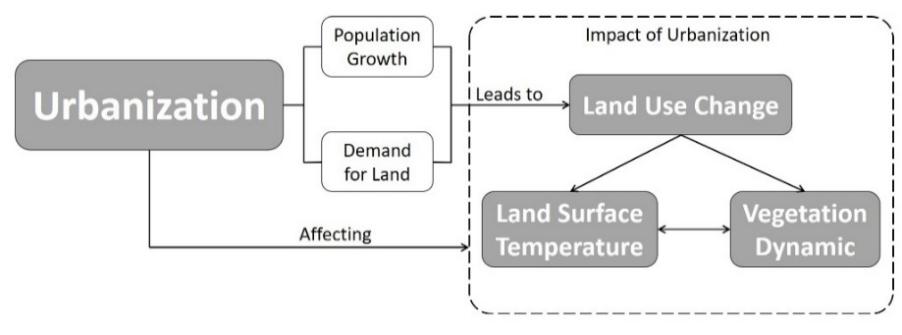
Conceptual frameworkThe relationship between urbanization, climate change, and vegetation dynamics in river basins, exemplified by regions such as the Tama River, is becoming an important area of study. In Japan where urbanization starts in early 90’s leading to various environmental changes; it begins with population growth and an intensified demand for land, leading to significant land-use changes in this current timeline. Natural landscapes yield to concrete expanses, diminishing the region's green spaces, and escalating the urban heat island effect. This not only disrupts local climate conditions but also contributes to global climate change, further influencing regional weather patterns by altering temperature and precipitation regimes.
Environmental challenges present opportunities for mitigation and adaptation through conservation and sustainable land management policies. Strategies like afforestation, biodiversity conservation, and sustainable urban planning can stabilize local climate conditions and promote vegetation growth. An integrated strategy in city and environmental design is crucial, as urban growth, changing weather patterns, and plant life are interconnected. Decision-making should prioritize lasting sustainability over immediate profit. By adopting comprehensive plans, we can balance city expansion with nature conservation, ensuring the well-being and good condition of river ecosystems for future generations.
In tandem with direct anthropogenic activities, these climatic alterations significantly affect vegetation dynamics within river basins. Advanced tools like the Normalized Difference Vegetation Index (NDVI) have enabled researchers to track these changes, revealing declines in vegetation cover. Moreover, other satellite images can be utilized for discerning the correlations between urban expansion, which is manifested in alterations in land usage and climatic shifts as probable factors influencing the observed changes in vegetation within the river basin.
The Tama River is located in Kanagawa, a small part of the Yamanashi Prefecture and Tokyo Prefecture (Figure 2), representing a metropolitan area in Japan. Flowing from the Okutama River and ending up downstream between the Tokyo and Kanagawa prefectures, the Tama River is a valuable natural resource for this urban center. The Tama River Basin is primarily used for agriculture and is an obvious source of water supply in the surrounding area. However, since 1965, the midstream and downstream areas in Tokyo and Kanagawa have been urbanized as residential and industrial areas, resulting in the deterioration of water and green space quality.
Fundamentally, in 1980, the Tama River Restoration Plan was enacted and is internationally recognized as the first river environment management and protection plan to be enacted in Japan. More than four decades have passed since the restoration was enacted, and there has been continuous development of metropolitan areas. Therefore, it is important to understand the current conditions of the Tama River for future planning, as this river is essential. In this study, ArcGIS was used to create a buffer 10 km from the river. Therefore, approximately 40 cities in Tokyo, 15 cities in Kanagawa, and 11 cities in Yamanashi were analyzed to see how the river was protected despite the growing urban area in its surroundings.

We used Landsat 5 TM and Landsat 8 OLI data in this study because the image strips produced from Landsat 7 ETM can potentially disturb analysis. The free-cloud Google Earth engine platform was used to obtain remote data. To represent the past and current conditions of the Tama River Basin, along with image screening, Landsat 5TM from 1990 and Landsat 8OLI from 2021 were used. Landsat images are considered a long record of the Earth’s land surface because they have been operational since 1972 (Miller, Richardson et al., 2013) and have a high-resolution map with pixels of 30 × 30 m. Landsat Collection 1 Level 1 Surface Reflectance was derived from the USGS library and used as a basic map for further analysis. Surface reflectance data are compatible across space and time; hence, the atmospheric correction operation during image pre-processing makes change detection results more reliable (Hemati, Hasanlou et al., 2021). Cloud cover and shadow removal were conducted in an image pre-processing step to obtain a clear image using multitemporal cloud detection and median filtering in Google Earth Engine (GEE). The median method is applied pixel-wise to obtain a cloud-free image in a time series (Mateo-García, Gómez-Chova et al., 2018). In addition, it concentrates the multitemporal image by computing the median of each value in the complementary band, which results in the bands being matched and producing one image. Filtering data is important for image selection in this step; hence, annual data were considered. The study area was freely downloaded from https://nlftp.mlit.go.jp/ksj/ during the latest acquisition year, 2020.
Land cover classificationCover classification in Remote Sensing is used to categorize each spectral class depicted on the Earth’s surface. This classification was conducted using Random Forest in GEE, which is pixel-based and recommended for land cover change within a period. Fundamentally, pixel-based methods are based on classifying remote-sensing pixels by pixel using rules to which pixels can be grouped to have similar characteristics (Avci, Karaman et al., 2011). In addition, spectral data are expressed as digital numbers in the sensor data bands to categorize each pixel (Bengtsson, Beaudry et al., 2021). Compared to other machine learning methods, random forest, as a non-parametric method, can quickly complement high- and complex-dimensional training data. Therefore, it is widely used for remote sensing image classification (Magidi, Nhamo et al., 2021; Yan, Li et al., 2022).
| Land cover classes | Description |
|---|---|
| Built-Up | All pavement-developed areas, such as settlements, industrial areas, and roads. |
| Vegetation | All green areas from a surface, such as forests, shrubs, grassland, cultivated land, and wetland. |
| Waterbody | This encompasses all surface waterbodies visible in the imagery, such as rivers, lakes, and ponds. |
The land cover categories were grouped into three classifications: built-up, vegetation, and water body, as described in Table 1. The training datasets were created based on the generated feature collection. Two hundred training points were randomly selected and spread across the entire study area as representatives of each classification class. In addition, the number of training points for each land cover class was comparable to the total number of pixels. After training the datasets generated by the different machine learning algorithms, the RF was used to classify the images using the GEE script.
The sample points diverged irregularly into training samples (70%) and validation samples (30%) in the classification process. An accuracy assessment was also conducted to understand the level of accuracy of the maps in correctly using the data. Google Earth Engine offers easy script evaluations to determine the accuracy level of each classification map from 1990 to 2021. We conducted confusion matrix including consumer, produce, kappa, and overall accuracy test to obtain the results. The confusion matrix shows the accuracy details ranging from the producer’s to the user’s overall and kappa's accuracy. The user’s accuracy pertains to the errors of the commission and is used to inform the user (consumer) of the authenticity of the classifier where the area classified as a specific land cover type was correct. The producer’s accuracy is regarded by the analyst (producer) as the proportion of the area that is correctly classified in a specific category (Sari, Weston et al., 2021). Overall accuracy shows the total classification accuracy. The kappa accuracy of the model for acceptable performance ranged from 0 to 1. A higher kappa coefficient value shows the arrangement level, which means the 0.8 to 1.0 range value shows perfect and is highly acceptable for land cover classification (Basheer, Wang et al., 2022). Therefore, in this study, the kappa accuracy should reach a minimum of 0.8. Otherwise, the classification must be repeated. The next step was to export the GeoTiff format image classification from the GEE to ArcGIS Pro for further analysis. Iso Cluster Unsupervised Classification was applied to perform unsupervised classification of the input raster bands into three categories: built-up, vegetation, and water bodies.
Normalized difference vegetation index and land surface temperatureWe derived (NDVI) and Land Surface Temperature (LST) images using the GEE platform. To calculate the NDVI value, the reflectance values from the red and near-infrared regions were used. There are several ways to assess the NDVI in the GEE. This study uses an existing technical method from the GEE of the normalized index calculation function ee. Image-normalized difference (). The value of NDVI ranges from -1 to 1, with -1 and 1 referring to non-existing and existing vegetation, respectively (Al Mousawi, 2022). NDVI is a standardized method to measure the vegetation cover change (Islam, Yeasmin et al., 2023). Furthermore, Kaloop, Iqbal et al. (2022) mentioned a threshold value: If the NDVI value is < 0.2, then pixels are acknowledged as barren land. Meanwhile, if NDVI > 0.5, the pixels were valued and considered a land surface covered with plants or agricultural fields.
The LST is defined as the Earth’s surface temperature in a thin layer that interacts with the composition of gases around the surface (I and Kumar, 2021). LST assessment in the GEE was performed by calculating the surface emissivity from the vegetation proportion and continued with the SWM algorithm of LST retrieval (Ermida, Soares et al., 2020) using the evaluation of an arithmetic expression on an image for computation. Originally, the LST values were produced in Kelvin. To get the temperature in Celsius, the LST retrieval calculation was subtracted by 273.15. Detailed information on the NDVI and LST Retrieval is presented in Table 2.
Seasonal variations in NDVI and LST were also analyzed to distinguish the different values of temporal variation throughout the year. The one-dimensional linear regression is used to determine the trend of NDVI using the least squares method. The slope of the equation can reflect the variation trend of vegetation (Sun, Y.-L., Shan et al., 2020; Zhang, D., Sun et al., 2022). A slope > 0 means that the vegetation coverage increases, and a slope < 0 means otherwise; a slope ¼ 0 means no change in vegetation. The intensity of vegetation change increases as the value increases, leading to a more pronounced variation trend. In Japan, four seasons are introduced in this study, where spring starts from March to April and continues to summer from June to August. September to November is autumn, and December to February is winter. With image filtering in GEE, the Landsat map of Autumn and Winter produced an imperfect cloud-masking image, which means that the area was mostly covered with clouds and unsuitable for further analysis. Therefore, we combined the seasonal autumn and winter. Detailed information is presented in Table 2.
| Acquisition date | Formula |
|---|---|
|
Landsat 5: For the years 1999, 2000, and 2010 Annual: 01/01-12/31 Spring: 01/03–31/05 Summer: 01/06–31/09 Autumn-Winter: 01/10/1990–30/12/1990 Landsat 8: Annual: 01/01/2021-12/31/2021 Spring: 01/03/2021–31/05/2021 Summer: 01/06/2021–31/09/2021 Autumn-Winter: 01/10/2021–30/12/2021 |
NDVI = (NIR–R)/ (NIR + R) |
|
Pv = (NDVI - NDVI min / NDVI max - NDVI min)2 e = 0.004*Pv + 0.986 (4) LST= T/1+W*(T/p)*In(e)) (1) Where: T= At satellite temperature, W=Wavelength of emitted radiance (11.5 μm), p = h*C/S, h = Planck’s Constant, s = Boltzmann Constant, C = Velocity of light |
All GeoTIFF images from the GEE were exported to ArcGIS Pro for further analysis. To compare the NDVI and LST values in each city included in the Tama River Basin, the values were divided into three parts using the intersection tool in ArcGIS Pro, with the study area in the shapefile. The class was created based on the arithmetic frequency distribution with three classes (low, medium, and high) using the formula S= (Sx -Sm)/C, where S is the class width, Sx is the maximum value, Sm is the minimum value, and C is the desired class.
To acquire the values and compare land use, NDVI, and LST results, the fishnet tool in ArcGIS Pro, with the distance between rows and columns every 1 km, was used to obtain the label point representing each value throughout the area. All data were further analyzed using Microsoft Excel. We conducted a Pearson correlation analysis to determine the relationship between NDVI and LST in our study area. In a previous study, Pearson correlation analysis was proven to be useful for understanding linear correlations between variables. Nse, Okolie et al. (2020) and Guha and Govil (2020) used the correlation analysis to quantify seasonal variation between LST and NDVI. In Pearson correlation analysis, the value ranges from +1 to -1, where +1 means the perfect positive relationship between variables. Furthermore, we analyzed the NDVI and LST values in each land cover class to see the land cover relationship with NDVI and LST.
The accuracy assessment of the Tama Basin River classification showed great value. As shown in Table 3, the producer’s accuracy of vegetation, water bodies, and built-up areas has a high value. This indicates that the reference points for this category were correctly classified. Meanwhile, vegetation cover in 1990 had low user accuracy compared to other land cover types, indicating that there is a probability that some pixels classified as vegetation cover may not exist on the ground in that year (Manandhar, Odeh et al., 2009). In this study, the overall accuracy in all years was above 80%, and the kappa accuracy was above 80%, showing a strong agreement between the classification map and the existing reference information. This led to an appropriate map for subsequent analyses.
| 1990 | 2000 | 2010 | 2021 | |||||
|---|---|---|---|---|---|---|---|---|
| Producer | User | Producer | User | Producer | User | Producer | User | |
| Built-up | 78.78 | 100 | 93.5 | 96.7 | 98.2 | 98.2 | 95.7 | 94.4 |
| Vegetation | 100 | 69.5 | 84.8 | 84.5 | 83.6 | 94.4 | 82.7 | 95.4 |
| Water | 96.3 | 93.6 | 94 | 90.4 | 96.1 | 84.5 | 100 | 81.6 |
| Overall | 86.7 | 91.1 | 92.2 | 91.4 | ||||
| Kappa | 80.2 | 86.6 | 88.3 | 86.8 | ||||
Clearly, Landsat 5 and Landsat 8 showed different results. Prior to the accuracy assessment, the true color combination between the two Landsat images as a basic/representative map shows different visual tones and colors. Landsat 5TM images have 120 m spatial resolution and also include seven spectral bands: band 6. Landsat 8 OLI/TIRS has improved the number of spectral bands, image quality, and spatial resolution compared to previous Landsat images (Poursanidis, Chrysoulakis et al., 2015). Therefore, the classification results from the Landsat OLI were better than those from Landsat TM. Furthermore, the waterbody surface not only shows blue and dark colors, but several natural and artificial causes are also responsible for the existing waterbody color. One reason for this is algal growth in lakes, streams, and canals, which may impart a green, brown, or even reddish color. Meanwhile, vegetation cover is depicted in green and dark colors, which have a similar tone to the water body. Therefore, the classification between vegetation and water bodies may not be entirely accurate.
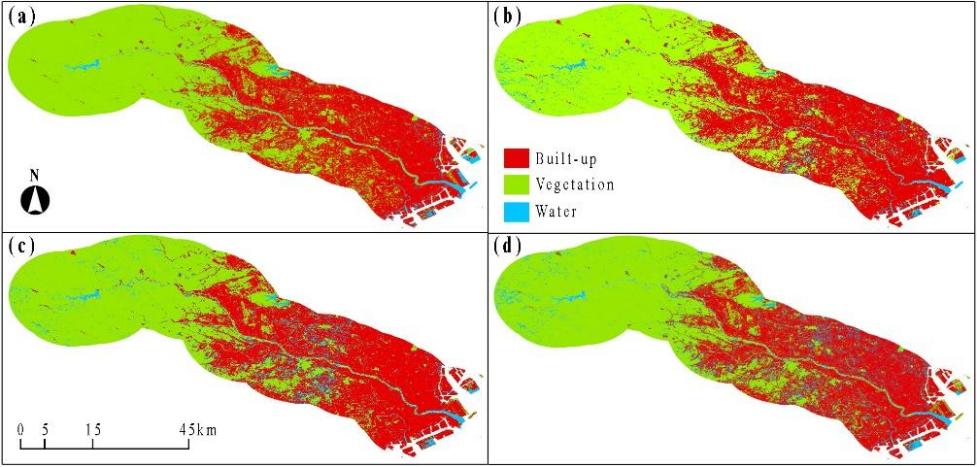
The results shown in Table 4 indicate that land in the Tama River Basin was mostly covered with vegetation, followed by built-up areas and water bodies. Notably, there was a progressive decline in vegetation and built-up areas from 1990 to 2010, followed by a subsequent resurgence in 2021. On the other hand, water bodies exhibited a consistent rise from 1990 to 2015. From the table, we can see that vegetation cover and built-up area decreased in all prefectures. The water body area is expected to expand by 2021. Based on previous information, the classification between water bodies and vegetation was possibly not entirely accurate. There was a possibility that the water body area was actually categorized as vegetation cover instead of general growth. This is because vegetation development had previously been implemented in the Tama River Basin. Since the Tama River basin flows across the Yamanashi and Tokyo Prefectures, the location was strategic for residing, thereby being crossed by many major transportation routes such as railway and road networks as a built-up area. Consequently, these routes are vulnerable to floods and environmental damage. Therefore, an environmental management plan has been implemented to preserve the natural environment of the entire Tama River Basin. The Plan was originally enacted in 1970 and consisted of four functional spaces that focused on natural spaces: nature-oriented recreational spaces, educational spaces, sensitivity development spaces, and ecosystem preservation spaces (Kanto, 2022). Therefore, the highest vegetation value in the entire study area occurred after greenspace preservation.
| Prefecture | Vegetation (km2) | Water (km2) | Urban (km2) | Pref. | |||||||||
|---|---|---|---|---|---|---|---|---|---|---|---|---|---|
| 1990 | 2000 | 2010 | 2021 | 1990 | 2000 | 2010 | 2021 | 1990 | 2000 | 2010 | 2021 | % | |
| Tokyo | 806.5 | 620.4 | 599.5 | 772.4 | 37.8 | 41.2 | 70.8 | 102.4 | 558.6 | 571.8 | 563.1 | 527.8 | 74.9 |
| Kanagawa | 47.0 | 35.8 | 28.9 | 33.6 | 12.8 | 13.9 | 19.4 | 31.3 | 192.9 | 220.2 | 221.5 | 187.9 | 13.5 |
| Yamanashi | 197.0 | 328.3 | 326.8 | 187.9 | 2.9 | 12.2 | 12.4 | 12.8 | 17.9 | 29.3 | 30.5 | 17.2 | 11.6 |
| Total | 1050.5 | 966.5 | 944.2 | 993.9 | 53.5 | 67.3 | 102.6 | 146.5 | 769.4 | 821.3 | 815.1 | 733.9 | 100 |
The result of the NDVI shows that the mean annual NDVI decreased from 1990 to 2010, followed by a significant increase in 2021 (Table 5). The NDVI value in 2021 shows that the maximum value is one, and the minimum value is -0.98. Meanwhile, the lowest mean NDVI value was in 2010 at 0.14. Since NDVI has been identified as one of the essential parameters when reviewing seasonal vegetation cover and its health quality (Sharma, Bangotra et al., 2022), we analyze the long-term vegetation dynamics from 1990 to 2021. The result shows increasing trends with slope > 1, which means that the vegetation quality and health in the Tama River basin increased accordingly.

Based on linear regression analysis, the seasonal NDVI trend in the Tama River Basin was highest during summer and autumn-winter with slope values of 0.0115 and 0.003, respectively, while the lowest slope was in spring at 0.0002. Findings from Sharma, Bangotra et al. (2022) explained that the NDVI value is higher in winter because of the extension of irrigation with surface water. The highest NDVI value during summer was also found in previous research (Li, J., Xi et al., 2022) and the NDVI was high in the forest region or when the crops were at the peak growth stage. In the northern hemisphere, as in Japan, a higher precipitation amount is recorded during the period of July to November (Klimavičius, Rimkus et al., 2023). As precipitation significantly affects the availability of water for irrigation needed for plant growth, it is understandable that the NDVI was high during the summer, autumn, and winter periods from June to December. However, to emphasize the NDVI value, the need for long-term investigation over different years to understand the variation caused by specific meteorological parameters should be considered (Sharma, Bangotra et al., 2022).
As shown in Figure 5, the green color with the highest NDVI mostly covers the forest region located in the mountainous area, whereas the lowest is located near Tokyo Bay downstream. In both 2000 and 2010, the peak NDVI values were limited to 0.76 and 0.70, respectively. The majority of NDVI measurements fell within the moderate and high range. This outcome is visually represented in Figure 5, where a predominant presence of yellow and green hues effectively conveys this distribution of values. To compare the NDVI value from each city as part of the study area, it was grouped into three categories based on frequency distribution on the annual value: low (-0.98–0.34), medium (0.34–0.64), and high (0.64–1). The results show that of the 68 cities, the highest and medium values of NDVI from 1990 to 2021 are mostly covered in Okutama, Tokyo. This area is surrounded by an abundance of mountain forests, resulting in the largest NDVI value. The forests of Okutama play an important role as places of recreation for urban residents and as valuable water sources for urban areas (ICLEI, 2022). This was an excellent environmental plan for the city to support plant cultivation, especially in the mountainous areas. The NDVI is an important indicator of landscape in mountainous areas (Zhu, Zhang et al., 2021). Therefore, it is important to monitor the NDVI status of the Tama River basin as a basic area where water flows.

Meanwhile, the lowest NDVI was located in Hachioji, Tokyo, in 1990 and changed to Ota City, Kanagawa, in 2021. Both the cities are located downstream of the Tama River. Based on its description, Ota City has the largest number of factories and shopping streets in Tokyo and serves as an important transportation node in the Tokyo Metropolitan Area, connecting and transporting people, goods, and information, which creates more built-up areas. Hachioji is a city developed through enhancing economic activity. Looking at the land use classification, the existence of vegetation was slightly apparent, indicating that the quality of the NDVI was reasonably low compared to that of other areas. The relationship between the upstream and downstream hydrological processes is important for water resource planning, especially in river basin areas. Water resources are important for portability, irrigation, and food production. It is essential to support the quality of the river basin and surrounding areas by maintaining and improving NDVI values.
| Annual | Spring | Summer | Autumn-Winter | |||||||||
|---|---|---|---|---|---|---|---|---|---|---|---|---|
| Low | High | Mean | Low | High | Mean | Low | High | Mean | Low | High | Mean | |
| 1990 | -0.32 | 0.84 | 0.40 | -0.27 | 0.77 | 0.35 | -0.44 | 0.87 | 0.22 | -0.72 | 0.94 | 0.40 |
| 2000 | -0.71 | 0.76 | 0.19 | -0.32 | 0.68 | 0.18 | -0.99 | 0.75 | 0.21 | -0.48 | 0.70 | 0.14 |
| 2010 | -0.41 | 0.70 | 0.14 | -0.75 | 0.97 | 0.19 | -0.99 | 0.86 | 0.30 | -0.70 | 0.76 | 0.26 |
| 2021 | -0.97 | 1 | 0.49 | -0.27 | 0.77 | 0.35 | -0.97 | 1 | 0.58 | -0.98 | 1 | 0.49 |
The annual LST shows an increasing value from 1990 to 2010, but it is decreasing in 2010. Figure 6 shows the spatial distribution of LST around the study area. The annual mean value of LST shows increasing trends between 1990-2010 and then plummeted to 10.18 in 2021 (Table 6). The LST map showed that the lowest LST was located around mountainous areas, and the highest LST appeared around urbanized areas. , from their findings, explained that urban areas with built-up development experienced lower and graduated surface temperatures during the study period. In mountainous areas, the LST was also found to be low (Xi, Zhang et al., 2023) which is similar to our findings. To further explain where the low and high LST were located in the study area, the LST ranged into three categories in each city based on frequency distribution on the annual value: low (-7,37–5,87), medium (5,87-19,11), and high (19,11-32,37).

It was found that low LST was mostly located in Okutama, Tokyo, between 1990 and 2021. This area is mountainous and covered by lush trees. During the day, low LST was the dominant effect in most forests. In addition, cooling or warming effects occur owing to evapotranspiration (Li, H., Zhao et al., 2015). According to Breil, Davin et al. (2021), evapotranspiration is an important part of the water cycle and is typically high in forests. Okutama region provides a natural environment and leisure activities for tourists owing to the cooling effect in this area. Lake Okutama is the fundamental water body in this area, as the Tama River flows upstream. In mountainous areas, LST might have a crucial effect on the physical structure of the area; thus, it affects the lives of people in the surrounding area Rani and Mal (2022).
However, a high LST was detected mostly in Hachioji, Tokyo, in 2010 and 2021, whereas a medium value was detected in this area in 2021. As a part of the metropolitan area of Tokyo, this area is dominated by built-up areas. Based on the land use classification results, the Hachioji area had the largest built-up area compared to other cities. Concerning industrial areas and buildings, Meng, Liu et al. (2022) mentioned that high urban temperatures can accelerate energy consumption for global warming, air pollution, and cooling, leading to heat strikes. Although this area is located in the foothills of Okutama Mountain, Hachioji City is considered to have the highest LST due to the built-up area that entirely covers the area.
| Annual | Spring | Summer | Autumn-Winter | |||||||||
|---|---|---|---|---|---|---|---|---|---|---|---|---|
| Low | High | Mean | Low | High | Mean | Low | High | Mean | Low | High | Mean | |
| 1990 | -5.36 | 24.62 | 11.45 | -23.19 | 30.59 | 13.49 | -19.88 | 29.92 | 13.57 | -5.63 | 24.79 | 10.85 |
| 2000 | -737 | 31.42 | 13.32 | 4.14 | 35.05 | 17.23 | 4.63 | 33.06 | 19.08 | -9.07 | 22.48 | 8.34 |
| 2010 | 0.46 | 32.36 | 17.95 | -9.70 | 27.99 | 10.69 | 11.61 | 35.21 | 25.63 | 0.73 | 33.81 | 15.34 |
| 2021 | -4.38 | 19.87 | 1 0.18 | -3.33 | 32.06 | 16.56 | -3.79 | 36.36 | 18.55 | -7 | 28.3 | 8.41 |
As shown in Table 7, the relationship between NDVI and LST is negative in 1990 and 2021. The correlation score was highly significant at -0.69, but it decreased in 2021 to -0.57 in 1990. The negative correlation between LST and NDVI means that the LST values continue to decrease, whereas the NDVI values continue to increase. Surface characteristics generally control LST, and because the NDVI assesses the value of vegetation cover, it provides a cooling effect on surface temperature (Gorgani, Panahi et al., 2013). Meili, Acero et al. (2021) and Guha and Govil (2020) stated that vegetation itself has the benefit of changing wind speed, humidity, air temperature, and average radiant temperature. With a high vegetation value, the environmental temperature was restored.
However, a positive correlation was also observed in both 2000 and 2010, with correlation coefficients of 0.45 and 0.02, respectively. This finding suggests a consistent trend in the behavior of LST and NDVI values. Additional research has similarly identified positive correlations between LST and NDVI (Guha and Govil, 2020; Karnieli, Bayasgalan et al., 2006). It has been noted that the correlations between LST and NDVI are contingent upon the year's season and the time of day (Sun, D. and Kafatos, 2007). For instance, during the winter season, there is a positive correlation between NDVI and LST. Similarly, Karnieli, Bayasgalan et al. (2006) discovered positive correlations between LST and NDVI mark ecosystems situated in high latitudes in northern regions.
| Year | Correlation coefficient |
|---|---|
| 1990 | -0.69 |
| 2000 | 0.45 |
| 2010 | 0.02 |
| 2021 | -0.57 |
After extracting the mean NDVI value per land cover class in the Tama River Basin, we found that the highest mean NDVI value was located in the vegetation area between 1990 and 2021, with the lowest surface temperature value (Table 6). The lower NDVI mean value was observed in the barren land, which had the corresponding highest mean of LST. However, a negative NDVI value was observed in the water area from 1990 to 2021. The basin area along the Tama River shows that the presence of built-up areas interferes with comfort, but high vegetation value creates a pleasant environment for citizens living in the basin area.
| LU Type | Mean NDVI | Mean LST | ||||||
|---|---|---|---|---|---|---|---|---|
| 1990 | 2000 | 2010 | 2021 | 1990 | 2000 | 2010 | 2021 | |
| Built-land | 0.20 | 0.03 | 0.04 | 0.21 | 14.1 | 17.7 | 23.4 | 13.2 |
| Vegetation | 0.55 | 0.34 | 0.40 | 0.70 | 9.4 | 10.3 | 13.3 | 7.8 |
| Water | -0.17 | -0.05 | -0.12 | -0.34 | 12.9 | 12.9 | 19.8 | 11.1 |
The Google Earth Engine (GEE) is a remote sensing program that is essential for monitoring and managing the environment using a satellite platform. This technology facilitates the capture of satellite data from different sources worldwide in a period that can be used to assist in the analysis. Research on the Tama River Basin used the GEE application and utilized general satellite images from Landsat 5 and 8 to analyze land use, vegetation dynamics, and land surface temperature between 1990 and 2021, showing that the process and results are collected in an open-source manner, which allows researchers to conducting research in other specific areas in the future.
The findings indicate that over the 30 years of development in the Tama River basin area, built-up and vegetation areas have been increasing simultaneously. As the built-up area increases, the NDVI value has also increased from 1990 to 2021. The values and trends indicated that vegetation quality and health in the Tama River Basin increased accordingly. The decreasing LST values also depicted this. The detailed characteristics depicted by the results from NDVI and LST show a fluctuating value from 1990 to 20021. However, the overall NDVI trend is increasing, and LST is decreasing, showing that in the last 30 years, the simultaneously decreasing mean values of LST and NDVI are not only affected by vegetation and LU but are also affected by the average temperature, the water surface, rainfall, and the selection of the investigation period.
There was an inverse correlation between LST and NDVI in 1990 and 2021, indicating that increasing the quality of vegetation reduces surface temperature. However, a positive correlation was found in 2000 and 2010, indicating that the relationship between LST and NDVI was influenced by other factors, such as seasonal factors and socioeconomic factors. The study showed that high and increasing values of NDVI are detected in mountainous areas, which are mostly covered by forest canopy. Meanwhile, high LST values were located downstream of the Tama River, dominated by built-up areas. The findings from the NDVI growth are considered to be due to the development of vegetation quality along the Tama River basin, indicating that the revitalization of Tama River management has been thoroughly implemented.
The Tama River restoration has been implemented through different approaches; however, from a natural perspective, the Tama River focuses on vegetation protection and management. The activities are correlated with nature, where people can get in touch with water, with a minimum of 60% of the area being natural spaces such as wide-open lawns, flower beds, grassy fields, natural green areas, and nature observation grounds. A management plan is implemented along the river, but in basin areas, the space for vegetation is limited because of urban expansion. Even though the NDVI increased, the quality of vegetation was still considered low. It is recommended to continually improve vegetation quality around the urban area of the Tama River in order to create a pleasant environment for citizens living in the basin area. Additionally, further efforts are needed to mitigate and take long-term adaptive strategies to regulate the impact of urbanization. For example, it is recommended to implement mixed land use patterns that combine residential, commercial, and green space to increase the NDVI in the area further. This can reduce the concentration of heat-producing activities and promote better airflow.
Overall, Environmental monitoring and assessment in river basins, especially in the Tama River, implicate climate change adaptation and habitat preservation for vegetation and temperature leverage. Meanwhile, sustainable development, conservation, and disaster risk recognition along the river with the city's involvement will contribute to the policy approach in the future. Land use changes dynamically highlight the region's anthropogenic relationship (socioeconomic). Therefore, the current resource management and conservation efforts are presented as a guide for the current situation in the Tama River Basin in the coming years. As separate research, the river basin monitoring also used spatial class and temporal trends for visualization, which is considered for pattern identification and effective management.
The key variables analyzed in this study are limited to land use, surface temperature, and vegetation dynamics. However, many other urbanization factors might affect vegetation dynamics. Moreover, the quality of satellite images is strongly impacted by changing seasons and weather, thus affecting the accuracy of collected data. While the Pearson correlation is a useful statistical measure for understanding the strength and direction of a linear relationship between two variables, it alone cannot fully explain the relationship between them. There could be complex interactions, saturation effects, or other non-linear patterns that the Pearson correlation cannot capture because it specifically measures linear relationships. Additionally, since there are three variables, there could be instances where two variables have a low correlation individually with Pearson correlation, but they might provide valuable insights. Therefore, future research should include more variables of urbanization and more analysis should be done to comprehensively see its relationship with vegetation dynamics in river basin area.
Conceptualization, A.F.; methodology, A.F., R.M.A.; software, R.M.A.; investigation, A.F., R.M.A; resources, A.F., R.M.A., T.D.T; data curation, A.F., R.M.A.; writing-original draft preparation, A.F., R.M.A.; writing-review and editing, A.F., R.M.A, T.D.T., K.F; supervision, T.D.T., K.F. All authors have read and agreed to the published version of the manuscript.
The authors declare that they have no conflicts of interest regarding the publication of the paper.
This research was funded by the National Natural Science Foundations (No.3xxx).Please avoid showingthe details of funding when you submit for review.