Urbanization, Environment and Sustainability
Measuring Street Green View Index Based on Dynamic Perception
A case study of streets in zhongshan district, Dalian

2025 Volume 13 Issue 1 Pages 22-33
Details
2025 Volume 13 Issue 1 Pages 22-33
Urban streets are an important space for residents' daily life, and their green visual level plays an important role in improving residents' travel and living environment. Therefore, the evaluation methods and means of street greening also need to be continuously refined and supplemented. From the perspective of dynamic perception, this article takes Zhongshan District, Dalian City as the research area. Firstly, a dynamic perception perspective street green view index measurement model was constructed by introducing indicators including green quantity, volatility index, and continuous index. Secondly, we selected some streets in Zhongshan District, Dalian City for the application of the measurement model, and obtained objective quantitative measurement results. Finally, we evaluated street greening combined with subjective perception surveys to verify the proposed indicators. The results indicate that green quantity are important factors affecting the visual quality of streets. Lower volatility index and continuous index can achieve better visual quality. The research has further improved the green space measurement method, providing scientific basis for the refined design of urban green spaces.
Street greening, as an important component of urban street green space, can improve the urban environment while beautifying the city image. In order to better evaluate and improve the green space of urban streets, we need to refine and expand the evaluation methods and means. Previous studies have commonly used urban two-dimensional plane indicators such as green coverage rate, green space rate, normalized vegetation index (NDVI), urban-Blue-and-Green-Spaces and per capita green space area to measure the level of urban or street greening (Paul and Bardhan, 2022). Moreover, some scholars explore people's perception of green spaces by studying informal green space (IGS) (Kim, Rupprecht et al., 2020). However, the green view index (GVI) measures the quality of greenery from the perspective of human vision, making up for the difficulty of two-dimensional evaluation methods in reflecting the effect of three-dimensional and vertical greenery (Lü, Dou et al., 2022).
This article will construct a more refined measurement model for street green space perception at the micro scales from the perspective of dynamic perception, based on existing green visibility indicators. The measurement model will be applied to streets in Zhongshan District, Dalian City, and objective measurement data will be obtained. Then, using the SD survey method, we compare and analyze objective data with subjective evaluations. This research has improved the evaluation system for street green space, providing a reference basis for the design of green spaces at the street scale.
Green view index can indicate the three-dimensional green volume from the human visual level, and to a certain extent, it represents the level of greening in urban space. The current research believes that urban road greening is the most influential and closely related factor of the green vision rate, so the green vision rate is currently widely used to evaluate the Walkability of streets and the evaluation related to the ecological environment (Xiao, Wei et al., 2018).For example, Xu, Meng et al. (2017) discussed the impact of architectural interface and green visibility on street experience. Wang and Huang (2021) uses green view index as the primary indicator for evaluating urban ecological comfort, reflecting the quality of the ecosystem from a visual perspective.
Currently, there are two main methods to obtain raw image data for calculating green view index: on-site image shooting and street view images (SVIs). The latter can obtain street view images data from multiple sampling points in a short period of time, effectively avoiding the cumbersome and safety hazards of on-site collection. In the previous researches, limited by data acquisition and image recognition methods, the measurement scale of urban street green visibility was relatively small, with the development of artificial intelligence methods, more and more research is combining streetscape images with deep learning methods to conduct quantitative street space research. These studies break through the limitations of traditional research methods in data collection and processing, and use machine learning methods to reduce the subjectivity of evaluation (Tong, 2021). However, street view images also have several limitations such as significant data update delays, different shooting viewpoints from human viewpoints, low resolution, and difficulties in machine recognition.The calculation method of green view index is also gradually developing in recent years. Semantic segmentation technology can quickly analyze images, achieve pixel level segmentation of images based on different semantic expressions, and output the proportion of pixels in each element, thus achieving the calculation of green view index and other indicators. Combined with street view images, research on green view index is gradually applicable to large-scale measurement of urban street spatial quality (He, 2022; Tang and Long, 2017).
Through the further analysis of the existing literature, in terms of evaluation of green space, the level of regional green view index is mainly represented in a relatively macro way. The analysis method of green view index indicators is relatively single, and cannot quantify the dynamic changes of green vision rate when people move along the path. Based on this, this article proposes a street green space perception measurement model, which focuses on the continuous and changing visual perception attributes of pedestrians in urban public spaces from the perspective of dynamic visual perception of people walking in the street. More precise quantitative indicators are used to represent the dynamic perception of green changes by people in the street, more effectively describing the changes in the street green environment.
In the design of urban street space, designers usually need to follow human scale, behavior, and cognitive patterns, paying attention to the real experience that perceivers obtain in urban space (Zhou and Wang, 2021). Especially in the context of shrinking and humanized urban public spaces, small-scale spaces may provide residents with additional opportunities for public activities (Li, Ye et al., 2024). When people move in urban public spaces, the external information they perceive is also moving and constantly changing. In this study, dynamic perception focuses on the continuous and changing visual perception attributes of pedestrians moving in urban public spaces from the perspective of their perception of walking along a path.
The traditional green view index is calculated based on the proportion of green components in the visual image perceived by the observer, which can intuitively reflect the level of green perception of a person at a specific location. According to scholars' research, when the green view index is less than 5%, the green perception is very poor, and a green view index of 5-15% indicates poor green perception, a green view index of 15% -25% indicates average green perception, a green view index of 25% -35% indicates good green perception, and a green vision rate exceeding 35% indicates very good green perception (Orihara, 2006).
On the basis of obtaining green view index, combined with the previous discussion and analysis of existing research, this study regards the continuous changes in green view index perceived by humans as a continuous curve when walking along the path, then, several quantitative indicators were added to reflect the continuous changes in the path green visibility curve, including green quantity, volatility index and continuous index (Table 1).
| Index layer | Description |
|---|---|
| Green quantity | Greening amount of street space |
| Volatility index | The uniformity of street greening distribution |
| Continuous index | The proportion of continuous greening in streets |
Green quantity is used to measure the amount of greenery in the street space. Generally speaking, green quantity of a street is positively correlated with the greenery area on both sides of the street. However, simple green quantity can only describe the overall greening level of the street, and it is difficult to express the specific feelings of pedestrians during walking. Therefore, the following indicators have been added.
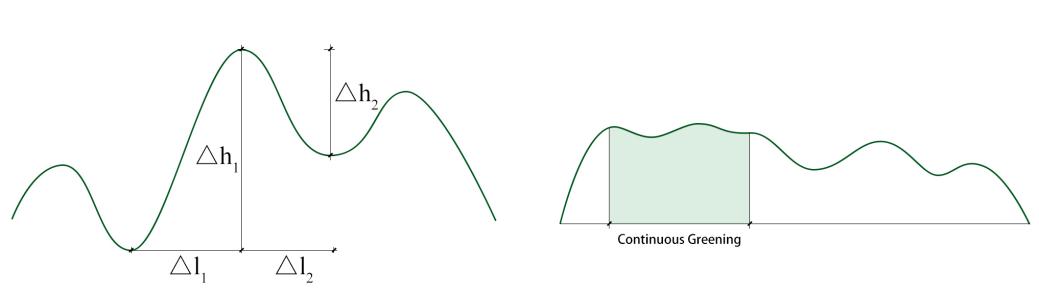
Volatility indexVolatility index indicates the change degree of green visibility value in the path, that is, the visual stability of street greening, which is an important quantitative index in this study. In the streets with good greening level, the greening mode is usually continuous and evenly distributed; On the contrary, in the streets with low overall greening level, the greening mode is mostly dot shaped and discontinuous. The fluctuation index reflects some attributes of linear greening, which is directly reflected in the slope of the continuous curve of green visibility.
The specific calculation method is to take the horizontal distance △l between the extreme point and the two adjacent extreme points on the left and right. The greater the △l, the smaller the volatility; On the contrary, the smaller the △l, the more significant the fluctuation of the green view index. In addition, calculate the height difference △h between the left and right minimum points and the maximum points respectively. The greater the △h, the more significant the fluctuation of the green view index. Taking the value of k=△h/△l can more directly reflect the fluctuation degree of green visibility. The greater the K value, the greater the volatility of the green apparent rate of this path; The smaller the K value, the more uniform the greening distribution along this path.
Continuous indexContinuous index indicates the proportion of continuous greening in the whole street in the street. Based on the previous discussion, pedestrians have a more comfortable visual experience when the green view index is above 25%. Therefore, in this study, the continuous road section with a green view index of more than 25% is defined as a continuous green section, which has a low fluctuation index, reflecting a relatively continuous, stable and comfortable green viewing experience in the street. In the actual street, the overall green viewing rate is low, and the path with poor greening level will also have some continuous green viewing experience. The higher the proportion of continuous greening in the path, the better the overall greening level of the street (Figure 1).
The calculation method of green view index is realized by analyzing the image at the pixel level. In this study of the street green visibility measurement, in order to accurately describe the real-time dynamic feeling of people walking in the path, the data source is the image perceived by the observer in the street walking space, reflecting the green visibility level of the environment.
The study streets were sampled by means of on-site video capture, which is based on human viewpoint and pedestrian path, with high resolution and good continuous of street view. The selected shooting time is early summer with sufficient lighting and suitable temperature, which is in mid June 2022, and it is taken during sunny days with less foot traffic. The specific process is as follows: the researcher walked through the sidewalk at a constant speed and recorded the environment on both sides of the street by holding a PTZ camera, and then use Adobe Premiere intercepted and derived the static image frames in the sampling video one by one, so as to obtain the continuous static image of the street view and carry out subsequent calculation. The number of output pictures can be adjusted independently. Compared with street view images data, the way of live walking video recording can more accurately describe the visual perception of pedestrians in the street walking space. After obtaining the continuous static image of street view, the semantic segmentation script is used for automatic image analysis and green rate calculation (Figure 2).

Living streets are linear spaces in the daily lives of residents, with functions of transportation, daily life, and social interaction. They are widely distributed around open residential areas and are important urban public spaces. A good visual quality of street space is beneficial for increasing the emotional appeal and street vitality of residents. Zhongshan District is the historical center of Dalian City, with a relatively complete street texture, high population density, and a strong residential atmosphere. This reasearch selected roads around Nanshan Road in Zhongshan District for research, among which 10 roads are typical living streets. There are a total of 10 streets, all of which are typical residential streets. The measurement length of each road is about 500m. The research area is shown in Figure 3.

After completing the preliminary model establishment and street video data collection, the exported images from the video are imported into the PyCharm semantic segmentation script for analysis, and export the green view index of the collection points in each section of the street, and calculate it through the indicators proposed in the previous chapter. The final measurement result is shown in Table 2.
| Number | Street name | Average GVI | Green quantity | Volatility index | Continuous index |
|---|---|---|---|---|---|
| 1 | Wuhan Street | 16.3% | 46.41 | 4.164 | 0.19 |
| 2 | Huachang Street | 8.8% | 25.04 | 2.817 | 0.02 |
| 3 | Nanshan Road | 20.1% | 60.06 | 2.917 | 0.24 |
| 4 | Qiqi Street | 12.5% | 35.76 | 3.385 | 0.09 |
| 5 | Kunming Street | 13.6% | 38.89 | 2.095 | 0.1 |
| 6 | Youhao Road | 8.1% | 23.05 | 2.062 | 0 |
| 7 | Duli Street | 14.6% | 41.65 | 2.681 | 0.06 |
| 8 | Yan'an Road | 15.7% | 44.73 | 2.503 | 0.03 |
| 9 | Jincheng Street | 21.5% | 61.32 | 2.916 | 0.35 |
| 10 | Jiefang Street | 24.6% | 70.01 | 2.873 | 0.47 |
It turns out that that the average green view index of the research streets was between 8% and 25%, and the overall green visual perception was at the general to good level, and there are significant differences between streets. Jiefang Road, Nanshan Road and Jincheng Street have high green quantity and high continuous index, indicating that the three samples have good greening level and the green belt is relatively continuous. The green quantity of Wuhan Street, Duli Street and Yan'an Road is close, but the volatility index of Wuhan Street is high and the continuous is poor. According to the field investigation and analysis, the main reason is that a large number of parking spaces are set on both sides of the road, occupying the space of sidewalk and green belt, and the green experience is discontinuous due to the division of road greening. There are plenty trees on both sides of Yan'an Road, through the coordination of plants at different levels, a more continuous green visual experience is finally measured. The green quantity of Youhao Road and Huachang Street are both low, and the continuous index is also low. The main reason is that a large area of sidewalk is occupied by parking spaces, and shrubs cannot be planted. At the same time, the density of roadside trees is low, and the species of trees is relatively single.
Through the correlation analysis between the quantitative measurement results, the correlation between volatility index and average GVI is low, and the correlation coefficient r value is 0.286, which belongs to low correlation. The correlation coefficient r value between continuous index and average GVI is 0.913, which is highly correlated, that is, the higher the green amount of street green rate, the higher the continuous index. For streets, a lower overall greening level can measure a lower volatility index and a continuous index, while a higher local greening level will measure a larger volatility index, but this is difficult to reflect in the average green visual rate or green quantity, so it is difficult to directly evaluate the visual quality. The relationship between specific quantitative indicators and visual comfort needs to be analyzed in combination with the following subjective evaluation.
Investigation on subjective evaluation using SD methodIn this SD method, we selected 10 pairs of adjective pairs with positive and negative meanings which are suitable for describing the visual perception of the street for the respondents to describe their subjective impression, used five grade evaluation scale, the score is set as -2, -1, 0, 1, 2, which is set symmetrically with the central axis (Table 3).
| Factors | Adjective pairs |
|---|---|
| 1 Space | Spacious - enclosed |
| 2 Gradations | Distinct - fuzzy |
| 3 Naturalness | Vegetated - bare |
| 4 Color | Colorful - dull |
| 5 Vitality | Energetic - listless |
| 6 Variation | Variable - monotonous |
| 7 Cleanliness | Clean - dirty |
| 8 Brightness | Bright - dark |
| 9 Liveliness | Lively - deserted |
| 10 Attraction | Attractive - unattractive |
As this study is about spatial perception, we selected undergraduate and master's students in architecture with certain professional knowledge as the research subjects. The respondents will comprehensively consider the overall visual experience of the street to evaluate the visual quality of each street. The survey adopts the method of watching videos, which means that during the testing process, the selected ten streets will be played as videos to the respondents, and the respondents will conduct a comprehensive evaluation of the visual perception of the streets based on the video images. By watching videos, respondents can obtain specific street views of the street without having to walk on site.
| Street Number | Average | |||||||||
|---|---|---|---|---|---|---|---|---|---|---|
| 1 | 2 | 3 | 4 | 5 | 6 | 7 | 8 | 9 | 10 | |
| 0.95 | -0.1 | 0.65 | -0.1 | 0.8 | 0.35 | 0.05 | 0.7 | -0.6 | -0.5 | 0.265 |
| 0.45 | -0.05 | 0.8 | 0 | 0.45 | -0.45 | 0.55 | 0.65 | -0.2 | 0.75 | 0.295 |
| 0 | 0 | 1.35 | 0.4 | -0.4 | -0.3 | 0.65 | 0.8 | 1.02 | 0.75 | 0.43 |
| 0.2 | -0.2 | 0.9 | -0.45 | 0.5 | 0.2 | 0.3 | 0.1 | 0.5 | 0.7 | 0.275 |
| 0.2 | 0.1 | 0.65 | -0.35 | 0.65 | 0 | 0.25 | 0 | 0.25 | 0.4 | 0.215 |
| 0.1 | 0.1 | 0.5 | -0.4 | 0.45 | -0.15 | 0.55 | -0.3 | 0.2 | 0.3 | 0.135 |
| 0.7 | -0.3 | 0.8 | 0.8 | 0.65 | -0.25 | 0.3 | 0.8 | 0.5 | 0.7 | 0.47 |
| 1 | 0.2 | 1.05 | 0.3 | 1.1 | 0.15 | 0.3 | 0.9 | 0.3 | 0.85 | 0.615 |
| -0.1 | -0.25 | 0.4 | -0.45 | 0.4 | 0.35 | -0.1 | -0.15 | 0.3 | 0.5 | 0.09 |
| 0.15 | -1 | 0.5 | -0.15 | 0.25 | -0.2 | -0.3 | 0 | -0.3 | 0.2 | -0.085 |
According to the subjective evaluation results of each street, the samples are divided into three categories. The indicators of Nanshan Road, Kunming Street, and Jiefang Street are all higher than the average, and the samples of both streets have high naturalness and brightness; Most indicators of Qiqi Street, Youhao Road, and Huachang Street are below the average, with Qiqi Street scoring around -0.5 in terms of color richness, vitality, variation, and liveliness; The evaluation values of Wuhan Street, Kunming Street, Independent Street, and Yan'an Road are all around the comprehensive average, with Wuhan Street having the highest score for spatial sense and Kunming Street having the lowest score for naturalness.

Finally we obtained total of 50 valid questionnaires. The average results of the questionnaires were summarized to obtain the average scores of various evaluation factors (Table 4), and the SD method evaluation line chart of street visual perception in the research area was drawn (Figure 4). The red line is the overall comprehensive evaluation, and the black line is the evaluation of each sample. Overall, the visual evaluation of the street environment by the respondents is generally above zero, and the differences among different streets are significant.
Analysis and results
Obtain subjective evaluation values for each street by adding the SD values together, by combining objective measurements with subjective evaluation results (Figure 5), Jiefang Road, Jincheng Street, and Nanshan Road all achieved an average green vision rate of over 20%, with low volatility index and relatively high continuous index. These three street samples all obtained subjective evaluation scores higher than the comprehensive average. The subjective evaluation values of Qiqi Street, Huachang Street, and Youhao Road are all negative, and compared to other samples, Qiqi Street and Huachang Street have a higher volatility index. The average green view index of Youhao Road is lower, less than 10%, and its continuous index is lower. The volatility index is also at a lower level in the sample. The main reason is that when the overall greening level of the street is low, the degree of change in people's green perception during travel is correspondingly reduced. By comparing Wuhan Street and Yan'an Road, the continuous index of Yan'an Road are lower than those of Wuhan Street, while the volatility index of Wuhan Street is higher, and the subjective evaluation values of the two are relatively close. Independent Street and Kunming Street are relatively close in terms of overall green volume, with Kunming Street having a lower volatility index and a higher continuous index. The subjective evaluation value is also higher than Independent Street.
The comparative analysis of subjective and objective results shows that the green view index and green quantity are important factors affecting the visual quality of streets. In streets with similar overall greening levels, lower volatility index and higher continuous index can achieve better visual quality. Therefore, in the design of street greening, especially for residential streets, the first thing that needs to be improved is the overall greening amount of the street, while avoiding the obstruction and breakage of green belts as much as possible, forming a linear and continuous green space.
This article proposes a dynamic perception perspective based green visual perception calculation method for street space based on green view index, and obtains a measurement model for street green space. Through the investigation and analysis of some streets in Zhongshan District, Dalian City, the similarities and differences of green vision rate indicators between different paths were obtained. Combined with subjective evaluation results, the application of the green vision rate measurement model based on dynamic perception in the evaluation of street urban design environment was tested. This measurement model provides a method for calculating the green visibility index that represents the continuity of greening in the path at the meso micro scale. After measurement, it was found that the overall visual quality of the street space in Zhongshan District, Dalian City is average. The current road greening design still needs to be improved in terms of refinement, such as the comprehensive design of plants and street infrastructure; Properly enhance the street spaciousness; Measures such as enriching the types of green trees and reducing barriers in green belts.
In future research, further calculations can be made by combining road classification and accessibility weights, as roads with higher accessibility usually have higher traffic volume, resulting in different weights for road greening. In addition, the indicators in this model can be added to the visual quality evaluation indicators to analyze the visual quality of street space and establish a more comprehensive visual evaluation system for street space.
The study was written by Fangyu Wu and reviewed by Liang Wu. All authors have read and agreed to the published version of the manuscript.
The authors declare that they have no conflicts of interest regarding the publication of the paper.