Regular Article
Experiments on and Finite Element Analyses of the Tilting of Fine Steel Wire in Roller Die Drawing
2013 年 53 巻 10 号 p. 1850-1857
詳細
2013 年 53 巻 10 号 p. 1850-1857
Roller die drawing is required for manufacturing low-formability materials such as high-carbon steels into fine wires with a diameter of 500 μm or less because of its characteristic lower friction than conventional die drawing. However, tilting, which is the inclination of the wire under the roll bite, often occurs in fine wires, which degrades their dimensional accuracy. Excessive tilting may generate wrinkling and overfill of the wire; thus, the design of the drawing setup of roller dies for reducing tilting is important from an industrial viewpoint. With the aim of designing a new setup for roller die drawing that can eliminate tilting; we carried out systematic experimental and analytical investigations. We first experimentally focused on the distance between adjacent rollers, and then theoretically focused on the area reduction ratio and roll-to-wire diameter ratio using the finite element method (FEM), taking the twisting moment as a representative parameter to evaluate the effect of different manufacturing conditions. It was found experimentally that there is a maximum threshold distance between adjacent rollers for preventing tilting. To draw a 200-μm-diameter wire without tilting, the roller distance should be set at no more than 8 mm, which leads to a more compact setup than the conventional one. Theoretical analysis revealed that a smaller area reduction ratio and a smaller roll-to-wire diameter ratio are required to reduce the tilting of the wire in roller die drawing.
There is increasing demand for the manufacture of lightweight parts for more environmentally friendly vehicles, construction machines, and airplanes with the aim of reducing energy use. Wires with smaller cross sections are strongly required to satisfy the demand for weight reduction and the conservation of metal resources. Fine copper electric wires with a diameter of approximately 200 μm are manufactured by a continuous die drawing process involving more than 20 passes in the cold state.1) This is because copper is relatively soft and its work-hardening exponent is high, which ensures good formability in cold working.
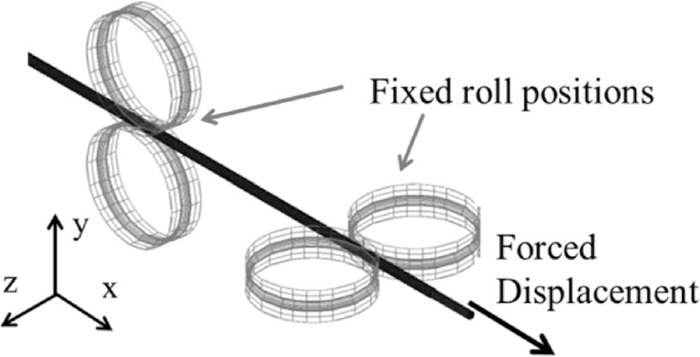
The steel industry also requires a manufacturing process for wires with smaller cross sections. High-carbon steel wires of 200 μm diameter are widely used to cut silicon wafers used for LEDs and solar cells, as cutting with a wire saw markedly increases the cutting speed and improves the quality of the cut surface. A huge number of steel cords made of high-carbon steel are manufactured and used in vehicle tires. Although there is increasing demand for fine steel wires, wires with smaller cross sections incur a greater risk of breakage during the manufacturing process. However, drawing with conventional dies creates a large amount of friction between the wire and the die, which damages steel wires with a low formability, increasing the likelihood of defective products and the risk of breakage. Continuous cold drawing without intermediate annealing is impossible because of the low formability of high-carbon steels. It is necessary to heat-treat, pickle, and lubricate wires before and during drawing, which results in increased costs. Large amount of relative slip takes place under the high contact pressure at the interface between die and wire. This relative slip induces the rapid wear of dies, although die and wire are sufficiently lubricated to reduce friction. Roller die drawing is more appropriate than conventional die drawing for high-carbon steel are wear and surface fatigue at die surface.2) Roller die drawing generates less friction than drawing with conventional hole dies, because the rollers are rotated freely3,4,5) and the relative slip between the wire and die is decreased markedly. Drawing stress decreases markedly due to the reduction of relative slip and frictional stress acting to the inverse direction of drawing direction: hence, the manufacturing fine wire with the diameter less will become feasible by the drawing with roller dies. In fact, the merits of this process are the capability of producing wires with a diameter of less than 500 μm, an increased area reduction ratio per pass, a higher drawing speed, no intermediate annealing, a lower power consumption, and improved mechanical properties.6,7,8) However, one disadvantage of roller die drawing compared with conventional die drawing is that there is a gap between the rolls. If the wire tilts during roller die drawing, it may result in overfilling between the rolls, as illustrated in Fig. 1, which reduces the dimensional accuracy of the drawn wire. Thus, the use of roller die drawing necessitates technologies that suppress the tilting of the wire. These technologies, or criteria for tilting, are closely related to the design of the die and the deformation characteristics of the wire subjected to roller die drawing.
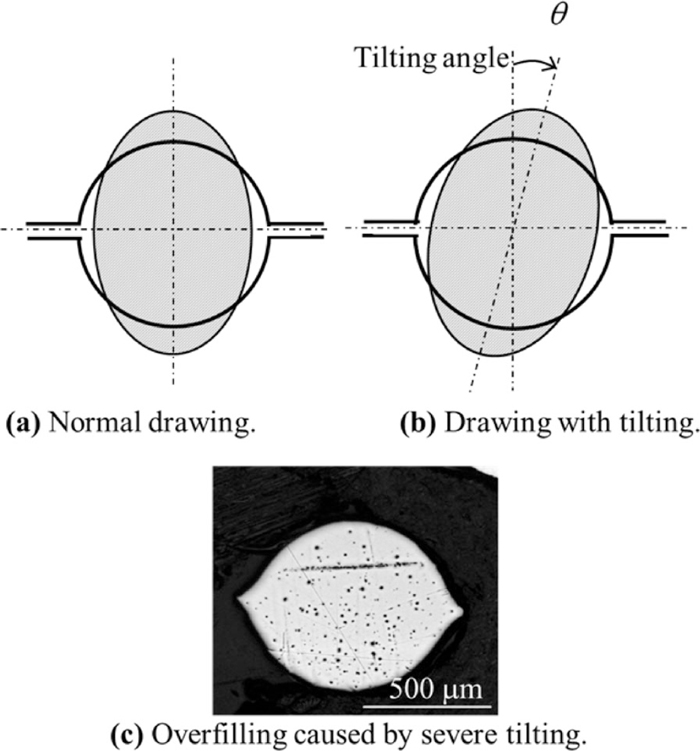
Twisting of wire and overfilling after roller die drawing.
The purpose of this study is to find criteria for suppressing the tilting of the steel wire during roller die drawing. First, we experimentally determine the optimal distance between adjacent rollers. The wire with the diameter d of 1 mm to 4 mm is used in experiment to enable the measurement of tilting angle, but it will reproduce the tilting of fine wire as several hundred microns when the ratio of roll diameter to wire ranges between 6.25 and 25. Then, steady-state and non-steady-state FEM analyses are conducted to clarify the deformation mechanism and the key factor reducing the moment acting on the wire between the adjacent rollers. Finally, we propose a new structural design for roller dies for the manufacture of fine wires of less than 500 μm diameter.
Figures 2 and 3 show compact roller dies with adjacent vertical and horizontal rollers,9) named ‘cassette roller dies’. A drawing system employing cassette roller dies consists of two pairs of cross-axis adjacent rotating rollers, where the distance between the two pairs of rollers is designed to be the smallest possible considering the limitation of the structures. The two pairs of rollers are arranged vertically and horizontally and have oval grooves. This roller drawing system is useful for producing wires of very small diameters from 4 to 0.5 mm. We attempted to draw a wire of less than 500 μm diameter using these dies by roller die drawing, but the dimensional accuracy was less than that of wires manufactured by conventional drawing using hole dies. One of the causes of the reduced accuracy was tilting, as explained in the previous section and Fig. 1. Tilting is the inclination of the material. Slight tilting results in reduced dimensional accuracy, and severe tilting results in wrinkling and overfilling. It is important to develop an effective processing method for investigating the tilting mechanism and preventing tilting. The roller die drawing is usually used for the drawing of metals with less workability, because of the advantage of the process with the less slip between die and wire. As the work hardening coefficient is high and dimensional accuracy of drawn wire is poor in such metals, the area reduction of each pass is relatively low, namely as low as 10%. In fact, niobium wire is drawn with area reduction of 10% by roller dies drawing, and mechanism of tilting under such low reduction area is worth investigating to optimize the process parameters of drawing of wire with poor workability as niobium and high carbon steel. Hence, the area reduction between 4% and 12% is selected as roller die drawing condition in model experiment presented in this paper.

Front and side views of cassette roller dies.

Compact structure with adjacent vertical and horizontal rollers for roller dies drawing.
If we assume that the increase in tilting between passes is within the elastic range, the tilting angle in roller die drawing is expressed as
| (1) |
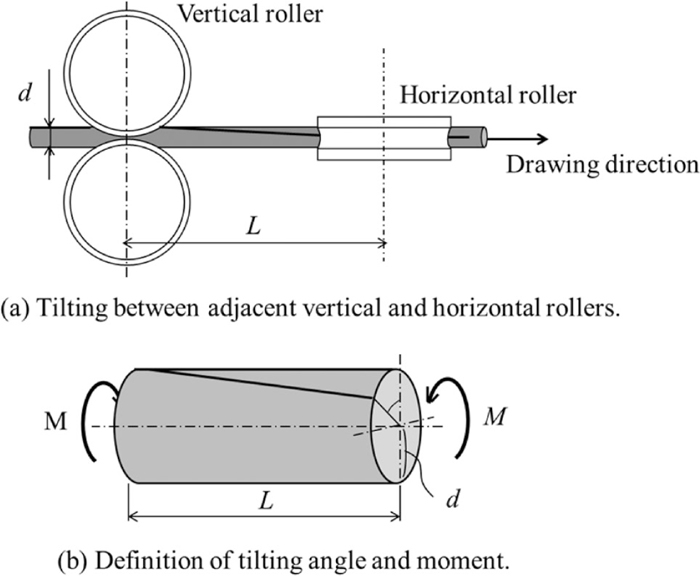
Tilting between adjacent rollers and tilting mechanism.
We used an oval-oval pass schedule, which is a prerequisite for achieving high dimensional accuracy. Table 1 shows the equipment specifications and experimental conditions. The test piece was made of low-carbon steel, the mechanical properties of which are shown in Table 2.
| Pass schedule | Oval-Oval |
| Area reduction of each pass | 4% |
| Drawing speed (mm/min) | 300 |
| Distance between rollers L (mm) | 15 |
| Roll diameter D (mm) | 25 |
| Material of test piece | Low-carbon steel |
| Diameter d (mm) | ϕ4 | ϕ3 | ϕ1 |
|---|---|---|---|
| Young’s modulus E (MPa) | 2.0×10⁴ | ||
| 0.2% Proof strength σ (MPa) | 620 | 440 | 300 |
| Tensile strength σ (MPa) | 664 | 450 | 420 |
The experimental method can be divided into two parts. First, we measured the tilting angle between the adjacent rollers and determined whether or not it was within the elastic range. Figure 5 shows the experimental apparatus used for the in situ measurement of the tilting angle. We marked 3-mm-diameter wires in advance and then measured the change in the position of the mark using a CCD camera. On the basis of the change in the position of the mark, we converted the displacement into the tilting angle. To monitor the tilting angle between adjacent rollers, we placed the CCD camera between two passes or after the second pass.
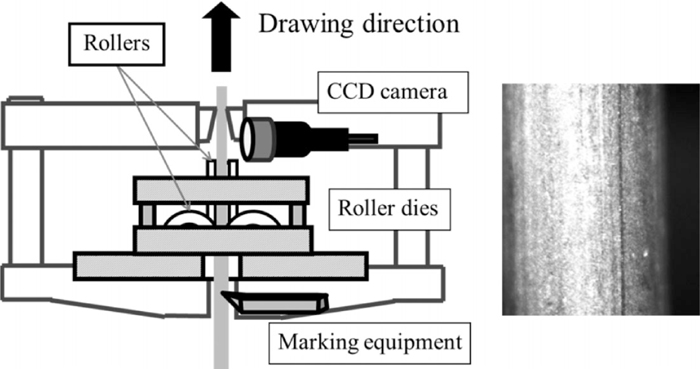
Schematic representation of drawing equipment.
Second, we focused on the effect of the distance between adjacent rollers on tilting when the wire diameter is 3 mm. The tilting was determined from the change in the drawing force during drawing. Figure 6 shows an example of the change in the drawing force. The drawing force can be divided into three stages. The first stage is the drawing force of the first pass. After the wire passes through the first pass, the drawing force enters the second stage, shown as the long plateau in Fig. 6, which corresponds to the total drawing force of the first and second passes. The final stage has the drawing force of only the second pass. When roll drawing using two pairs of rollers is conducted, the second drawing force remains constant and the resultant wire diameter is very accurate. However, once tilting occurs, the drawing force of the second stage decreases, as shown in Fig. 7, and the wire diameter becomes inaccurate. The drawing force was measured with a load cell and the dimensional accuracy of the wire was measured with a laser scan micrometer to determine the occurrence of tilting from the viewpoint of product geometry.
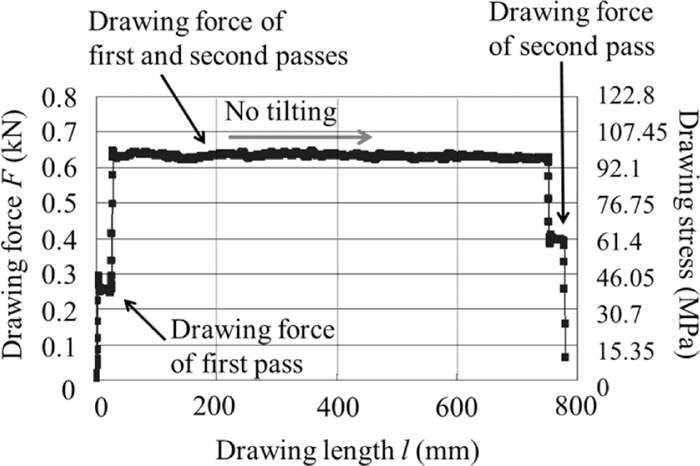
The drawing force(stress) is steady when tilting does not occur.

The drawing force(stress) exhibits a gradual change when tilting occurs.
Figure 8 shows the tilting angle between the first and second passes measured by the in situ system using a CCD camera shown in Fig. 5. Figure 9 shows a model of the tilting phenomenon based on Fig. 8, where lines measured by the CCD camera at the beginning of roller die drawing (t = 0) and at time t = t1 are schematically shown. The tilting phenomenon involves torsional deformation and rigid rotation. These figures suggest two facts. The first is that, once tilting occurs, rigid rotation is initiated in the roll bite of the first pass and the wire is not restricted completely in the roll bite of the first pass. Second, to produce a precise wire, the tilting angle must not exceed 5°, including the torsion and rigid rotation. From this value, we considered that the degree of torsional deformation in our experiment was within the elastic range and that the tilting angle formula in roller die drawing was exactly expressed by Eq. (1). According to this formula, the moment M and the distance between the two pairs of rollers L are critical in eliminating tilting and maintaining the dimensional accuracy of the wire after roller die drawing.
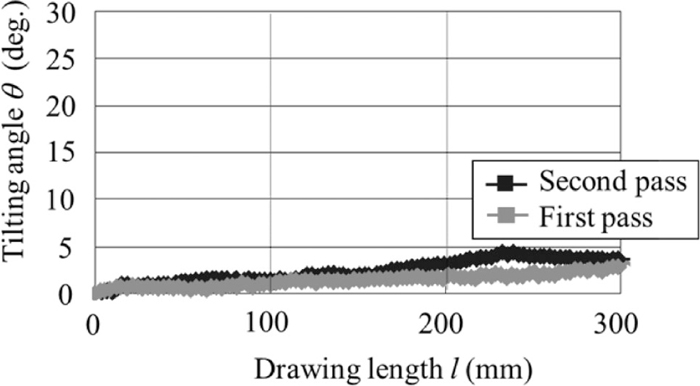
Gradual change in tilting angle when L is 135 mm.
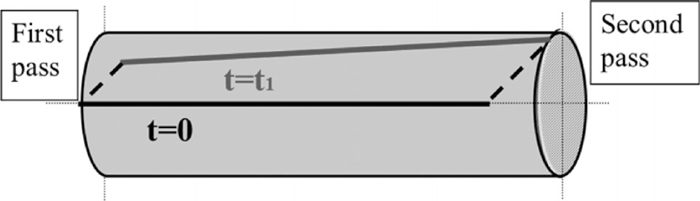
Model of moment acting on wire between first and second passes.
Figure 10 shows the relationship between the distance between adjacent rollers L and the tilting of a 4-mm-diameter wire. Figure 10(a) shows that when L was 166 mm, the drawing force was constant, but when L was 196 mm, the drawing force gradually decreased, as shown in Fig. 10(b). The maximum allowable distance between the rollers without the occurrence of tilting was 166 mm for a 4-mm-diameter wire. For a 3-mm-diameter wire, the distance was 131 mm, and for a 1-mm-diameter wire, the distance was 40 mm. From these experiments, the relationship between wire diameter d and the distance between two pairs of rollers L at the initiation of tilting can be expressed as
| (2) |
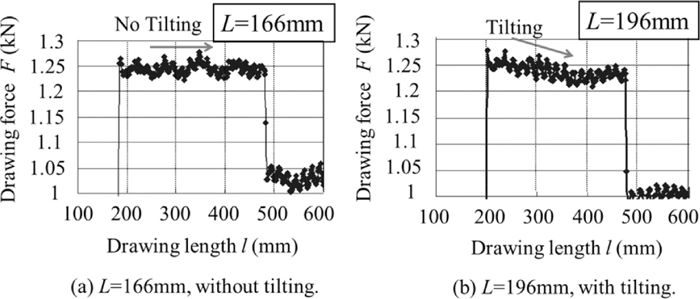
Gradual change in drawing force. The wire diameter is 4 mm.
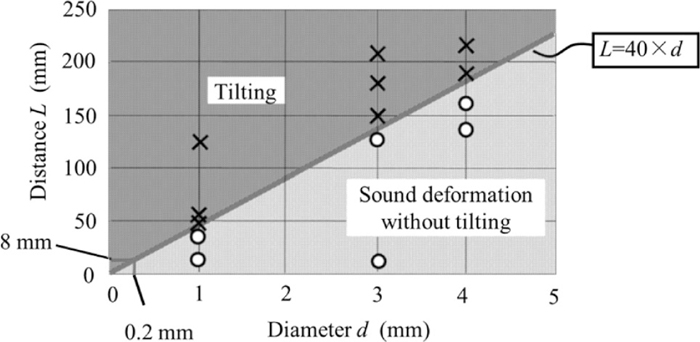
Relationship between wire diameter and roller distance according to generation of tilting.
The main feature of our newly designed roller die drawer was the extremely short distance between adjacent rollers. Such a short distance caused interference between the adjacent rollers when three or more stands were arranged in a line. Thus, a complete two-stand arrangement was needed. This arrangement necessitated changing the pass schedule from oval-oval to oval-round. The area reduction ratio and the roll-to-wire diameter ratio were designed on the basis of the results of FEM simulations, as explained in the next section.
Tilting is initiated by the loss of moment balance owing to a slight disturbance of the position or the deformation of a wire at the roll bite. The likelihood of tilting is governed by the degree of restoration deformation after the initiation of tilting. In other words, tilting is characterized by overturning and restoration of the workpiece, induced as a result of a plastic metal flow that is symmetric about the center point of the wire. This consideration implies the need to evaluate the external moment acting on the roll bite in the theoretical analysis outlined in this section.
The tilting phenomenon can be divided into two parts: steady-state tilting and non-steady-state tilting. Steady-state tilting corresponds to steady-state plastic deformation, when no further change in the tilting angle occurs during the progress of roller die drawing. Non-steady-state tilting is that in which tilting is still in the progressive stage so that the tilting angle changes with time. The torsional moment during steady-state tilting induced by plastic deformation was analyzed by a three-dimensional rigid-plastic FEM.11,12) For non-steady-state tilting, we carry out a three-dimensional elastic-plastic FE analysis. In these analyses, we evaluated the torsional moment acting on the wire under a range of roller die drawing conditions.
4.2. Steady-state TiltingWith the aim of reproducing the plastic metal flow symmetric about the center point in steady-state tilting, the right half of the cross section was analyzed under the boundary conditions shown in Eq. (3), which satisfy the conditions shown in Fig. 12.
| (3) |

Distribution of cross-sectional velocity.
The velocities at the entrance and exit of the deformation zone are defined by Eq. (4). These boundary velocities correspond to those of the second pass, where the interstand moment acts as an external moment at the entry plane, and the exit plane is under a free-surface condition after a sufficient drawing length to satisfy the steady-state condition. The cross-sectional velocity at the entrance is assumed to be zero, whereas a rigid but rotational velocity field was allowed at the exit of the deformation zone. This velocity field is valid for analyzing the torsional deformation in the roll bite of the second pass, neglecting the longitudinal rigid rotation of the wire in the roll bite. Here, the rotational velocity (angular velocity) ω is uniform at the exit cross section and is uniformly distributed in this section:13)
| (4-1) |
| (4-2) |
As mentioned before, tilting occurred owing to the lack of moment balance upon a slight disturbance of the roll bite. In a flat pass, the torque arms are sufficiently long for the right and left moments to balance easily. In an oval pass, because the torque arms are short, the moment balance can be easily lost upon even a slight disturbance of the roll bite, as shown in Fig. 13. In the steady-state analysis, the initial tilting angle θs is intentionally fixed in the pre-deformation zone of the second pass, assuming that θs corresponds to the rotation of the wire in the first pass and in the region between the first and second passes. The steady-state plastic deformation and external twisting moment at the entry plane MEnt were calculated under this assumption, as shown in Fig. 14. The likelihood or ease of tilting after the second pass is evaluated using the positive twisting moment MEnt. The total moment acting on the wire MTotal is
| (5) |
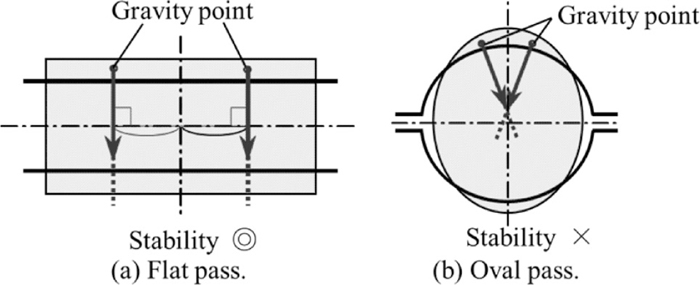
Stability of moment balance in the roll bite in flat and oval passes.
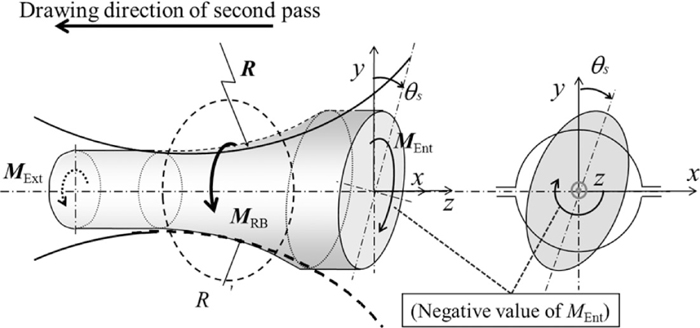
Tilting moment added to wire during drawing.
Figure 15 shows the effects of area reduction ratios of 6% and 10% on the twisting moment MEnt for the analytical conditions shown in Table 3. The moment at the entry plane MEnt is negative and is almost proportional to the tilting angle at the entry θs and the reduction in area. The negative moment at the entry plane MEnt, as illustrated in Fig. 14, promotes twisting deformation; thus, it can be seen from Fig. 15 that an oval-round pass has less ability to suppress twisting deformation than an oval-oval pass. Figure 16 shows the effects of roll-to-wire diameter ratios of D/d = 5, D/d = 12, and D/d = 18 on the twisting moment MEnt of the second pass for the analytical conditions shown in Table 4. Changes in D/d induce changes in the contact area. As the tilting behavior is affected by the geometry of the contact area between the roll and the wire, a clear tendency is observed in the change in the twisting moment MEnt. As D/d increases, MEnt becomes larger and the amount of tilting deformation between passes tends to increase.
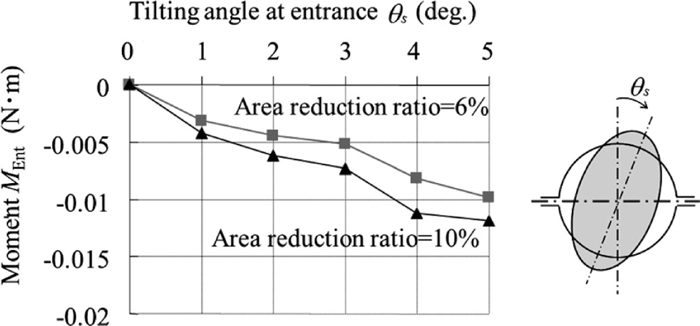
Effect of area reduction ratio on steady-state tilting.
| Pass type | Oval-Round |
|---|---|
| Roll speed (mm/min) | 30 |
| Flow stress (MPa) | 450 (1+ε0.1) |
| Front, Back tension (MPa) | 0, 0 |
| Diameter of wire d (mm) | 3 |
| Diameter of roll D (mm) | 35 |
| L/d | 10 |
| Reduction (%) | 6,10 |
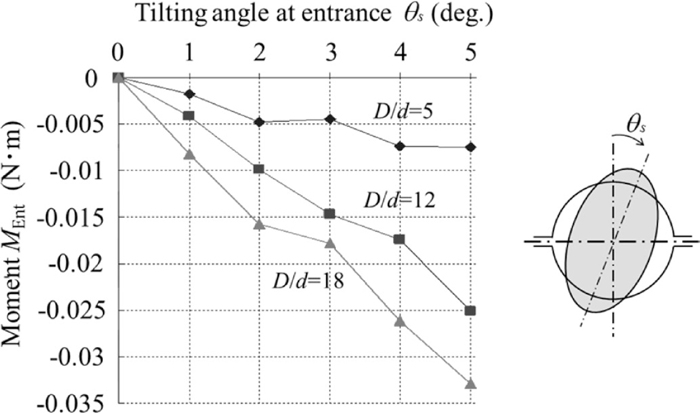
Effect of roll-to-wire diameter ratio on tilting moment.
| Pass type | Oval-Round |
|---|---|
| Roll speed (mm/min) | 30 |
| Flow stress (MPa) | 450 (1+ε 0.1) |
| Front, Back tension (MPa) | 0,0 |
| Diameter of wire d (mm) | 3 |
| Diameter of roll D (mm) | 15, 35, 54 |
| L/d | 30 |
| Reduction (%) | 8 |
Non-steady-state tilting was analyzed using the FEM simulator MSC Marc. A static implicit scheme with the Prandtl-Reuss constitutive equation was used with the updated Lagrange formulation and first-order isoparametric solid elements with 8 nodes. Figure 17 and Table 5 show the boundary conditions and the analytical conditions in the case of forced displacement with a fixed roll position. To reproduce the tilting phenomenon in FE analysis, we intentionally set a small lateral-direction gap a in the second pass, as shown in Fig. 18. The lateral gap a is set to 0.1 mm and the initial wire diameter d is 3 mm throughout the non-steady-state analysis. The roll diameter D is 35 mm. The flow curve is the same as that used in the previous section. Tilting is evaluated using the moment acting from the roll onto the wire, the tilting angle, and the dimensional accuracy of the wire, where the tilting moment acting from the roll onto the wire MRB is calculated directly as the cross product of the distance from the center point and the roll reaction force. The summation of this moment with the external moment at the entry and exit cross sections should be zero as the wire is in the static equilibrium state expressed by Eq. (5).
Conditions for non-steady-state analysis.
| Head of workpiece | (given) |
|---|---|
| Element | 1st-order isoparamtric solid element with 8 nodes |
| Constitutive equation | Prandtl-Reuss |
| Formulation | Update-Lagrange |
| Method | Static implicit method |
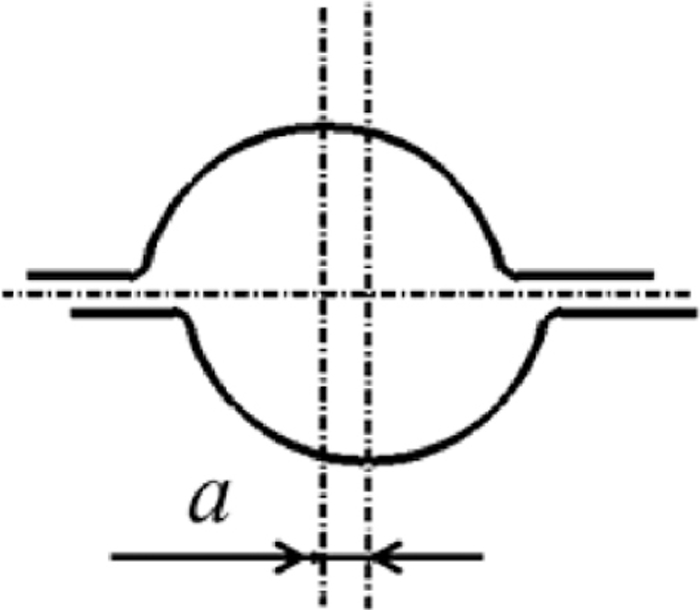
Gap in lateral direction to induce tilting in FEM analysis.
With the aim of confirming the effect of the tilting phenomenon, we vary the distance between the rollers to validate the experimentally obtained Eq. (2) as
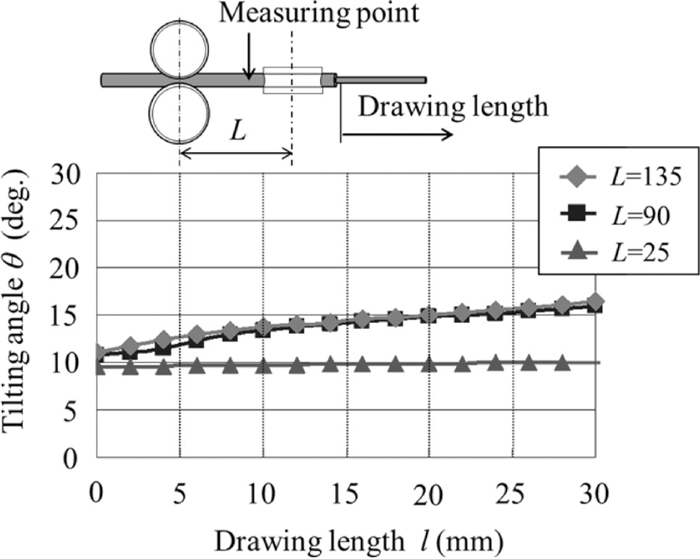
Relationship between drawing length and tilting angle.
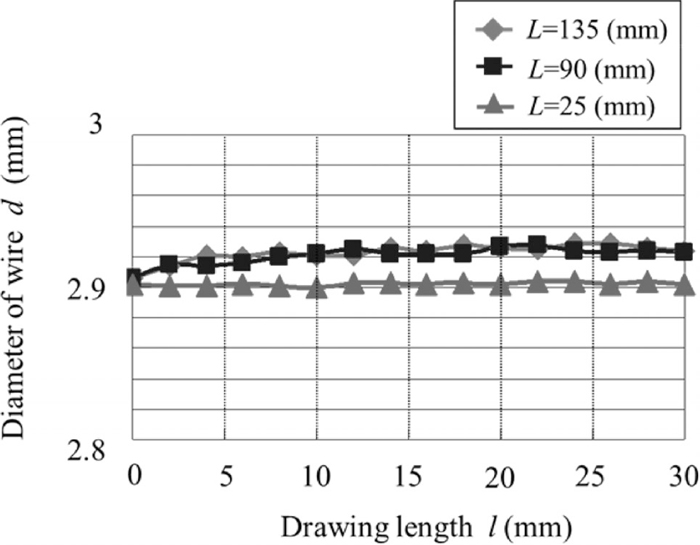
Dimensional accuracy in the case of tilting.
The twisting moments imposed in the roll bite of the first and second passes are shown in Fig. 21, where L = 90 mm and the reductions in the first and second passes Re are 4% and 8%, respectively. The twisting moment imposed on the wire in the first pass M1 was constant because the initial shape of the wire remained circular despite tilting. M1 is about –0.05 N·m, which is about three times as large as the corresponding value obtained by steady-state analysis MEnt, discussed in the previous section. This difference is due to the difference in the rolling conditions used and the obtained tilting angle in both analyses. The twisting moment imposed on the wire in the second pass M2 increased as the tilting angle increased, as illustrated in Fig. 19. As the top of the wire was fully constrained in the non-steady-state analysis, the moment acting on the top of the wire may affect M2, as shown in the moment diagram in Fig. 21. Note that the moment acting on the wire between adjacent rollers was the moment imposed in the first pass, M1 or MEnt in the previous section. With the aim of demonstrating the effect of the moment imposed in the second pass M2 and the gradual change in the final tilting angle θ when the top of the wire is fully constrained, we next investigate the evolution of the final tilting angle θ as a function of M2.
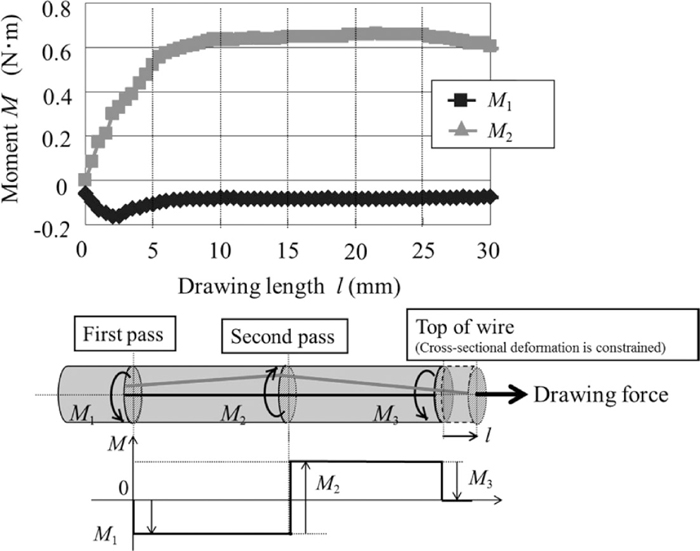
Twisting moment in each pass (top) and overall equilibrium of twisting moment between rolls and top of wire (bottom).
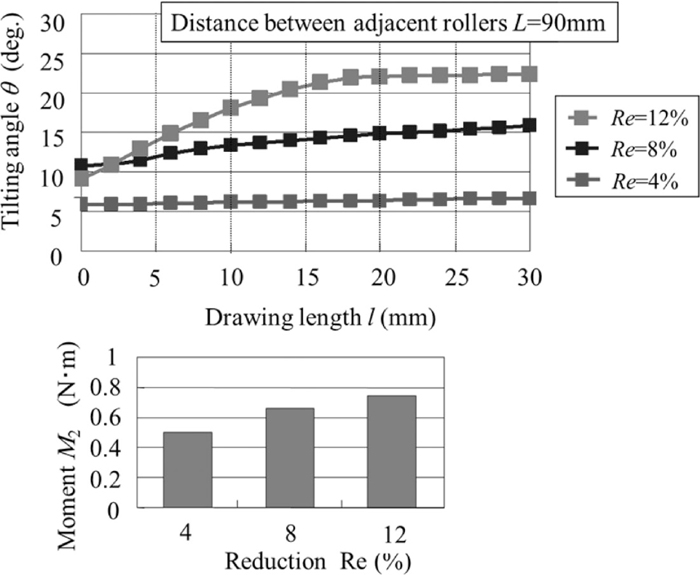
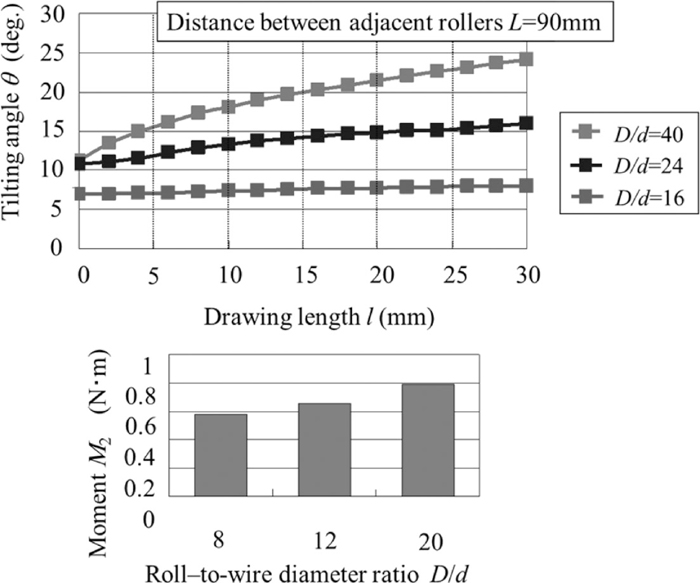
Figure 22 shows the relationship between the drawing length and the tilting angle, and between the area reduction ratio and the tilting moment, where L = 90 mm. As the area reduction ratio decreased, the contact area between the roll and the wire and the tilting moment upon rolling decreased. The area reduction ratio of 4% results in a small tilting angle being maintained and enables the fabrication of a precise wire. Figure 23 shows the relationship between the drawing length l and the final tilting angle θ as a function of the roll-to-wire diameter ratio D/d, where L = 90 mm. As D/d decreased, the contact area between the roll and the wire decreased, and thus the twisting moment decreased. When D/d is below 16, a small tilting angle can be maintained, enabling the sound fabrication of a precise wire.
Effect of area reduction ratio on the evolution of tilting.
Effect of roll-to-wire diameter ratio on the evolution of tilting.
A systematic investigation of the tilting phenomenon of a fine steel wire in roller die drawing was presented in this paper. The results on the deformation characteristics of wire during roller died drawing were discussed by using the normalized values versus wire diameter d, interstand distance L and roll diameter D.
Experiments were conducted using the wire with the diameter of 1 to 4 mm to eliminate the error in the measurement of tilting. Experiments revealed that the relationship between the wire diameter d and the distance between the two pairs of rollers L at the initiation of tilting can be expressed as
Judging from the above experimental and theoretical results, the present construction of compact roller dies is unsatisfactory for drawing fine wires with a diameter d of 500 μm. The basic features of our newly designed roller dies for realizing the sound drawing of wires with diameters less than 500 μm, particularly d = 200 μm, without tilting can be summarized as follows.
(1) The distance between adjacent rollers L should be no more than 8 mm, which is shorter than the conventional distance of 15 mm. This criterion is obtained from the experimentally obtained Eq. (2), where wire diameter d and the distance between two pairs of rollers L at the initiation of tilting can be expressed as
(2) A smaller area reduction ratio of about 4 to 8% is effective for drawing using roller dies. This result was confirmed by the twisting moment MEnt obtained by steady-state FE analysis.
(3) From the steady-state and non-steady-state FE analyses, it was confirmed that a larger roll-to-wire diameter ratio leads to a larger external moment acting on the wire in the second pass. A smaller roll-to-wire diameter ratio below 16 is suitable for the roller die drawing of fine steel wires.