Abstract
The estimation of fine inclusion particles is required in order to clarify its effect on the miniaturization of steel grain. In this study, the stability of ZrO2, Ti2O3, TiAl2O5, Ce2O3, and CeS particles during extraction was examined using acid, halogen–methanol, and nonaqueous electrolytes. ZrO2, Ti2O3, and TiAl2O5 particles hardly dissolved in 4%MS (4 v/v% methylsalicylate–1 w/v% tetramethylammonium chloride–methanol) and 10%AA (10 v/v% acetylacetones–1 w/v% tetramethylammonium chloride–methanol) electrolytes, while Ce2O3 and CeS particles did not dissolve in a 2%TEA–Ba (2 v/v% triethanolamine–1 w/v% tetramethylammonium chloride–methanol containing 0.16–0.24 w/v% Ba) electrolyte during potentiostatic extraction. The O content of the extracted ZrO2, Ti2O3, and Ce2O3 inclusion particles agreed approximately with the difference between analyzed total O content and calculated equilibrium O content of the metal, and the S content of the extracted CeS inclusion particles agreed with the analyzed total S content of the metal. The Ce content of the extracted inclusion particles was in agreement with that calculated using the results of two-dimensional measurements.
1. Introduction
It is well known that nonmetallic inclusion particles in steel compromise the mechanical property and corrosion resistance. Therefore, the removal and modification of these particles have been an important mission in the refining stage of the steelmaking process. The various methods recommended were proposed by the joint research studies1,2) on quantitative analysis of nonmetallic inclusions. The inclusion particles concerned have grown to include complex multi-component systems, which sometimes contain chemically unstable components, after the modification of nonmetallic inclusion particles.3,4,5,6) An extraction method of the inclusion particles in steel, which can disregard the dissolution loss of inclusion particles during chemical treatment, is necessary in order to directly observe the size, morphology and number of inclusion particles and the elemental segregation in each particle.
Among chemical extraction methods, the electrolytic method using a nonaqueous electrolyte such as 4%MS (4 v/v% methylsalicylate–1 w/v% tetramethylammonium chloride–methanol), 2%TEA (2 v/v% triethanolamine–1 w/v% tetramethylammonium chloride (or LiCl)–methanol), or 10%AA (10 v/v% acetylacetones–1 w/v% tetramethylammonium chloride–methanol) was expected to extract nonmetallic inclusion particles from steel with good quantitative reproducibility. However, it should be noted that some kinds of fine inclusion particles are dissolved during the electrolytic extraction process using conventional nonaqueous electrolysis. For this reason, the dissolution of Al2O3,7) TiOx,8) nitrides,9) carbides,10,11) carbonitride,9) and sulfides12) in the electrolytic solution was examined. In an earlier paper,13) we reported that the chemically unstable MgO and MgO·Al2O3 inclusion particles could be extracted by the electrolytic method using a 2%TEA electrolyte dehydrated with barium metal.
On the other hand, since the capacity of conventional electrolytes to dissolve iron is low, the amount of iron dissolved by electrolysis is insufficient; that is, the amount of inclusion particles extracted might not be enough for an analysis of their representative characteristics. In order to obtain many inclusion particles to ensure successful characterization, the dissolution of a large amount of steel is required. Chino et al.14) reported that the iron weight dissolved by 40%MA (40 w/v% maleic anhydride–3 w/v% tetramethylammonium chloride–methanol) was 30 times more than that by conventional electrolytes.
In the present study, the applicability of nonaqueous electrolytes was investigated for the electrolytic extraction of ZrO2, Ti2O3, TiAl2O5, Ce2O3, and CeS inclusion particles from steel. For comparison, the extraction of Al2O3, which is considered chemically stable, was also examined.
2. Experimental
2.1. Dissolution of Particles in Solution
According to SEM observations, the average particle sizes of ZrO2, Ti2O3, CeO2, and Al2O3 reagents (99.9% purity) were 0.064, 0.41, 2.4, and 0.24 μm, respectively. The Ce2O3 reagent was crushed in a mortar to a particle size of 1–6 μm (average size: 2.0 μm). TiAl2O5 powder was prepared by sintering a stoichiometric mixture of TiO2 and Al2O3 reagents at 1873 K for 24 h and by crushing to a particle size of 1–9 μm (average size: 3.1 μm). The formation of the compound TiAl2O5 was confirmed by X-ray diffraction. These powders were kept in a vacuum desiccator.
In the experiments conducted to examine the dissolution of Ti2O3, CeO2, Ce2O3, and Al2O3 in acid, the powders (5 mg) were charged into 20 mL of HCl (1:1) in a glass beaker and heated at around 363 K for 1 to 10 h. After addition of 2 mL of HNO3 (1:1), the beaker was again heated for 10 min. In the case of ZrO2, in order to prevent re-precipitation by hydrolysis of dissolved Zr, the powder (5 mg) was heated in 20 mL of HCl–HNO3–H2O (1:3:4) at around 363 K for 1 to 10 h. The acid was stirred at intervals of 30 min. After an appropriate amount of time, 5 mL of the solution was suction-filtered using a film filter (open pore size: 0.1 μm) and analyzed by inductively coupled plasma-mass spectrometry (ICP-MS) or inductively coupled plasma-atomic emission spectrometry (ICP-AES).
In the experiment to examine the dissolution of powders in halogen–methanol or nonaqueous electrolytes, the powders (5 mg) were charged into either 100 mL of 5 v/v% bromine–methanol (316–333 K in an ultrasonic vibration bath), 14 w/v% iodine–methanol (316–333 K in an ultrasonic vibration bath), or nonaqueous electrolytes (room temperature). The preparation of a nonaqueous electrolyte composed of 2%TEA–Ba was described in a previous paper.13) The electrolyte was stirred at intervals of 30 min. After an appropriate amount of time, 5 mL of the solution was suction-filtered using a PTFE film filter (open pore size: 0.1 μm) and analyzed by ICP-MS or ICP-AES.
2.2. Metal Sample Preparation
1) Fe–Zr alloy
An appropriate amount of an Fe–50 mass% Zr alloy was added to Fe or an Fe–10 mass% Ni alloy melted in a ZrO2–11 mol% CaO crucible under a deoxidized Ar atmosphere at 1873 K. The melt was stirred for 30 s using a ZrO2–11 mol% CaO tube and held at 1873 K for 1 to 2 min. The crucible containing the metal sample was then rapidly quenched in water.
2) Fe–Ti alloy
An appropriate amount of an Fe–50 mass% Ti alloy was added to an Fe–10 mass% Ni alloy (70 g) in an Al2O3 crucible under a deoxidized Ar atmosphere at 1873 K. The melt was then stirred for 20 s using an Al2O3 tube and held at 1873 K for 1 to 2 min. The crucible containing the metal sample was rapidly quenched in water.
3) Fe–Ce alloy
An appropriate amount of pure Ce granules was added to Fe–10 mass% Ni or Fe-0.2 (or 0.1) mass% C–0.02 mass% P alloys (70 g) in an Al2O3 crucible under a deoxidized Ar atmosphere at 1873 K. The melt was then stirred for 20 s using an Al2O3 tube, held at 1873 K for 1 min, and cooled to 1673 K at a cooling rate of 40 K/min. The crucible containing the metal sample was rapidly quenched in water. For a comparison, the crucible containing the metal sample was rapidly quenched in water after holding at 1873 K for 1 min.
In the case of a base alloy (70 g) consisting of Fe–0.2 mass% C–0.02 mass% P–0.008 to 0.02 mass% S, an appropriate amount of an Fe–10 mass% Al alloy was added for pre-deoxidation, and an appropriate amount of pure Ce granules was added to the base-alloy melt in an Al2O3 crucible under a deoxidized Ar atmosphere at 1873 K. The melt was then stirred for 20 s using an Al2O3 tube and held at 1873 K for 1 min. The crucible containing the metal sample was cooled to 1673 K at a cooling rate of 40 K/min, and rapidly quenched in water.
4) Fe–Al alloy
An appropriate amount of an Fe–10 mass% Al alloy was added to pure Fe (70 g) in an Al2O3 crucible under a deoxidized Ar atmosphere at 1873 K. The melt was then stirred for 20 s using an Al2O3 tube, held at 1873 K for 2 min, and cooled to 1673 K at a cooling rate of 40 K/min. The crucible containing the metal sample was rapidly quenched in water.
5) Fe–Mg–Al alloy
An appropriate amount of an Fe–10 mass% Al alloy and a Ni-10 mass% Mg alloy was added to pure Fe (70 g) in a MgO crucible under a deoxidized Ar atmosphere at 1873 K. The melt was then stirred for 20 s using an Al2O3 tube, held at 1873 K for 2 min. The crucible containing the metal sample was rapidly quenched in water.
2.3. Extraction and Estimation of Inclusion Particles
Although the extraction procedure of inclusion particles from the metal sample was previously used in another study,13) the mixed acid used for the extraction from Fe deoxidized by Zr and Ti was HCl–HNO3–H2O (1:3:4) and HCl–H2SO4–H2O (4:1:5), respectively, to prevent re-precipitation by the hydrolysis of dissolved Zr and Ti.
The procedures of observation, quantitative analysis of extracted inclusion particles and that of soluble elements in metal were also described in the previous paper,13) along with that of observation of inclusion particles on the cross section of the metal sample.
The total O content of the metal was determined by inert gas fusion-infrared absorptiometry.15) The total S content of the metal was determined by O2 gas fusion-infrared absorptiometry.
3. Results and Discussion
3.1. Stability of ZrO2 Particles
It was reported that only ZrO2 particles were extracted from steel by treating a steel sample sequentially with HCl, HF and aqua regia16) or H2SO4, HF and HNO3.17) Inclusion particles such as ZrC, ZrN, zirconium sulfide, and ZrO2 were extracted by dissolving the steel matrix with cold HNO3.18,19) During decomposition of the extracted ZrC by a mixed acid of (H2O2 + HF) and (HNO3 + HF), 12–23% of ZrO2 was dissolved in 1 h.19) It was considered that ZrC and ZrS2 dissolved, but ZrN and ZrO2 did not dissolve during the extraction with iodine–methanol.18,19) Quantitative studies on ZrO2 dissolution loss using the previously suggested extraction methods have been insufficient.
In this study, the variation in the amount of dissolved ZrO2 reagent powder (5 mg) in solution was examined using a HCl–HNO3–H2O (1:3:4) mixed acid, iodine–methanol, and bromine–methanol. The results are shown in Fig. 1. The dissolution of ZrO2 powder was clearly seen in the mixed acid, while it was small in both kinds of halogen–methanol.

Citric acid is known as an organic compound that forms a stable, soluble, complex ion with Zr ion. A citric acid-based neutral electrolyte (30 w/v% citric acid–15 w/v% sodium citrate–1.2 w/v% KBr aqueous solution) was used for the extraction of Zr-based inclusions from steel.19) However, it might be suggested that since Zr ions are prone to hydrolysis, the use of aqueous electrolytes should be prevented, even if citric acid is present in high concentrations. The time dependence of the dissolution of ZrO2 reagent powder in 4%MS, 2%TEA, 10%AA, and 40%MA, which are nonaqueous organic electrolytes, are also shown in Fig. 1. It can be seen that the amount of dissolved ZrO2 reagent was small in these electrolytes. Since there was a possibility that pitting could form on the steel surface during electrolysis with 2%TEA,9) the use of 4%MS, 10%AA, and 40%MA was preferred.
Because of the difference in morphology, size, and chemical stability between a reagent and actual inclusion particles, the extraction conditions obtained using a reagent or synthesized compounds were believed to be inapplicable to the actual extraction from metal.20,21) The amount of Al2O3 dissolved in acid was varied depending on the Al2O3 crystal structure.22) Therefore, the applicability of the ZrO2 extraction methods should be examined using an Fe sample deoxidized by an Fe–Zr alloy in a deoxidized Ar atmosphere at 1873 K.
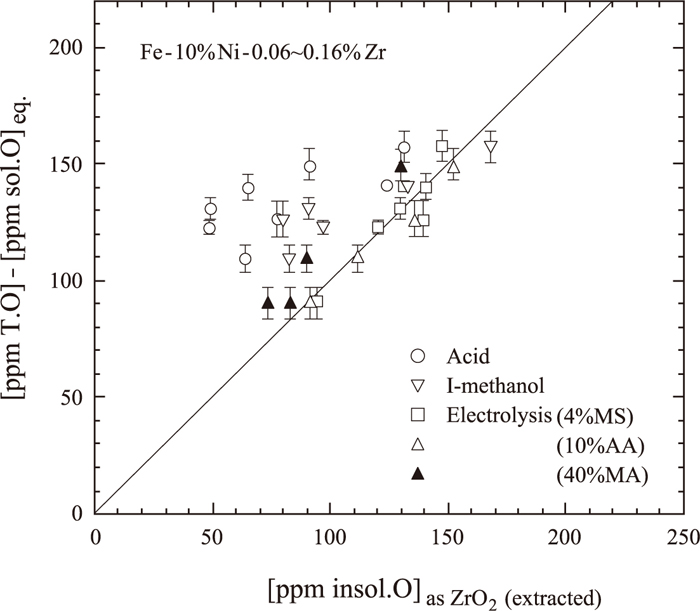
ZrO2 inclusion particles in Fe–10 mass% Ni–0.06 to 0.16 mass% Zr alloys were extracted by a HCl–HNO3–H2O (1:3:4) mixed acid, iodine–methanol, or the potentiostatic extraction method using 4%MS, 10%AA, or 40%MA. The concentration of oxygen present as ZrO2 inclusion particles was calculated from the insoluble Zr content, [insol.Zr], obtained by each extraction method. On the other hand, it was possible to evaluate the oxygen content of ZrO2 inclusion particles by subtracting the equilibrium oxygen content, [sol.O]eq., which was calculated by the equilibrium constant K1 of Eq. (1) and the respective interaction parameters,23) from the total oxygen content determined by inert gas fusion-infrared absorptiometry:
|
ZrO
2
(s) =
Zr
_
+ 2
O
_
log
K
1
=-9.83 (at 1
873 K)
| (1) 23) |
where
i denotes the element
i dissolved in iron and its standard state is 1 mass%. The oxygen content present as ZrO
2 calculated from [insol.Zr] was plotted against those from the total oxygen content and [sol.O]
eq. in
Fig. 2. The results of the electrolytic method using the 4%MS and 10%AA electrolytes lie on the 1:1 line, while those using the 40%MA electrolyte deviated slightly from the 1:1 line, suggesting that the electrolytic method using 4%MS and 10%AA electrolytes were effective for the extraction of ZrO
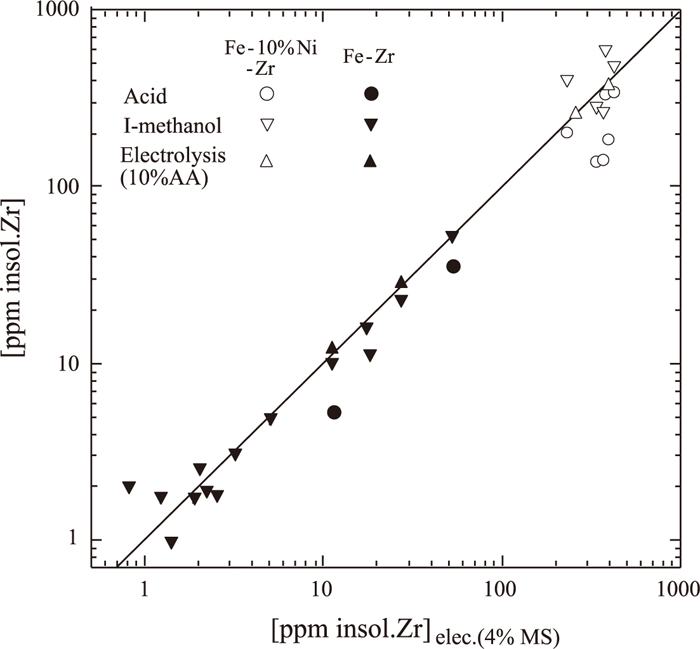
2 inclusion particles. The experimental data points obtained with iodine–methanol might be considered to lie on the 1:1 line, although they were scattered. In contrast, the data points for the mixed acid were positioned away from the 1:1 line. For Fe–0.0004 to 0.6 mass% Zr and Fe–10 mass% Ni–0.06 to 0.16 mass% Zr alloys, the values of [insol.Zr] obtained with the mixed acid, iodine–methanol and the electrolysis using 10%AA were compared with those by the electrolysis using 4%MS in
Fig. 3. The comparison showed that the iodine–methanol method could be applied to the extraction of ZrO
2 inclusion particles; the experimental findings showed that [insol.Zr] obtained by this method corresponded well to those obtained by electrolysis.
3.2. Stability of Ti2O3 Particles
The Ti content in the Fe–10 mass% Ni alloy premelted in this study was 0.13–0.21 mass%. In this Ti concentration range, according to the previous findings using X-ray diffraction, Ti2O3,20,24) Ti3O5,25,26,27) and TiO228) were identified to be inclusions, and the coexistence of Ti2O3 and TiO or Ti2O3 and Ti3O5 was also reported.29) When the relationships between the Ti content and oxygen activity were obtained by the electromotive-force method using a solid electrolyte, Ti2O330) and Ti3O531) were each shown as an equilibrium phase. From the thermodynamic calculation using standard free energies32) for the formation of TiO, Ti2O3, Ti3O5, Ti4O7, and TiO2, the free energies for the dissolution of Ti(s) and O2 into liquid iron,33) and the respective interaction parameters,33) Ti2O3 and Ti3O5 were shown to be the most stable titanium oxide phases at 1873 K in the Ti concentration range of 0.13–0.21 and 0.0003–0.13 mass%, respectively.
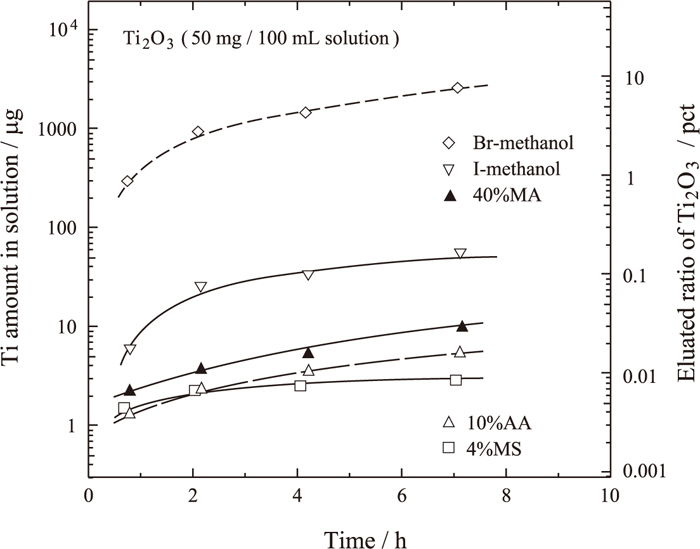
Kawamura et al.20) reported that the synthesized Ti2O3 (7 mg) dissolved completely in hot HCl or hot H2SO4 solution after 20 min, but remained undissolved in iodine–methanol and bromine–methanol at 70°C for 20 min. However, a period of 20 minutes is too short to dissolve an considerable amount of iron sample. In order to clarify the stability of Ti2O3 in the solution, the dissolution of fine Ti2O3 powder, whose average grain size is 0.41 μm, was examined in halogen–methanol (316–333 K in ultrasonic vibration bath), 4%MS, 10%AA, and 40%MA. The variation in the amount of Ti dissolved from fine Ti2O3 powder in these solutions with time is shown in Fig. 4. Ti2O3 powder was found to be stable in iodine–methanol, and is expected to be stable in bromine–methanol only for a short time. Since salicylic acid can form a stable complex ion with Ti ion,34) 4%MS is considered to be suitable as a nonaqueous electrolyte. The amount of dissolved Ti2O3 particles in both 4%MS and 10%AA and 40%MA was small enough to be deemed negligible, as shown in Fig. 4.
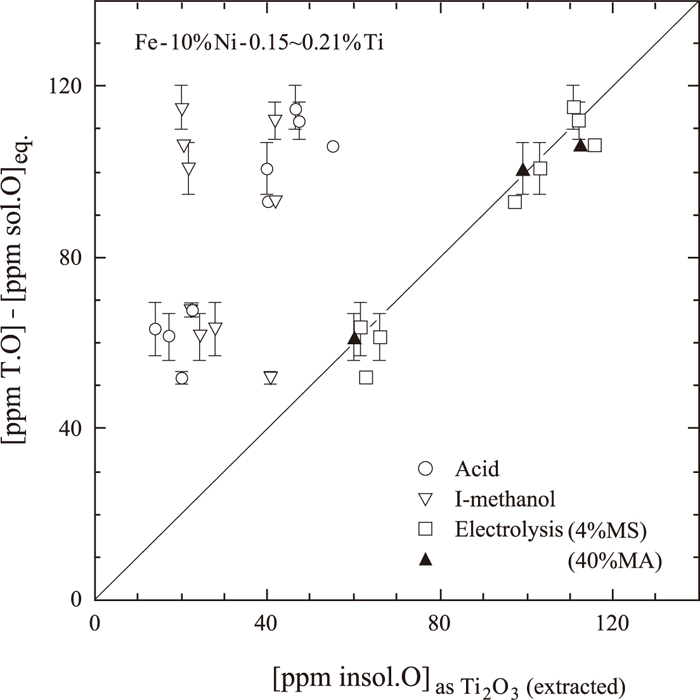
The applicability of the Ti2O3 extraction methods was examined using Fe and Fe–10 mass% Ni samples deoxidized by an Fe–Ti alloy in a deoxidized Ar atmosphere at 1873 K. The oxygen content in the inclusion particles obtained by electrolytic extraction with 4%MS and 40%MA are plotted against those obtained by subtracting the equilibrium oxygen content, which was thermodynamically evaluated by using ΔG° for the reaction in Eq. (2) and interaction parameters33) from the analyzed total oxygen content in Fig. 5:
|
Ti
2
O
3
(s)=2
Ti
_
+3
O
_
Δ
G
2
°
=1 078 000-351.2 T
[J/mol]
| (2) 32,33) |
The validity of potentiostatic electrolysis was obvious because the results obtained by electrolytic extraction using 4%MS and 40%MA agreed well with the thermodynamically calculated values. However, the results obtained using the HCl–H2SO4–H2O (4:1:5) solution and iodine–methanol deviated from the calculated values because of the dissolution of inclusion particles.
3.3. Stability of TiAl2O5 Particles
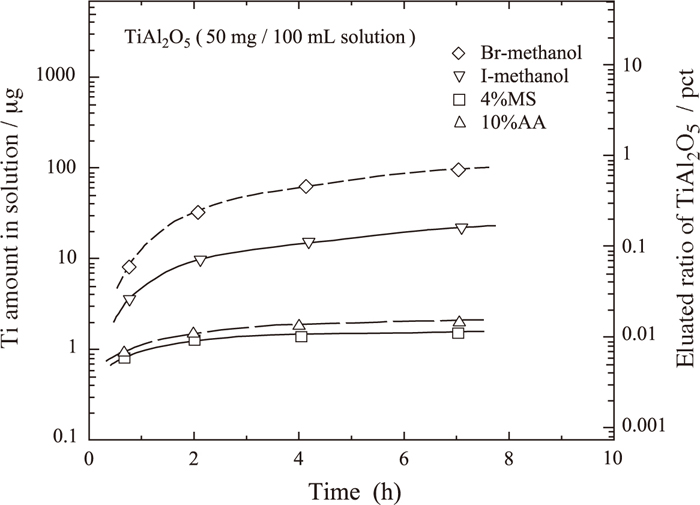
It was previously reported that the fine Al2O3 reagent was stable in halogen–methanol and nonaqueous electrolytes such as 2%TEA, 4%MS, and 10%AA.7) The TiAl2O5 phase, which is a compound of TiO2 and Al2O3, was observed in the limited concentration ranges of Al and Ti in liquid iron.35) The dissolution of synthesized TiAl2O5 fine powder with an average grain size of 3.1 μm was examined in halogen–methanol (316–333 K in ultrasonic vibration bath), 4%MS, and 10%AA. Figure 6 shows the variation of Ti content in these solutions with time. The TiAl2O5 powder was found to be stable in both halogen–methanol and nonaqueous electrolytes, as is the case for Al2O3.
The extraction of TiAl2O5 from an Fe–Al–Ti alloy was not carried out in this study. When inclusion particles were extracted from Fe–0.11 mass% Al and Fe-0.01 mass% Mg-0.05 mass% Al alloys using the 40%MA electrolyte, the suction filtration took a long time owing to the formation of gel in the electrolyte, and the Al2O3 inclusion content was higher than those using the 2%TEA, 2%TEA-0.16 mass% Ba and 10%AA electrolytes, as listed in Table 1. It is suggested that the precipitation of the gel proceeded in the 40%MA electrolyte after the reaction between the Al ions, dissolved from the metal matrix containing a large amount of soluble Al, and the maleic acid. Therefore, it should be noted that the 40%MA electrolyte could not be used for the extraction of Al2O3 and TiAl2O5 from an iron sample with high Al content.
Table 1. Contents of inclusion particles extracted from Fe–Al and Fe–Mg–Al alloys.
| Metal | Electrolyte | Insol.Al
(ppm) | Insol.Mg
(ppm) |
|---|
| Fe-0.11 mass% Al | 2%TEA | 42, 46 | — |
| 10%AA | 40, 46 | — |
| 40%MA | 86, 109 | — |
Fe-0.01 mass% Mg
-0.05 mass% Al | 2%TEA | 27, 29 | 49, 50 |
2%TEA
-0.16 mass% Ba | 28, 29 | 51, 55 |
| 10%AA | 27, 28 | 45, 48 |
| 40%MA | 76, 83, 86 | 37, 41, 43 |
The dissolution behaviors of Ce oxide and Ce sulfide in a nonaqueous electrolyte were examined in the same manner as other oxides; Ce2O3 and CeO2 reagents were used as the Ce oxides while Ce2S3 was used as the Ce sulfide.
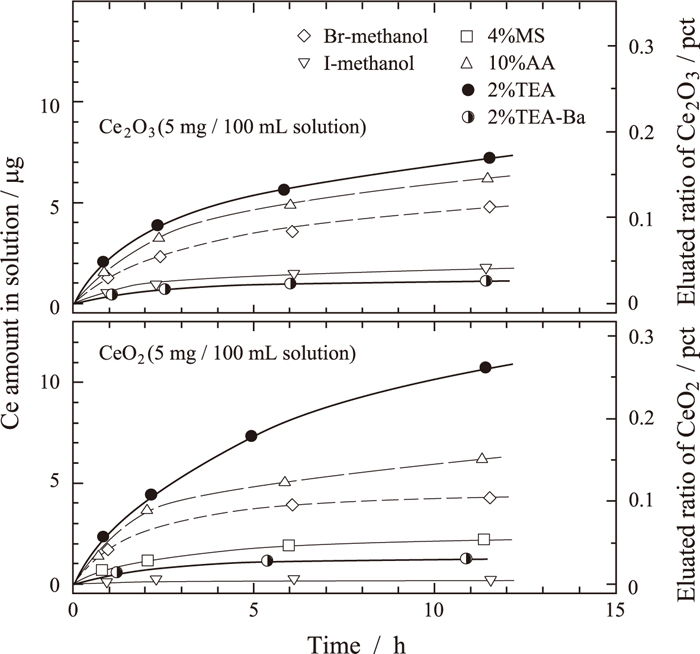
Figure 7 shows the results for dissolution behaviors of Ce2O3 and CeO2 reagents in 2%TEA, 4%MS, 10%AA, and 2%TEA–0.16 w/v% Ba. These two Ce oxides barely dissolved in 4%MS and 2%TEA–Ba. For comparison, the results of 14 w/v% iodine–methanol and 5 v/v% bromine–methanol are also given in Fig. 8. The dissolution of Ce oxides was negligibly small in 14 w/v% iodine–methanol. However, since it was reported that Ce–iodine precipitates under oxidizing conditions,36) there was a possibility that the Ce ions, which dissolved from the metal matrix reacted with iodine and precipitated as Ce–iodine. Although the extraction operation using iodine–methanol is usually performed under an inert gas atmosphere, iodine–methanol might be unsuitable for the extraction of inclusion particles from metal containing Ce owing to safety concerns.
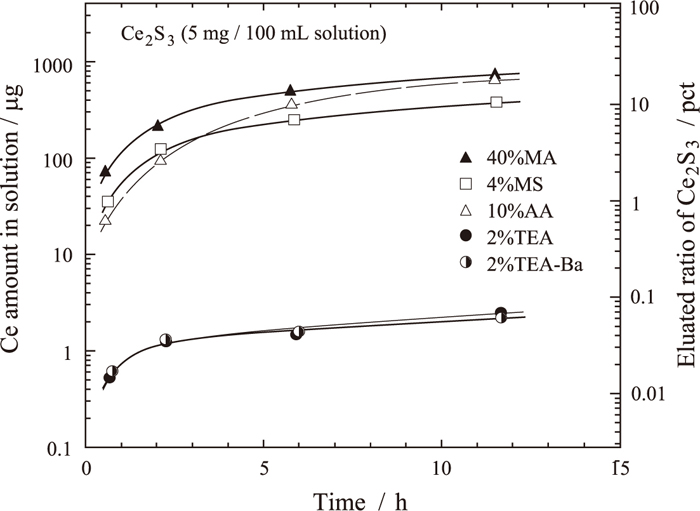
The subcommittee on nonmetallic inclusion analysis at the Iron and Steel Institute of Japan had reported that 4%MS is suitable for the electrolytic extraction of RE-sulfide.12) The variation in Ce content dissolved from the Ce2S3 reagent for various nonaqueous electrolytes is shown in Fig. 8. The amounts of dissolved Ce2S3 in 2%TEA and 2%TEA–0.16 w/v% Ba were smaller compared with that in 4%MS.
The potentiostatic electrolytic extraction of Ce2O3 from Fe–0.2 mass% C–0.02 mass% P–0.02 to 0.06 mass% Ce and that of CeS from Fe–0.2 mass% C–0.02 mass% P–0.3 mass% Al–0.008 to 0.01 mass% S–0.03 to 0.05 mass% Ce alloys were carried out using 2%TEA–0.16 w/v% Ba and 4%MS. The electrolytic potential was –100 to –150 mV, and the current density was 15 to 35 mA/cm2. The Ce concentrations in inclusions obtained by electrolytic extraction and acid treatment are listed in Table 2. It is seen that Ce2O3 and CeS dissolved drastically in HCl–HNO3–H2O (3:1:4) mixed acid.
Table 2. Comparison of contents of Ce
2O
3 or CeS inclusion particles extracted by various methods.
[T.Ce]
(ppm) | Insol.Ce (ppm) |
|---|
| Electrolysis | Acid |
|---|
| 2%TEA-0.16 mass% Ba | 4%MS |
|---|
| Fe-0.2 mass% C-0.02 mass% P |
| 236 | 210, 219 | 160, 167 | 1.3 |
| 402 | 372, 388 | 284 | < 0.1 |
| 592 | 555, 567 | 394 | 1.4 |
| Fe-0.2 mass% C-0.02 mass% P-0.3 mass% Al-0.008–0.01 mass% S |
| 298 | 301, 313 | 215, 230 | < 0.1 |
| 443 | 405 | 281 | < 0.1 |
| 499 | 450, 485 | 370, 423 | 2.3 |
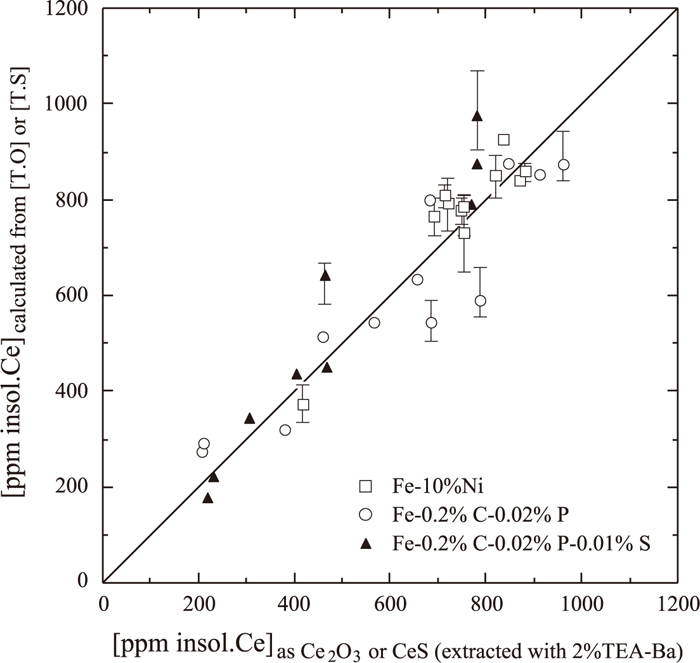
By electron-probe microanalysis, the inclusion particles on polished Fe-10 mass% Ni-0.04 to 0.09 mass% Ce and Fe–0.2 mass% C–0.02 mass% P–0.02 to 0.10 mass% Ce alloys were identified as nearly pure Ce2O3, and those on polished Fe–0.2 mass% C–0.02 mass% P–0.3 mass% Al–0.008 to 0.02 mass% S–0.02 to 0.08 mass% Ce alloys were identified as nearly pure CeS. These alloys were obtained by quenching at 1673 K after cooling from 1873 K at a cooling rate of 40 K/min. Therefore, the Ce concentrations in Ce2O3 and CeS inclusion particles were calculated from the analyzed total O content and total S content, respectively. The results are shown in Fig. 9. These calculated values correspond approximately to the Ce concentrations of inclusions obtained by electrolytic extraction with 2%TEA-0.16 to 0.42 w/v% Ba electrolyte. We believe that O and S precipitated as Ce2O3 and CeS during cooling of the metal from a molten state at 1873 K to 1673 K, and a part of Ce2O3 and CeS dissolved in the 4%MS electrolyte during electrolytic extraction.
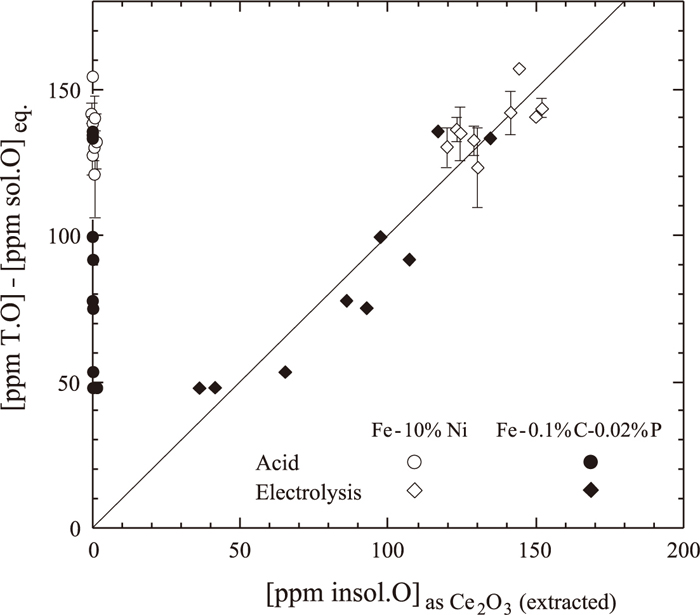
On the other hand, since the Fe–10 mass% Ni–0.08 to 0.19 mass% Ce and Fe-0.1 mass% C-0.02 mass% P-0.02 to 0.11 mass% Ce alloys were obtained by quenching in water after the deoxidation with pure Ce granules at 1873 K, soluble O was expected to remain in these alloys. Therefore, the Ce content present as Ce2O3 inclusion particles was calculated from the O content obtained by subtracting the equilibrium O concentration from the analyzed total O content. The equilibrium O concentration was thermodynamically evaluated by using log K3 for the reaction (3)37) and interaction parameters:33,37)
|
Ce
2
O
3
(s) = 2
Ce
_
+ 3
O
_
log
K
3
= -16.86 (at 1
873 K)
| (3) 37) |
shows the relationship between the calculated Ce content and the Ce content in inclusion particles extracted by the electrolytic method; the Ce concentrations in inclusion particles extracted with 2%TEA–Ba electrolyte coincide substantially with the calculated values.
The inclusion amount was evaluated from the size and number of inclusion particles on cross sections of Fe-0.1 mass% C-0.02 mass% P-0.02 to 0.11 mass% Ce and Fe–0.2 mass% C–0.02 mass% P–0.3 mass% Al–0.008 to 0.02 mass% S–0.02 to 0.08 mass% Ce alloys. The calculation method was described in a previous paper.13) The densities of Ce2O3 and CeS were 6.86 g/cm3 and 5.88 g/cm3, respectively. The calculated Ce content is plotted against the Ce content in extracted inclusion particles in Fig. 11. In the case of electrolytic extraction with 2%TEA–0.25 to 0.42 w/v% Ba electrolytes, both calculated and extracted values were in good agreement with each other, which might be explained by the homogeneous suspension of Ce2O3 and CeS in the molten alloy because the densities of Ce2O3 and CeS were close to that of molten iron (6.9 g/cm3). Meanwhile, the extracted Ce concentrations in inclusion particles extracted by 4%MS were consistent with both the calculated values and the values by 2%TEA–0.37 w/v% Ba in the low Ce-concentration range, but were lower than the calculated values in the higher Ce-concentration range. This experimental finding means that Ce2O3 and CeS inclusion particles might dissolve in 4%MS.

4. Conclusion
Extraction methods using acid and halogen–methanol as well as electrolytic extraction employing various nonaqueous electrolytes were examined to separate nonmetallic inclusion particles from a steel sample without dissolution loss. For ZrO2, Ti2O3, and TiAl2O5 inclusion particles, electrolytic extraction using 4%MS and 10%AA electrolytes was successful, while the 2%TEA–Ba electrolyte was favorable for potentiostatic extraction of Ce2O3 and CeS particles. It was concluded that judicious choice of the electrolyte based on the inclusion composition is essential.
References
- 1) S. Maekawa: Tetsu-to-Hagané, 55 (1969), 381.
- 2) Y. Kawai, Y. Ishibashi, J. Chino and T. Kutsumi: Recent Development of Research on Nonmetallic Inclusions in Steel, ed. by Research Committee on Nonmetallic Inclusions in Steel, Japan Society for the Promotion of Science, Tokyo, (1994), 206.
- 3) J. Takamura and S. Mizoguchi: The 6th Int. Iron and Steel Cong., ISIJ, Tokyo, (1990), 591.
- 4) M. Wako, T. Sawai and S. Mizoguchi: Tetsu-to-Hagané, 78 (1992), 1697.
- 5) S. Ogibayashi: Shinnittetsu-giho, 32 (1994), No. 351, 64.
- 6) A. Kojima, A. Kiyose, R. Uemori, M. Minagawa, M. Hoshino, T. Nakashima, K. Ishida and H. Yasui: Shinnittetsu-giho, 42 (2004), No. 380, 2.
- 7) R. Inoue, T. Ariyama and H. Suito: Asia Steel Int. Conf. 2009, The Korean Institute of Metals and Materials, Seoul, (2009), S11-16, 1.
- 8) R. Inoue, K. Kiyokawa, K. Tomoda, S. Ueda and T. Ariyama: 8th Int. Workshop on Progress in Analytical Chemistry & Materials Characterization in the Steel and Metals Industries (CETAS 2011), Centre for Research in Metallurgy, Belgium, (2011), 118.
- 9) Y. Yoshida, Y. Funahashi, K. I and Y. Kamino: Kawatetsu-giho, 12 (1980), 653.
- 10) F. Kurosawa, I. Taguchi and R. Matsumoto: J. Jpn. Inst. Met., 44 (1980), 1288.
- 11) K. Narita: Tetsu-to-Hagané, 66 (1980), 2119.
- 12) K. Narita: Tetsu-to-Hagané, 73 (1987), 67.
- 13) R. Inoue, T. Ariyama and H. Suito: ISIJ Int., 51 (2011), 2050.
- 14) A. Chino, S. Kinoshiro and T. Ono: Tetsu-to-Hagané, 93 (2007), 105.
- 15) R. Inoue and H. Suito: Mater. Trans. JIM, 31 (1991), 1164.
- 16) A. Adachi and K. Mizukawa: Tetsu-to-Hagané, 48 (1962), 683.
- 17) K. Narita, A. Tomita and S. Nachi: Tetsu-to-Hagané, 48 (1962), 1526.
- 18) K. Kawamura, S. Watanabe and S. Suzuki: Tetsu-to-Hagané, 58 (1972), 2067.
- 19) K. Kawamura, S. Watanabe, M. Amano, T. Uchida and S. Suzuki: Tetsu-to-Hagané, 61 (1975), 2650.
- 20) K. Kawamura, S. Watanabe and T. Uchida: Tetsu-to-Hagané, 57 (1971), 94.
- 21) S. Wakamatsu: Tetsu-to-Hagané, 57 (1971), 656.
- 22) F. Honda and K. Hirokawa: Tetsu-to-Hagané, 60 (1974), 2013.
- 23) R. Inoue, T. Ariyama and H. Suito: ISIJ Int., 48 (2008), 1175.
- 24) H. Straube, G. Kuhnelt and E. Plockinger: Arch. Eisenhüttenwes., 32 (1967), 607.
- 25) H. Chino, Y. Nakamura, E. Tsunetomi and K. Segawa: Tetsu-to-Hagané, 52 (1966), 959.
- 26) Y. Kojima, M. Inouye and J. Ohi: Arch. Eisenhüttenwes., 40 (1969), 667.
- 27) A. M. Smellie and H. B. Bell: Can. Metall. Q., 11 (1972), 351.
- 28) R. L. Hadley and G. Derge: Trans. Met. Soc. AIME, 203 (1955), 55.
- 29) E. L. Evans and H. A. Sloman: J. Iron Steel Inst., 174 (1953), 318.
- 30) D. Janke and W. A. Fischer: Arch. Eisenhüttenwes., 47 (1976), 195.
- 31) V. I. Yavoyskiy, L. P. Vladimirov, V. P. Luzgin, N. M. Kopitsa and E. B. Teplitskiy: Russ. Metall., (1974) No. 2, 10.
- 32) I. Barin: Thermochemical Data of Pure Substances, VCH, Weinheim, (1989).
- 33) G. K. Sigworth and J. F. Elliott: Met. Sci., 8 (1974), 298.
- 34) K. Ueno: Chelatometric Titration, Nankodo, Tokyo, (1972).
- 35) W. Choi, H. Matsuura and F. Tsukihashi: ISIJ Int., 51 (2011), 1951.
- 36) R. C. Vickery: Analytical Chemistry of the Rare Earths, Pergamon Press, New York, (1961), 35.
- 37) R. Inoue and H. Suito: CAMP-ISIJ, 10 (1997), 215.