Regular Article
Particle Coagulation in Molten Metal Based on Three-Dimensional Analysis of Cluster by X-Ray Micro-Computer Tomography (CT)
2013 年 53 巻 11 号 p. 1958-1967
詳細
2013 年 53 巻 11 号 p. 1958-1967
Particle coagulation plays a key role in steel refining process to remove inclusions. Many research works focus on the behaviors of particle coagulation. To reveal its mechanism water model experiments have been performed by some researchers including the authors’ group. In this paper, experiments of particle coagulation were carried out with molten Al including SiC particles in a mechanically agitated crucible with two baffles. Particle coagulation and formation of clusters were observed on the microscopy images of as-polished samples. Three-dimensional (3D) analysis of the clusters in solidified Al was implemented by X-ray micro CT available at SPring-8. The methods to distinguish clusters on two-dimensional (2D) cross-sectional images were discussed, which were established in the previous works by the present authors’ group. The characteristics of the 3D SiC clusters and their 2D cross-sections were analyzed. The statistical ranges of the parameters for 2D clusters were used as criterions to distinguish the clusters on 2D microscopy images from the as-polished samples. The kinetics of SiC particle coagulation was studied by the measured cluster number density and size using our program to distinguish cluster in 2D cross-sectional images according to 3D information (DC-2D-3D). The calculated and experimental results of the SiC particle coagulation in molten Al agree well with each other.
The requirements to control inclusions in steel products become more and more serious with the increasing customer demands on the performance of steel products. A main goal of metallurgists is to remove undesirable inclusions to the maximum extent and control the nature and distribution of the remainders. In steelmaking process, fine inclusion particles in molten steel coagulate each other in turbulent flow and grow up into clusters, which are composed of more than one inclusion particle adhering together. The sizes of these clusters vary from several microns to hundreds microns, which are very harmful to the properties of the final steel products. Therefore, to improve the cleanness of metal products, it is necessary to understand the mechanism of inclusion coagulation in molten metal in details.
Many studies have been performed focusing on the mechanism of particle coagulation in liquid system to estimate the coagulation process precisely.1,2,3,4,5,6,7,8,9) Smoluchowski1) established an ideal particle coagulation model in a shear flow that assumes straight streamline in which particles collide with each other through the velocity gradient. Camp and Stein2) extended Smoluchowski’s model by describing the average velocity gradient in turbulence using the square root of the ratio of the energy dissipation rate to the kinematic viscosity in turbulent flow, (ε/ν)1/2. Saffman and Turner3) developed a more rigorous model based on a statistical turbulence model, but the interaction force between the particles was not considered. Higashitani et al.4,5) improved the Saffman–Turner model by introducing a coagulation coefficient that depends on London–van der Waals force and the viscous resistance force relating to the energy dissipation rate in the bulk of liquid. They performed particle turbulent coagulation experiments in an agitated vessel containing an aqueous solution and latex particles. The Coulter Counter based on electrical sensing zone method was applied to obtain the particle concentration and size distribution during the particle coagulation process in water system. Taniguchi et al.6) determined the coagulation coefficient by applying Higashitani’s model and obtained a good agreement between the experimental results and numerical calculation. Nakaoka et al.7,8) modified the population balance equation (PBE) and developed a particle-size-grouping (PSG) method with complete conservation in total particle volume. The coagulation experiments using SiC particles with broad size distribution were performed and showed good agreement with the numerical calculation model. Arai et al.9) revised Nakaoka’s PBE and established a numerical model including particle coagulation and bubble flotation by water model experiments made in an agitated vessel with various types of particles. The numerical calculation showed a perfect agreement with the experimental results.
The first step to understand the mechanisms of inclusion coagulation in molten metal is to detect the inclusion clusters in metal system. However, the technique for obtaining actual size and number of inclusion clusters in metal system has not been developed. In most particle coagulation models, the clusters formed by particle coagulation are assumed to be spheres; and spherical volumetric equivalent diameter was used for the cluster size because of the experimental difficulties to get the three-dimensional (3D) information of these clusters. The 3D analysis of the inclusion cluster structure will provide significant information for understanding the inclusion cluster behaviors in liquid metal system. Therefore, it is necessary to quantitatively analyze and describe the 3D structure of non-metallic particle clusters, especially in metal system.
Fractal dimension10,11) was introduced from mathematics to describe particle cluster structure, which is one of the most important parameters to show the relationship between the volume and the size in length of a cluster. Some research works have been performed to derive the cluster structure using fractal dimension.12,13,14,15) Tozawa et al.12) reported the fractal dimension of alumina clusters as 1.8 estimated from the two-dimensional (2D) cross-section measurement of the alumina clusters extracted from the steel sample at actual continuous casting process. Doo et al.13) investigated the 2D and 3D fractal dimensions of the alumina cluster extracted from steel according to the projected area of the cluster calculated by Forrest method.14) It reported the 2D fractal dimension was in the range of 1.80–1.95 with average of 1.88. And the 3D fractal dimension was estimated following a relation between 2D and 3D fractal dimensions of clusters reported by Lee and Kramer,15) and fell into a range of 1.88–2.07 with average of 1.98. However, it is very difficult to find the experimental reports about 3D cluster structure analysis, especially the non-metallic particle clusters in metal system because of its opaque and high melting point. The present authors’ group16,17) analyzed the 3D structure TiB2 clusters formed in turbulent flow of molten Al using X-ray Micro-CT, which is a non-destructive, 3D characterization method.18,19,20,21) A model was established by the present authors’ group17) to distinguish 2D clusters on the cross-sectional images, which was validated using the 3D information of clusters obtained by X-ray micro-CT. In this study, the particle coagulation experiments were carried out using SiC particles in molten Al. X-ray micro-CT available at SPring-8 in Japan was introduced to obtain the 3D information of particles and clusters in solid Al samples. Morphological analysis of the particles and clusters in solid metal was applied to the particle coagulation process in molten Al.
The collision frequency Nij between particles in group i and j is given as follows in terms of particle concentrations, ni and nj in aqueous solution:
| (1) |
The population balance equation (PBE) for the coagulated particle composed of k-pieces of primary particles was expressed in Eq. (2) derived by Smoluchowski,1) which was also investigated by Nakaoka7) and Arai et al.9)
| (2) |
The collision frequency of particle i and j in a unit volume of liquid media was given by Saffman and Turner3)
| (3) |
Higashitani et al.4,5) improved the Saffman–Turner model by introducing a coagulation coefficient that depends on London–van der Waals forces and the viscous resistance force relating to the energy dissipation rate in the bulk of liquid. The agreement between the experimental results and improved coagulation model was greatly improved comparing with Saffman–Turner model. The coagulation coefficient α is shown in Eq. (4).
| (4) |
The effective Hamaker constant of particle 1 in medium 3 can be derived from the individual Hamaker constant of particle A11 and medium A33 in vacuum by Eq. (5).22,23)
| (5) |
The dimensionless form of PBE for the turbulence coagulation according to Eqs. (2) and (3) can be expressed as:7,24)
| (6) |
SiC particles were used for coagulation experiments in molten Al. The particles were added in the molten Al by the use of commercial Al–SiC Metal Matrix Composite (MMC) obtained from Hydro-Aluminum Inc. of Norway. Figure 1 shows the optical microscopy image of the Al–SiC MMC, in which the dark area is SiC particles.

Microscopic image of Al–SiC MMC.
The SiC particles included in the composite were extracted by HCl and NaOH solution alternately in order to get the particle size distribution (PSD). Figure 2 shows the SEM image of SiC particles extracted from the Al–SiC MMC. The shape of these SiC particles are irregular with edges and corners. Figure 3 shows the PSD of SiC measured by the Coulter Counter-3, in which two peaks are seen at P1 and P2. To calculate the coagulation of a monodispersed particle system, the primary particle radius a1 included in the coagulation coefficient α in Higashitani4,5) coagulation model was taken as the particle radius of the monodispersed particle itself. However, the SiC particles used for particle coagulation in molten Al have a broad size distribution with two peaks (P1, P2) in Fig. 3. To simplify the calculation, the average of primary particle radius is given by a1 = (P1+P2)/4.
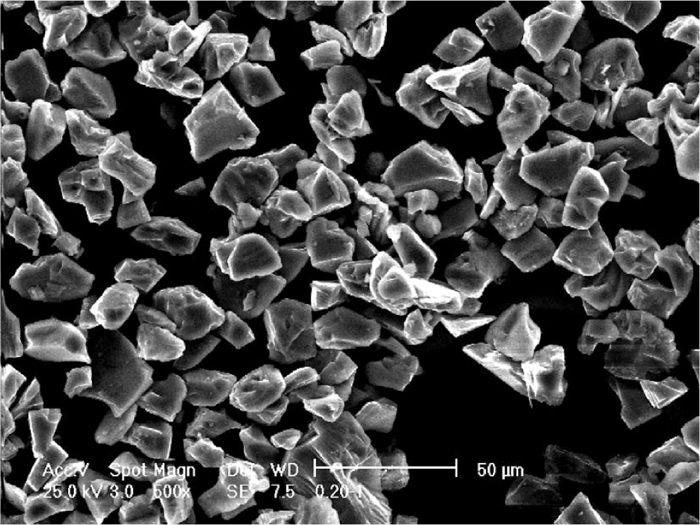
SiC particle extracted from Al–SiC MMC.

Size distribution of SiC particles in Al–SiC MMC.
Figure 4 shows the schematic of the experimental apparatus. Aluminum was melted and kept at 1073 K in a crucible (31%Al2O3–69%SiO2). SiC particles were added into molten Al by the use of Al–SiC MMC because of the difficulties in the addition of SiC powder directly into the molten metal. Ultrasonic was imposed to the melt with the aim to break SiC clusters and disperse them in molten Al. Ultrasonic imposition was continued during 30 min at 1073 K. And then, an alumina-coated paddle-type stainless steel impeller was introduced to agitate and generate turbulent flow in the crucible with two baffle plates. Samples were sucked from the molten Al by a silica tube of 3.6 mm ID during the agitation with suitable time interval and quenched in water to prevent clusters from being pushed or broken by solidification front of Al. The solidified sample was cut and put into resin according to the alignment shown in Fig. 5. Table 1 lists the experimental conditions of SiC particle coagulation. Because of the effect of ultrasonic to disperse SiC particles in molten Al was not steady, only the three experiment with well dispersed particles at t=0 s were selected from a series of experiments for the further analysis. A series of microscopy images were taken from the 2D cross-section of the metal samples including SiC particles, and then were stitched into a whole cross-section of the sample by Microsoft Image Composite Editor which is an advanced free panoramic image stitcher.
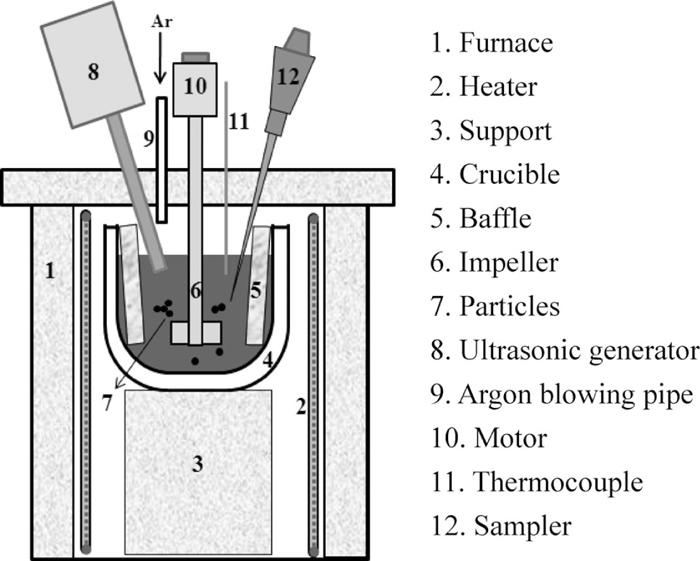
Schematic of experimental apparatus.

Alignment of samples.
| Experiments | SiC Vol% | Agitation Speed (rpm) |
|---|---|---|
| A | 2.32 | 300 |
| B | 2.03 | 300 |
| C | 2.03 | 400 |
Figure 6 shows the change in cluster area fraction in 2D cross-sections of samples with time in Exp. B. It is almost kept constant at all the sampling time during the experiment. The slight fluctuations might come from the noise of blurred particle edge in the optical microscopy images. Therefore, the sedimentation or adhesion to the walls of SiC particles could be ignored during coagulation experiment.

Change in cluster area fraction in cross-section with time (Exp. B).
To confirm the reliability of the analysis, the homogeneity of the particles in the crucible was investigated. Table 2 shows the average particle area fractions of the whole cross-sections of samples taken from different position (Exp. C, 2.03% vol SiC) in the crucible. The distribution of the particles is almost homogenous corresponding to the volume fraction of SiC particles in the molten Al. The area fraction of the cross-sectional images is a little bit smaller than the volume fraction (2.03%); this may be due to the ignorance of particles with equivalent circular diameter smaller than 2 μm in cross-sectional images.
| Position | Area fraction (%) |
|---|---|
| Bottom | 1.89 |
| Wall | 1.98 |
| Baffle | 1.94 |
Figure 7 shows the cross-sectional microscopy images of the samples taken at different time in the Exp. B. Each cross-sectional image was composed of about 80 pieces of microscopy images on a cross-section of the polished sample. It clearly shows that the particles in the image of t=0 s are dispersed even though a few clusters exist, and discrete particles coagulate each other to form clusters during agitation. However, it is difficult to distinguish the clusters from isolated particles on the 2D cross-sectional images.
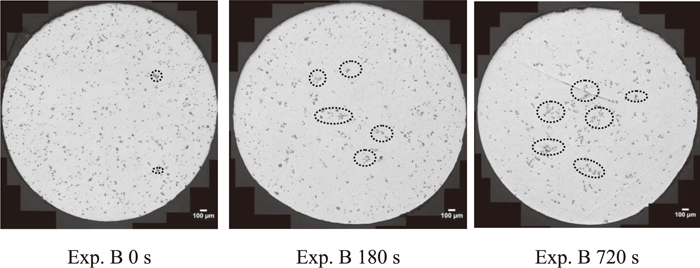
Particle coagulation process in cross-sectional microscopy images.
The first step to obtain the number and size of particles and clusters on the 2D cross-sectional images is to distinguish the clusters which appear as gathered but isolated particles. A program named DC-2D was developed based on a public domain software of ImageJ to distinguish clusters in 2D cross-sectional images, in which each pair of particles were considered to belong to one cluster when the inter-surface distance between the two particles is less than the Feret’s diameter of the smaller particle. The inter-surface distance between the two particles is given by25,26)
| (7) |
Figure 8 shows examples of distinguished clusters in a cross-sectional image processed by the program of DC-2D. Figure 8(a) shows the raw microscopy image of the as-polished sample. Particles smaller than 2 μm in terms of equivalent circular diameter are removed as noise. Figure 8(b) shows the image processed by the program of DC-2D, in which the 2D clusters are distinguished; and Fig. 8(c) shows a closeup of a distinguished 2D cluster A in Fig. 8(b), which seems to correspond to the human cognition. However, the cluster B in Fig. 8(b) show in Fig. 8(d) seems not to be one cluster. It is undeterminable to distinguish clusters only by the 2D information.

Examples of distinguished clusters by program of DC-2D. (a) Microscopy image, (b) Results of program DC-2D, (c) Example of distinguished Cluster A, (d) Example of distinguished Cluster B.
To improve the reliability of the program to distinguish 2D clusters, the present authors’ group17) developed a new program named DC-2D-3D by introducing various criterions base on the 3D information of TiB2 clusters obtained by X-ray micro-CT. Table 3 defines a series of parameters to describe the characteristics of 2D clusters. Thousands 3D clusters and their 2D cross-sections were extracted from X-ray micro-CT images. The critical ranges of the 2D parameters were obtained from the statistical analysis, which were applied in the program of DC-2D-3D as criterions to distinguish 2D clusters.
| Type | Parameters | Definition |
|---|---|---|
| Size | dx | Feret’s diameter in coordinate X |
| dy | Feret’s diameter in coordinate Y | |
| dave | Average diameter, dave = (dx +dy) / 2 | |
| dmax | Maximum diameter | |
| Srec | Area of enfolding rectangle, Srec = dx dy | |
| S | Area of 2D cross-section | |
| Peri | Perimeter of the cross-section | |
| Structure | Ns,2D | Number of particles in all cross-section slices |
| Df,ave,2D | Fractal dimension by dave,
| |
| Df,max,2D | Fractal dimension by dmax,
| |
| Cir | Circularity of the cross-section,
| |
| Sols | Area solidity, Sols = S/Srec |
The recognition of particles in metal by X-ray micro-CT is depended on the X-ray absorption rate by the material, which is affected by the atomic number of elements containing in the materials. Therefore, it is difficult to recognize SiC particle in Al, because the atomic number of Si and C in SiC are close to Al, which is a big obstacle to obtain the 3D information of Al–SiC system. Phase retrieval27,28) based on the Fast Fourier Transform (FFT) method29) was applied to improve the quality of the X-ray micro-CT images for Al–SiC system, which considers the different material properties relating to X-ray transmission rate. Figure 9 shows the 8-bit X-ray micro-CT images of Al-SiC system. The SiC particles in Al-matrix can be distinguished in Fig. 9(a) from phase retrieval method. And these particles in Fig. 9(b) become clear by increasing the contrast of the image.

8-bit X-ray micro-CT images of Al-SiC sample, (a) 8-bit image by phase retrieval, (b) Image processed by ImageJ.
Thousands of SiC particles and clusters are collected from X-ray micro-CT images of the samples taken from experiments and then divided into groups according to the maximum particle numbers on all the cross-sectional slices of each cluster, Ns,max,3D. Figure 10 gives an example of SiC cluster and its cross-sectional slices. Figure 10(a) is an example of 3D reconstructed cluster. Figure 10(b) shows the cross-sections of the 3D cluster; and particles on a cross-section are isolated with each other. Table 4 defines parameters to describe the 3D size and structure of particles and clusters.

Example of SiC cluster and its cross-sectional slices. (a) 3D cluster, (b) 2D cluster slices.
| Type | Parameters | Definition |
|---|---|---|
| Size | dx, | Feret’s diameter in coordinate X |
| dy, | Feret’s diameter in coordinate Y | |
| dz | Feret’s diameter in coordinate Z | |
| dave | Average diameter, dave = (dx +dy+dz) / 3 | |
| dmax | Maximum diameter, dmax = maximum (dx, dy, dz) | |
| Vbox | Volume of enfolding cube, Vbox = dx dy dz | |
| V | Volume of the cluster | |
| Sur | Surface area of the cluster | |
| Structure | Ns,max,3D | Maximum particle number in the cross-sections of a cluster |
| Df,ave,3D | Fractal dimension by dave,
| |
| Df,max,3D | Fractal dimension by dmax,
| |
| Sv | Volumetric specific surface, Sv = Sur / V | |
| Solv | Volumetric solidity, Solv = V/Vbox |
Figure 11 shows the Finite-sample distribution (FSD)30) of the parameters for particle or cluster structure according to Ns,max,3D. There are not apparent changes in Df,ave,3D and Df,max,3D with the increase in Ns,max,3D. While the Sv and Solv decrease with particle number, which indicate that the clusters becomes looser with the particle number increase. The characteristics of SiC cluster are similar to that of TiB2.17) It can be concluded roughly that the mode value of fractal dimension for SiC clusters in molten Al is around 2.7 (Df,max), which is selected as the representative value of fractal dimension of SiC clusters.

Changes in parameters for 3D structure of SiC clusters with Ns,max,3D.
A great number of 2D slices of the SiC clusters were obtained from the micro-CT images and the characteristics of these 2D clusters are described by a series of parameters (See Table 3). The 2D clusters were divided into the several types according to the particle size and number in each 2D cluster, which are shown in Table 5. The critical ranges of the parameters describing the characteristics of 2D clusters in each type were obtained by statistical analysis, which were used to distinguish them in 2D cross-sectional images. The 2D particles with circular equivalent diameters larger than 10 μm were recognized as large particles and others were small ones. Figure 12 shows the characteristics of 2D SiC clusters according to these types, which is very similar to that of TiB2 clusters.17) The ranges of these parameters were used to distinguish the SiC cluster in 2D cross-sectional images.
| Particle Number | Type | Size | Particle Number | Type | Size | Particle Number | Type | Size |
|---|---|---|---|---|---|---|---|---|
| 1 | 1-A | 0L+1S | 3 | 3-C | 2L+1S | n (n≥5, x>5) | 5-A | 0L+nS |
| 1-B | 1L+0S | 3-D | 3L+0S | 5-B | 1L+(n-1)S | |||
| 2 | 2-A | 0L+2S | 4 | 4-A | 0L+4S | 5-C | 2L+(n-2)S | |
| 2-B | 1L+1S | 4-B | 1L+3S | 5-D | 3L+(n-3)S | |||
| 2-B | 2L+0S | 4-C | 2L+2S | 5-E | 4L+(n-4)S | |||
| 3 | 3-A | 0L+3S | 4-D | 3L+1S | 5-F | 5L+(n-5)S | ||
| 3-B | 1L+2S | 4-E | 4L+0S | 5-G | xL+(n-x)S |

Characteristics of parameters to describe structure of 2D clusters.
The number of particles and clusters per unit area, N2D, is expressed as:
| (8) |
Santalo equation31) was introduced to estimate the particles and clusters number per unit volume (m3), N3D, which is given by
| (9) |
| (10) |
| (11) |
| (12) |
Figure 13 compares the distinguished clusters on the actual 2D cross-sectional microscopy images by the program of DC-2D and DC-2D-3D. Figures 13(a) to 13(f) are the results of DC-2D program according to the criterion of distance between particles only. While Figs. 13(a)* to 13(f)* are obtained by the program of DC-2D-3D using the criterions base on the 3D information, which showed more reasonable results of distinguished clusters in 2D cross-sectional images. The particles shown in Figs. 13(a) and 13(f) seem to be several single particles or small clusters other than a single cluster, which are well distinguished as in Figs. 13(a)* and 13(f)*. Figures 13(b) to 13(e) may consisted by several large clusters that are mis-connected as only one; they were distinguished as separated clusters in Figs. 13(b)* to 13(e)* that seem much more reasonable. Figure 13 also shows that the sizes of clusters are around several tens microns, which are limited by the breakup of huge clusters in turbulent flow.

Comparison between programs to distinguish clusters.
Figure 14 compares the particle and cluster size distribution (Exp. A, t=0 s) obtained by the programs of DC-2D and DC-2D-3D. The number fraction of particles in the larger size region by program of DC-2D-3D decreases while that in the smaller particle region increases. The 2D cluster size according to the program of DC-2D-3D is smaller than that from program of DC-2D; thus the number is increasing. The initial particle and cluster size distribution obtained by the program of DC-2D might be larger than that of the actual one.

Comparison of initial particle and cluster size distribution obtained by programs of DC-2D and DC-2D-3D (Exp. A, t=0 s).
Figure 15 compares the change in cluster number density obtained by the 2D distinguishing programs of DC-2D and DC-2D-3D for Exp. A. The N3D (DC-2D-3D) is much larger than N3D (DC-2D), particularly for the samples taken before t=180 s. It indicates that the particles distinguished as one large cluster in program of DC-2D are distinguished as more than one smaller cluster in the program of DC-2D-3D. Figure 16 compares the kinetics of SiC particle coagulation in molten Al (Exp. A) obtained by the program of DC-2D and DC-2D-3D. The fractal dimension of 2.7 for SiC cluster was applied in the calculation model. The calculated particle coagulation curve according to the program of DC-2D-3D (Cal. A*) shifts to be slower comparing with that based on the program of DC-2D (Cal. A). The shift is mainly attributed to the difference of particle and cluster size distribution at t=0 s, which was input to Eq. (6) for the calculation. Furthermore, the difference in the fractal dimension in the calculation model also contributes to the shift of the calculated result. While the experimental results of particle coagulation according to program of DC-2D-3D shifts to be faster comparing to that from program of DC-2D. It is due to the N0,3D measured from the program of DC-2D-3D increases very much (see Fig. 15), and thus

Change in cluster number density obtained 2D distinguishing program (Exp. A).

Kinetics of SiC particle coagulation in molten Al (Exp. A).
Figure 17 plots the kinetics of SiC particle coagulation for all the experiments according to the program of DC-2D-3D. It shows good agreements between the calculated and experimental results. However, at the end of the agitation, the experimental results deviate from the calculated ones. This is because the clusters grow up and become easier to be broken when their size exceed the Kolmogoroff ’s micro scale eddy in turbulent flow. The micro scale eddy size in molten Al agitated with 300 rpm is 43 μm; while it is 37 μm for 400 rpm agitation, which is smaller than that of 300 rpm agitation. A few huge clusters might also be found in 2D optical microscopy images; these huge and tight clusters were from the Al-SiC MMCs used for adding particles into coagulation experiments. The higher agitation speed (400 rpm) in Exp. C results in the more deviation from calculated results than Exp. A and Exp. B (300 rpm) after agitation of a certain time. Because of the deviation caused by the breakup of large cluster, only the experiments with well dispersed particles at t=0 s, as selected three experiments in this research, could be used for the analysis of particle coagulation. In spite of these deviations, the calculated coagulation curves in the present study agree well with experimental results for all the experiments.

Kinetics of SiC particle coagulation in molten Al.
In this paper, particle coagulation experiments were carried out with SiC particles and molten Al in a mechanically agitated crucible with two baffles. The cluster formation was qualitatively observed on the microscopy images of 2D as-polished samples. The methods to distinguish 2D clusters on the cross-sectional images were discussed. The kinetics of SiC particle coagulation was developed by the 2D cluster distinguishing method based on the 3D information of clusters obtained by X-ray micro-CT.
(1) The quantity balance of particles in the experiments was verified by measuring the change in particle area fraction on the cross-sectional images of samples taken during agitation. It was almost kept constant for each experiment, which indicates the conservation of total amount of SiC particles in the coagulation experiments.
(2) The homogeneity of the SiC particles in molten Al under turbulent flow was confirmed by investigating the area fraction of particles on the cross-sectional microscopy images of the as-polished samples taken from various positions in the crucible during agitation. The area fraction of particles does not change so much on the microscopy images from the samples near the bottom, wall, and baffles.
(3) The method to distinguish 2D clusters based on the consideration of the distance between each pair of particles seems inadequate because there are a lot of undetermined clusters. The 3D information of cluster is required to distinguish the clusters.
(4) The phase retrieval based on FFT was used to obtain high quality X-ray micro-CT images for Al-SiC system. The characteristics of the 3D cluster and their cross-sectional slices were described by various parameters. The fractal dimension (Df,max,3D) of SiC clusters was roughly considered as 2.7 which was selected as the representative value applied to the particle coagulation model.
(5) The program of DC-2D-3D including criterions obtained from actual 3D information of clusters was applied to the Al–SiC system on microscopy images. The clusters were more reasonably distinguished than that by the program of DC-2D that only based on the distance between particles.
(6) The kinetics of SiC particle coagulation in molten Al was calculated through the use of the program of DC-2D-3D to distinguish clusters. The calculated results agree well with the experimental results in spite of the deviations after a certain time’s agitation, which is attributed to the breakup of large cluster.
This work was partly supported by Grant-in-Aid for Scientific Research (A) (No.22246097) which is provided by Japan Society for the Promotion of Science (JSPS). Project number and beam line of SPring-8 are 2012B1448 and BL20XU. The authors wish to express thanks to Mr. Oka, the undergraduate student in Tohoku University, for his help to perform the experiments, and Dr. A. Takeuchi and Dr. Y. Suzuki for their help during the operation of the X-ray micro CT at SPring-8, and Dr. T. Iizuka of Isuzu Advanced Engineering Center Ltd. for the help to disperse particle in the Al–7wt.%Si alloy.