Regular Article
Influence of Texture and Trace Element Composition on Hematite to Wüstite Reduction Rates of Fine Iron ore Fragments
2013 年 53 巻 12 号 p. 2018-2027
詳細
2013 年 53 巻 12 号 p. 2018-2027
Reduction of ore is the key process in its conversion to the metal form, and the reducibility of ore fragments is therefore a crucial parameter in smelting operations. At constant oxygen fugacity, reducibility is controlled by the texture of the ore fragments, which determines the transport length from reduction front to fragment interface, and the chemistry of the ore fragments, which impacts element mobility within the crystal lattice. Their relative contribution was studied here for iron-ore reduction by combining compositional analyses and thermo-gravitational reduction experiments on individual ore fragments. Results indicate that despite large, and ore-characteristic differences in chemistry, ore-fragment composition has a negligible impact on reducibility. The large variations among bulk ores; e.g. the start of hematite-to-magnetite reduction varies by over 300°C, is therefore attributable to ore-texture effects. Porous, goethite-dominated ores show the highest reducibility, followed by fractured and layered fragments and finally dense ore fragments.
Iron-making invariably contains one or more reduction processes in which the iron ore is reduced to the iron metal form. Reduction can be achieved by a variety of mechanisms from electrolysis to pyrometallurgy to chemical reduction, but of these, blast furnace pyrometallurgical reduction is by far the most commonly used. In blast furnace operation, the (processed) iron ore is mixed with a solid reductor, most commonly coke, and an assortment of fluxing and controlling agents. Oxidation of the reductor produces heat and strongly reducing conditions, which convert the ore material to liquid metal that is subsequently extracted.
A crucial factor in blast furnace operation is the reduction rate of the ore material. Reduction rate obviously controls the throughput of the furnace, but the associated mineralogical and textural changes also impact the strength of the blast furnace load, evolution of its permeability, thermal profile, etc., and the ore reduction rate is therefore a key parameter in any model of blast furnace operation. This is equally true in pre-processing of iron ore to make sinter and pellets. Indeed, the ore reduction characteristics present a sensitive tuning parameter for pre-processing and blast furnace operations.
Macro-scale reduction kinetics are controlled by the rate at which the crystal lattice rearranges itself on the micro-scale into the new, reduced mineral structure. This rearrangement results in a higher metal to anion ratio and must therefore be accompanied by release of the anion. In most cases, the ore minerals are oxides and oxygen is extracted at the ore-fragment interface by a reducing gas, solid or melt.e.g.1) In conventional blast furnace operation the dominant reductor is CO(g) and reduction progresses stepwise from hematite to magnetite, to wüstite, and finally to molten pig iron.2) As the reduction front propagates inward, oxygen has to be transported from this front to the interface, or metal atoms towards the reduction front.1) Rather than movement of individual atoms from reduction front to fragment interface, or vice versa, this transport operates as a Newtonian swing, cascading the change through the crystal lattice.
The rate at which the crystal lattice rearranges itself depends on two main factors. Firstly, it depends on the surface to volume ratio of the ore fragments, which determines the transport length for atom movement. Surface to volume ratio is controlled by the fragment size and texture of the ore fragments, with the latter determining the surface area for a given fragment size. Porous and fractured ores expose a larger surface area per unit volume to their reducing environment than dense ores, resulting in a smaller transport length and hence faster reduction.e.g.3) Secondly, it depends on the rate of atom movement in the crystal lattice. For magnetite and hematite, the presence and concentration of lattice defects essentially controls atom mobility.4,5) Such defects are inherent in the lattice structure, but their concentration is enhanced by the presence of impurity elements and/or residual strain. Whereas stress produces defects by physical disruption of the lattice, impurity elements result in defects owing to their mismatch in radius and/or charge compared to the ideal element on a given lattice site. At elevated concentrations, impurity elements impact a mineral’s thermodynamic stability, and this can result in stabilisation or destabilisation of the ore mineral relative to its reduction reaction product, and hence enhanced or reduced reaction rates.6,7)
Whereas the impact of ore-fragment texture on reduction kinetics is well established,e.g.1,3) the impact of impurities is less constrained. A complicating factor in assessing the importance of impurity elements on reduction rates is that the impact of different impurity elements is additive, but each element’s contribution needs to be scaled to the magnitude of its lattice disruption. In this study, we use Lattice-Strain Theory8,9) to derive such a scaled parameter, and use this parameter to explore and quantify the importance of impurity content on reduction rates of iron-oxide ores relative to the impact of ore-fragment texture. We focus on the hematite to magnetite and magnetite to wüstite transitions.
Ore-fragment reduction rates were evaluated by thermo-gravimetry (TGA) at constant heating rate in a reducing CO–CO2–N2 gas atmosphere. Both bulk ores and separated compositional fractions of these bulk ores were analysed. By subtracting the compositional effects from the reduction rates observed for bulk ores, texture effects are obtained. This approach was selected over analysing textural separates, as classifying and quantifying textures between the different ores is inherently difficult. Analysis of such data would require a clear textural ranking that would be valid for all ores, which is difficult to establish.
Iron-oxide ore fragments from nine deposits were studied, covering the majority of iron ore types and settings (Table 1). Kiruna (Kir) and Malmberget (Malm) are two magmatic, magnetite-dominated ores from the Scandinavian Shield in Sweden. These ores are thought to have formed at high temperature by the segregation of an immiscible oxide melt.10,11) Guelbs (Gue) is a magnetite-dominated metamorphosed Banded Iron Formation (BIF) from the Guelb Moghrein area of Mauritania.12) Yandi (Yan) is a goethite-dominated ore from the Hamersley province of Western Australia. It formed as a channel deposit, redepositing iron derived from Hamersley Group BIFs.13,14) Mont Wright (MtW) and Carol Lake (CaLa) are hematite-dominated banded iron deposits in the Labrador Trough on either side of the Quebec-Labrador border in northeast Canada.15) Sishen (Sis) is a hematite BIF on the western margin of the Kaapvaal craton in South Africa.16) The two remaining ores are hematite-dominated banded iron deposits from Brazil, in the Carajas (Car) and Quadrilátero Ferrífero (QFer) ore provinces, respectively.17,18,19,20)
| Ore | Dominant ore minerals | Accessory phases | Texture | Ore type | Ore origin |
|---|---|---|---|---|---|
| Mont Wright | hematite, magnetite | Qtz | coarse | metamorphosed BIF | Labrador Trough, Canada |
| Guelbs | magnetite | Qtz, Hbl, Di, Tlc, Cum, Ilm | coarse | metamorphosed BIF | Mauritania |
| Malmberget | magnetite | Ilm, Pg | coarse | magmatic | Northern Sweden |
| Kiruna | magnetite | Qtz, Bt, Tlc, Crd, Kaol | coarse | magmatic | Northern Sweden |
| Carajas | hematite, goethite | Mag, Qtz, Gibb | layered | BIF | Carajas region, Brazil |
| Yandi | goethite, hematite | Qtz, Kaol | porous | channel iron deposit | Hamersley area, Australia |
| Carol Lake | hematite, magnetite | Goeth, Qtz, Ep | coarse | metamorphosed BIF | Labrador Trough, Canada |
| Sishen | hematite | Qtz, Bt, Kaol | layered | BIF | Transvaal basin, South Africa |
| Quad. Ferr. | hematite, goethite | Mag, Qtz, Gibb | layered | BIF | Quad. Ferr. region, Brazil |
Mineral abbreviations: Qtz - quartz; Bt - biotite; Crd - cordierite; Kaol - kaolinite; Ilm - ilmanite; Pg - pargasite; Hbl - hornblende; Di - diopside; Tlc - talc; Cum - cummingtonite; Mag - magnetite; Gibb - gibbsite; Goeth - goethite; Ep - epidote. BIF - Banded Iron Formation.
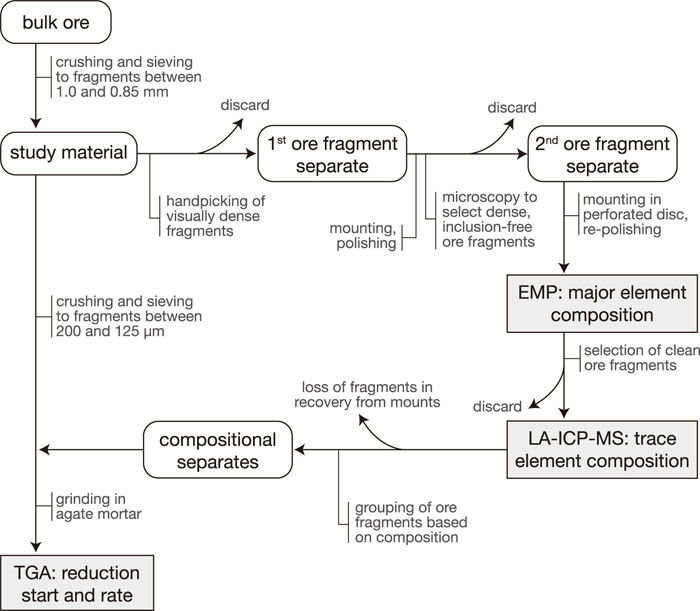
Bulk ores from the nine deposits were crushed and subsequently sieved to a fraction between 1.0-0.85 mm (see the Appendix for a flow diagram of the complete method used). From these separates the visually densest ore fragments were selected to minimise texture effects. Approximately 40 of these selected fragments per ore were mounted in resin, polished and visually inspected by reflected light microscopy. The resin was subsequently dissolved and only those fragments with low porosity and negligible inclusion of gangue minerals were moved to a perforated disc, one fragment per perforation. This mounting ensured that individual fragments could be tracked and taken from the mount for further analysis. The samples were re-polished and checked for heterogeneity, zoning or inclusions using reflected light and back-scattered electron imaging.
The final selected ore fragments in these perforated discs were analysed for their major element composition using wavelength dispersive spectroscopy on the JEOL 8900 Superprobe at McGill University. Operating conditions were 15 kV acceleration voltage, 40 nA beam current and 2 μm defocussed beam, analysing for Si, Ti, Al, Cr, Fe, Mn, Mg, Ca and V with phi-rho-z matrix correction applied to analyses. Elements were standardised on the natural mineral standards diopside (Si, Ca), rutile (Ti), chromite (Al, Cr, Mg), hematite (Fe), spessartine (Mn) and vanadinite (V), counting 20 s on peak and 10 s on both lower and upper background. These analyses allow for identification (and subsequent discarding) of fragments containing micro-inclusions of gangue minerals (e.g. silicate inclusions would be evident from elevated SiO2 contents), and provide the required internal reference data for quantification of laser-ablation ICP-MS data (see below).
Trace element composition was determined by laser-ablation ICP-MS at McGill University on the same fragments as those analysed by EMP, using a New-Wave 213 nm Nd-YAG laser coupled to a Perkin-Elmer Sciex Elan 6100 quadrupole mass spectrometer. Operating conditions were an 80 μm diameter beam, 10 Hz repetition rate and 10 Jcm–2 fluence. Count rates were standardised to NIST SRM-610 silicate glass. A prolonged ablation time was required to achieve low detection limits and good reproducibility for this multitude of elements. To avoid issues of retrieving sample material from deep pits, the laser was moved along a transect over the fragments during analysis. This further averages any small-scale heterogeneity in composition and allows for removal of inclusions, which show up as compositional spikes. ICP-MS results were normalised to electron microprobe analyses to correct for differences in ablation behaviour between the silicate glass standard and the iron oxide fragments. This correction factor was derived from the average ratio (after removing outliers) of ICP-MS over microprobe data for Mn, Mg, Ca, Ti, Cr and V. There was good correspondence between factors derived from the various elements, as well as consistency within ores.
Following compositional analysis, the ore fragments were removed from the mounts, ground in an agate mortar, and reduced in a Setaram thermo-gravimetric analyser at the Ceramics Research Centre of Tata Steel. Bulk ore reduction-test samples were crushed and sieved to a size fraction from 200 to 125 μm prior to this grinding step, but otherwise treated identically (see the Appendix). Tests to determine the effect of fragment size on reduction showed a shift of less than 5°C for a 2 times reduction in fragment size (200 to 125 μm vs. <125 μm), so any difference in fragment size distribution between samples will have a negligible impact on the interpretation of reduction results. A CO–CO2–N2 atmosphere in the proportion 6:20:74 was used to reduce the samples, which fixes the oxygen fugacity in the wüstite stability field. Bulk ore samples were heated to 1000°C at 20°C/min. All other samples were heated at 90°C/min to 50°C below the start of reduction in their respective bulk ore, after which the heating rate was lowered to 20°C/min. Because individual fragments were too small to generate an accurate signal, 3 to 5 fragments with a similar composition and derived from the same ore were combined. This grouping of ore fragments was achieved by fuzzy c-means clustering on the compositional data, using the FUZNLMEX computer code.21)
The change in mass owing to loss of oxygen was used to determine reducibility, quantified by the temperature of start-of-reduction and the subsequent reduction rate. To allow for correct comparison of reduction curves for the compositional separates, the mass change associated with the hematite to magnetite and magnetite to wüstite reduction steps was normalized to a common value for each ore. This accounts for variations in the mineralogy of the compositional separates. Mass changes due to dehydration were subtracted from the thermo-gravimetric (TG) curves (except for Yandi) and any artefacts due to the change in heating rate for the separates (i.e. jumps in mass) were also removed.
Microscopy of the final selected ore fragments (1.0 to 0.85 mm in size) reveals that these are homogenous single-crystal fragments for Kir, Malm, Gue and MtW (Figs. 1(a), 1(b)), although recrystallisation into sub-fragments is common. Sis, Car and QFer are dominantly poly-crystalline and CaLa has both types (Fig. 1(d)). The Yan ore fragments are poly-crystalline and further contain porosity, even in the densest group of ore fragments (Fig. 1(e)). All ore fragments are free of optically recognisable gangue minerals, although small inclusions outside the level of sectioning cannot be excluded. Most fragments contain minor secondary Fe-oxides, especially on the fragment surfaces (e.g. Fig. 1(f)).
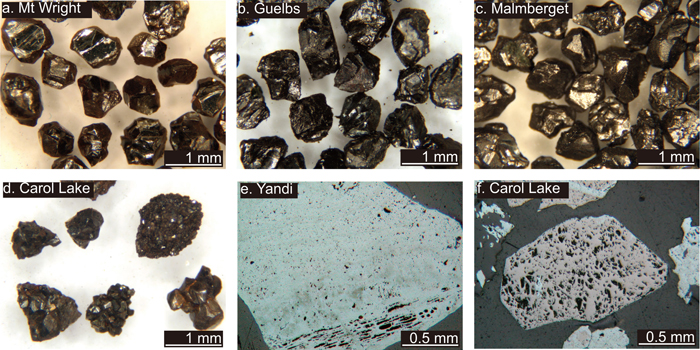
Optical microscope photographs showing typical ore fragments (ca. 1 mm in diameter) selected for final TG analysis (except fragment f, which was discarded); a–c single crystal fragments with well-developed crystal faces; d poly-crystalline aggregates; e layering and porosity in a typical Yandi ore fragment; f minor hematite along the outer surface of a magnetite ore fragment and a crack in its interior. (Online version in color).
Trace element concentrations for the final selected ore fragments are graphically summarised in Fig. 2 (the full data table is available from the corresponding author upon request). The magnetite ores Kir and Malm are rich in Mg, Ti, V, Co, Ni and Ga, whereas Gue magnetite ore is similar to the hematite ores, except for an enrichment in Mg. Goethite-rich Yan ore is indistinguishable from the hematite ores for most elements, except for an enrichment in Mg, P, Y and the rare earth elements (REE). Concerning the hematite ores; Sis is rich in Ni, Sc, Sr, and As; MtW and CaLa are similar and both enriched in Nb, Mo, Sn, W, V and Ga as well as depleted in Mg and Mn; the Brazilian ores also share common features including low Ti, Ga, Zr, Ni and As, but Car is characteristically enriched in Mn, Cu, Zn, Sr, Y, U, P and the REE.

Box-and-whiskers plots showing the distribution of compositions within and among ores as obtained from analyses on individual ore fragments for the final selected ore fragments. Despite compositional overlap between ores, a distinct signature can be recognised for each ore. Typical box-and-whisker plot symbology is used: the box represents the interquartile range of the data, with the solid line denoting the median; the whiskers show the spread in the data (1.5 times the interquartile range); the solid grey symbols are outliers; and the open symbols extreme values.
Results of thermo-gravimetric analyses are shown in Fig. 3. Reduction proceeds in composition separates as in the bulk ore reduction-test samples, although differences in the temperature of the start of reduction, as well as in reduction rate are observed. Reduction commences at higher temperature, but proceeds faster than in the bulk ore reduction-test samples (except for CaLa, where this is reversed). Yan shows a large dehydration step from goethite to hematite prior to reduction as evident from the kink in the TG curve at ca. –8% (Fig. 3(f)). Hematite ores show both reduction to magnetite and ongoing reduction to wüstite, and the effect of composition on both steps can be evaluated. Magnetite to wüstite reduction was not evaluated for Yan ores owing to exhausting the measurable mass change range. Variability in the reduction curves for different fragments of the same ore is small when compared to differences among ores.
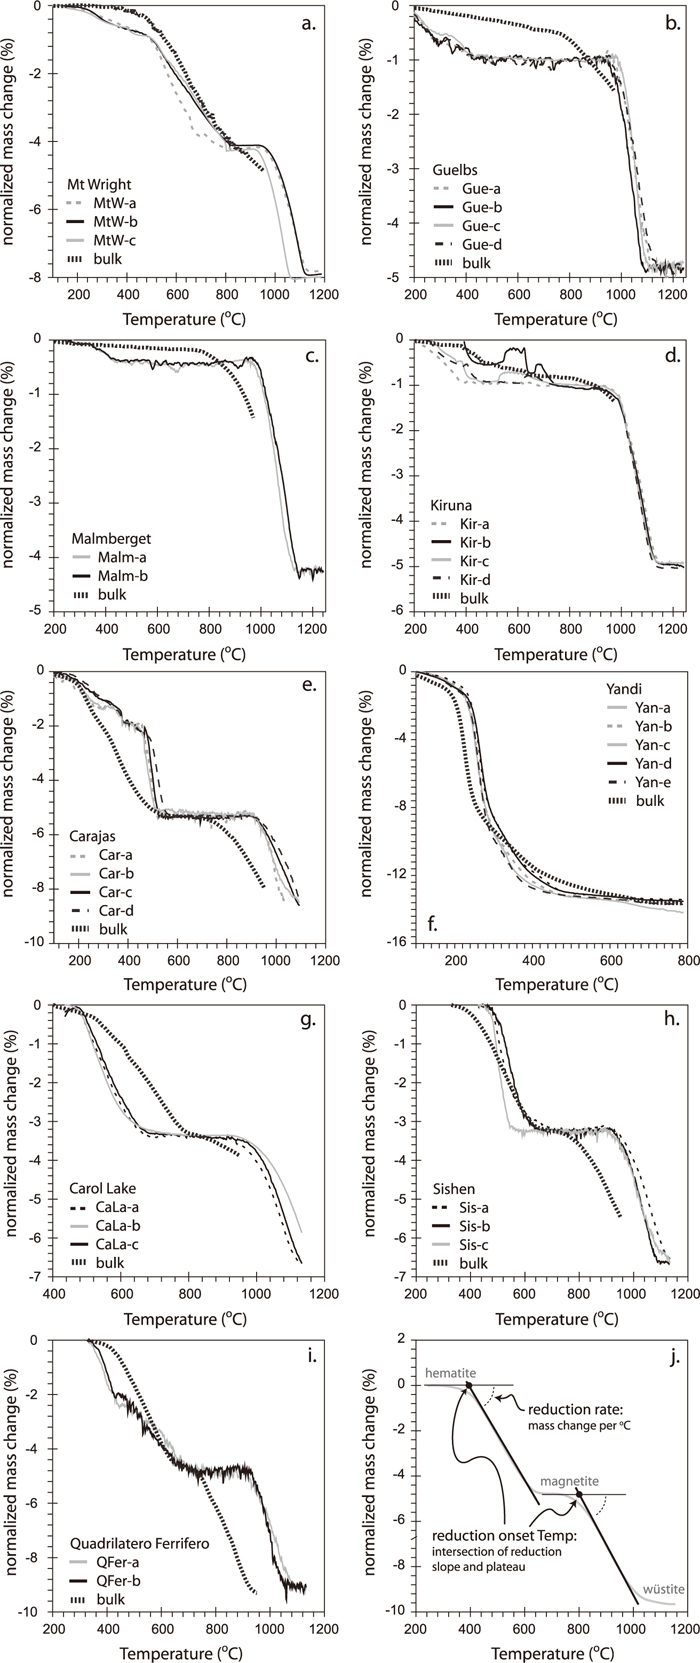
Results of reduction measurements by thermo-gravimetric analysis on ore-fragment compositional separates and bulk-ore reduction-test samples. The curves have been normalised to a common mass change for the hematite to magnetite and magnetite to wüstite transitions to allow for direct comparison. Reduction measures are schematically explained in Fig. 3(j): reduction rate is determined from the tangent slope of the reduction curve, and the start temperature of reduction is determined by extrapolating the slope to the pre-reduction mass plateau. Where no plateau is present (e.g. Yandi), the start temperature is determined from the intersection of the dehydration and reduction slopes.
The analytical uncertainty for the trace element analyses has been evaluated using count statistical errors. The median relative standard deviation was ±10%, with a range up to ±23% for low abundance trace elements (e.g. the REE). P had a consistently higher uncertainty at ±28%. Duplicate standard deviation was similar, although somewhat higher than count statistical error, indicating limited trace-element sample heterogeneity. Uncertainty on thermo-gravimetric curves as assessed from the noise on the magnetite and wüstite plateaus was less than ±2% relative. Repeat analyses on bulk ore showed that reproducibility was within 5°C for temperature and less than 5% relative for the mass change. These analytical uncertainties are smaller than differences among compositional separates and bulk ore reduction-test samples, allowing for meaningful comparison among them.
The compositional differences among ore fragments, within and among ores, reflect differences in the trace element content contained within the oxide lattice, because the sample selection and analysis method precludes sorbed elements or mineral inclusions to contribute. The data show that the different ores have a characteristic chemical signature, despite within-ore variability and a partial overlap in composition among ores. This signature dominantly reflects the geology of each ore.
Kiruna and Malmberget are highly enriched in Mg, Ti, V, Ni and Co as a result of their magmatic origin, in agreement with literature data.10,11,22) Formed at high temperature, these elements are readily incorporated in the magnetite crystal structure. P content is negligible, owing to the co-precipitation of the Ca-phosphate apatite, and incompatibility of P in the magnetite structure. In contrast, Guelbs magnetite ore formed by reduction of a hematite Banded Iron Formation during metamorphism. As such, its trace element signature is similar to BIF hematite ores. In essence, Guelbs displays an inherited hematite composition, containing elements that are compatible, and would therefore have partitioned into the original hematite.
The hematite ores are characterised by uniformly elevated P and As (Fig. 2), both of which are known to strongly adsorb onto iron oxy-hydroxides,e.g.23) which are the proposed precursor Fe-phases for Banded Iron Formations.24) Carol Lake and Mont Wright show a characteristic enrichment in Mo, Sn, W and Nb. Carajas shows a distinct enrichment in Cu, U and the REE, which reflects later pervasive overprint by hydrothermal fluids.25) Yandi represents a reworked and altered equivalent of a Banded Iron Formation and this is reflected in its composition and texture. For this study we have analysed only the goethite component of the ore, which is characteristically enriched in Mg, Y, P and the REE (Fig. 2). This element association suggests enrichment by adsorption driven scavenging of elements.e.g.23,26)
4.2. Reducibility and Ore-fragment CompositionAs shown in Fig. 3, the differences between reduction curves for different compositional separates of a given ore are small. The start of reduction varies by less than 50°C and reduction rates (the steepness of the curves) are similar. Furthermore, samples that overlap in chemistry but are derived from different ores are invariably different in their reduction behaviour (cf. Carol Lake and Mont Wright). To quantify the observed differences in reduction, the reduction slope for a given reduction step was determined, as well as the start temperature of reduction (Tstart) from an extrapolation of the reduction slope to the pre-reduction mass plateau (see Fig. 3(j) for a schematic drawing explaining these measures). The extrapolated start temperature was preferred over estimating the start temperature directly as the latter is gradual and difficult to pinpoint accurately in the thermo-gravimetric curves.
Plotting these reducibility measures against composition for each ore did not reveal a consistent trend with any impurity element. However, the number of samples per ore was small. Combining the various ores would provide a better indicator of the presence or absence of correlation, but this requires ore-specific features to be removed, given that the differences among ores are larger than the variations within ores (Fig. 3). This was achieved by evaluating the difference from the ore mean for the two reducibility measures and composition, rather than absolute values. In this full dataset, only Cr shows a statistically significant, negative correlation with rate of reduction in the hematite to magnetite step. This suggests that Cr stabilizes hematite relative to its magnetite reduction product, and thereby leads to a lower reduction rate. However, Cr is more compatible in magnetite than in hematite, so the opposite behaviour would in fact be expected.
4.3. Cumulative Mismatch as a Measure of Combined Impurity Impact on ReducibilityTrace impurity elements act on ore-fragment reducibility by changing the mobility of elements in the crystal lattice, owing to introduction of lattice defects, lattice site distortion and vacancies. This lattice damage is due to a mismatch in charge and radius of the impurity element compared to the ideal element on a specific lattice site, which is formalized in Lattice-Strain Theory.8,9) These effects are not confined to the immediate surroundings of the impurity, because impurities also act as generators for lattice defects when the mineral is subjected to deformation. The higher the impurity content, the larger the disruption of the lattice and the stronger the effect on mobility.
Given that different elements can have a similar mismatch in charge and radius, it is not the concentration of a specific element that affects ore-fragment reducibility, but rather the cumulative deviation in charge and radius of a given composition. To determine if such an effect is observable in our dataset we have calculated a cumulative charge and radius factor for each ore-fragment composition, using the following equation for the conversion of hematite to magnetite:
| ionic radius (pm) | |||
| Element | charge | tetrahedral | octahedral |
| Mg | 2 | 57 | 72 |
| P | 3 | – | 44 |
| Sc | 2 | – | 75 |
| Ti | 4 | 42 | 61 |
| V | 3 | – | 64 |
| Cr | 3 | 49 | 62 |
| Mn | 2 | 66 | 65 |
| Co | 2 | 58 | 75 |
| Ni | 2 | 55 | 69 |
| Cu | 2 | 57 | 73 |
| ionic radius (pm) | |||
| Element | charge | tetrahedral | octahedral |
| Zn | 2 | 60 | 74 |
| Ga | 3 | 47 | 62 |
| As | 3 | – | 58 |
| Sr | 2 | 108 | 118 |
| Y | 3 | 75 | 90 |
| Zr | 4 | 59 | 72 |
| Nb | 3 | – | 72 |
| Mo | 4 | – | 65 |
| Sn | 4 | 55 | 69 |
| La | 3 | 94 | 103 |
| ionic radius (pm) | |||
| Element | charge | tetrahedral | octahedral |
| Ce | 3 | 89 | 101 |
| Nd | 3 | 91 | 98 |
| Sm | 3 | 88 | 96 |
| Gd | 3 | 83 | 94 |
| Yb | 3 | 75 | 87 |
| W | 4 | – | 66 |
| Pb | 2 | 98 | 119 |
| U | 4 | 81 | 89 |
| Cd | 2 | 78 | 95 |
| Lu | 3 | 75 | 86 |
The distribution of cumulative charge and radius factors within and among ores reflects that of the trace elements (Fig. 4). Kiruna and Malmberget have the highest charge factor due to high Ti and Mg contents, whereas elevated P in the hematite ores, and especially in Yandi, results in higher radius factors for these ores. Based on the strong overlap for the hematite ores, only small variations in reducibility between ores would be expected if composition were the dominant parameter affecting this. In contrast, strong variations in reduction behaviour are found (Fig. 3). The magnetite ores, in contrast, show significant differences in cumulative charge and radius mismatch between Kiruna-Malmberget, and Guelbs, but their reduction curves are almost indistinguishable (Figs. 3(b) vs. 3(c)–3(d)). This indicates that the impurity impact on reducibility is small.
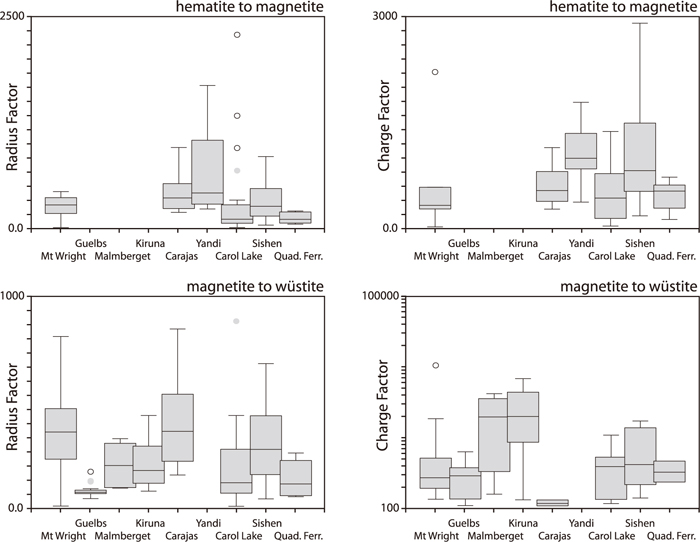
Box-and-whiskers plots showing the range in cumulative charge and radius mismatch for the various ores in the reduction steps from hematite to magnetite and magnetite to wüstite.
Using the differential approach described above to combine the data for all ores indicates that there is no statistically significant correlation between Tstart or reduction rate and charge or radius factors for the full dataset (Figs. 5, 6). Small effects are observed for individual ores; MtW and Car show a ca. 35°C earlier hematite-to-magnetite reduction for the sample with the highest mismatch in radius and charge (Figs. 5(a), 5(b)), accompanied by a ca. 30% increase in reduction rate (Figs. 6(a), 6(b)); in contrast, Kiruna and Malmberget show a ca. 8°C later start of magnetite-to-wüstite reduction for the sample with highest mismatch (Figs. 5(c), 5(d)), although reduction rate increases by ca. 15% (Figs. 6(c), 6(d)). Although these trends are statistically significant, they are based on a small number of samples, and, despite the large compositional differences in these compositional separates, the changes in reduction rate and Tstart are minimal.
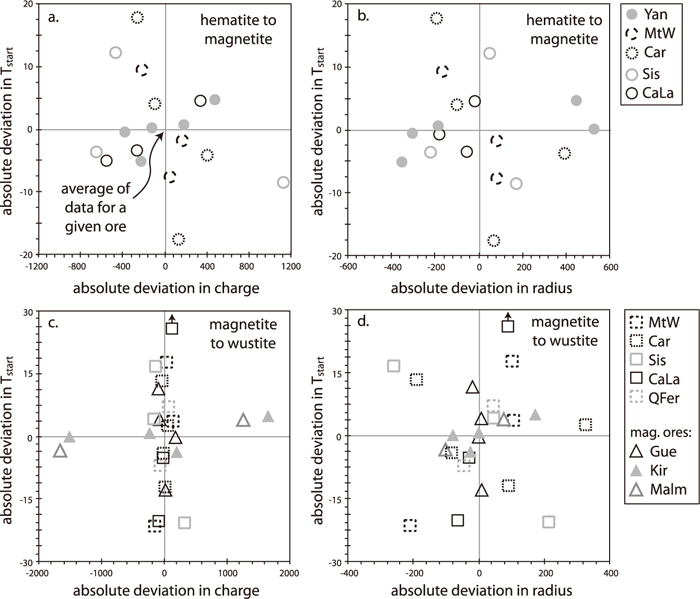
Scatter diagrams of charge and radius factors versus the shift in start temperature of reduction for hematite to magnetite and magnetite to wüstite. Ore specific effects have been removed by normalising the data to the average for each ore (this ore-specific average is at the origin in each diagram).

Scatter diagrams of charge and radius factors versus reduction rate for hematite to magnetite and magnetite to wüstite. Ore specific effects have been removed by normalising the data to the average for each ore (this ore-specific average is at the origin in each diagram).
The bulk ores contain higher compositional, mineralogical and textural variability than the ore-fragment separates, and this is reflected in their reduction behaviour (Fig. 3). The start of reduction is at lower temperature for all bulk-ores for the magnetite to wüstite step (Table 2), and for most bulk-ores for hematite to magnetite reduction (with the exception of Carol Lake), and the difference can be as large as 150°C (Car - Fig. 3(e)). The evaluation of compositional effects on reducibility, described above, indicates that their impact is minor, and cannot be quantified for most ores. The differences between compositional separates and bulk ore reduction-test samples must therefore reflect the impact of texture, and the observed shifts are consistent with the compositional separates having a lower exposed surface area and hence larger transport length compared to the porous or fractured fragments present in bulk ore. Carol Lake shows the opposite behaviour (Fig. 3(g)), which suggests that for this ore, the dense textural fraction is not the slowest reducing.
| Sample | Tstart (°C) hem-mag | Red. rate hem-mag | Charge factor | Radius factor | Tstart (°C) mag-wus | Red. rate mag-wus | Charge factor | Radius factor |
|---|---|---|---|---|---|---|---|---|
| MtW-a | 495 | –0.196 | 472 | 283 | 989 | –0.324 | 372 | 368 |
| MtW-b | 489 | –0.125 | 356 | 283 | 1003 | –0.392 | 263 | 366 |
| MtW-c | 506 | –0.133 | 94 | 40 | 964 | –0.478 | 75 | 53 |
| bulk ore | 493 | –0.190 | n.a. | n.a. | 850 | n.d. | n.a. | n.a. |
| Gue-a | n.a. | n.a. | n.a. | n.a. | 994 | –0.035 | 387 | 70 |
| Gue-b | n.a. | n.a. | n.a. | n.a. | 981 | –0.039 | 246 | 79 |
| Gue-c | n.a. | n.a. | n.a. | n.a. | 1006 | –0.044 | 115 | 52 |
| Gue-d | n.a. | n.a. | n.a. | n.a. | 998 | –0.033 | 153 | 77 |
| bulk ore | n.a. | n.a. | n.a. | n.a. | 780 | n.d. | n.a. | n.a. |
| Malm-a | n.a. | n.a. | n.a. | n.a. | 1003 | –0.034 | 310 | 102 |
| Malm-b | n.a. | n.a. | n.a. | n.a. | 1010 | –0.030 | 3215 | 278 |
| bulk ore | n.a. | n.a. | n.a. | n.a. | 858 | –0.011 | n.a. | n.a. |
| Kir-a | n.a. | n.a. | n.a. | n.a. | 991 | –0.027 | 930 | 126 |
| Kir-b | n.a. | n.a. | n.a. | n.a. | 992 | –0.029 | 2221 | 204 |
| Kir-c | n.a. | n.a. | n.a. | n.a. | 987 | –0.030 | 2650 | 180 |
| Kir-d | n.a. | n.a. | n.a. | n.a. | 996 | –0.033 | 4098 | 378 |
| bulk ore | n.a. | n.a. | n.a. | n.a. | 890 | n.d. | n.a. | n.a. |
| Car-a | 466 | –0.072 | 993 | 807 | 941 | –0.054 | 109 | 726 |
| Car-b | 453 | –0.057 | 720 | 481 | 926 | –0.027 | 66 | 490 |
| Car-c | 474 | –0.072 | 495 | 312 | 934 | –0.026 | 56 | 311 |
| Car-d | 488 | –0.057 | 333 | 217 | 952 | –0.020 | 28 | 206 |
| bulk ore | 325 | –0.020 | n.a. | n.a. | 812 | –0.016 | n.a. | n.a. |
| Yan-a | 280 | –0.043 | 981 | 1148 | n.d. | n.d. | n.d. | n.d. |
| Yan-b | 275 | –0.037 | 883 | 271 | n.d. | n.d. | n.d. | n.d. |
| Yan-c | 279 | –0.042 | 725 | 318 | n.d. | n.d. | n.d. | n.d. |
| Yan-d | 285 | –0.039 | 1574 | 1068 | n.d. | n.d. | n.d. | n.d. |
| Yan-e | 281 | –0.037 | 1282 | 434 | n.d. | n.d. | n.d. | n.d. |
| bulk ore | 199 | –0.021 | n.a. | n.a. | n.d. | n.d. | n.a. | n.a. |
| CaLa-a | 473 | –0.021 | 348 | 96 | 988 | –0.026 | 49 | 113 |
| CaLa-b | 475 | –0.024 | 554 | 228 | 1034 | –0.025 | 262 | 271 |
| CaLa-c | 481 | –0.020 | 963 | 131 | 1003 | –0.027 | 122 | 148 |
| bulk ore | 532 | –0.012 | n.a. | n.a. | 840 | n.d. | n.a. | n.a. |
| Sis-a | 477 | –0.033 | 466 | 186 | 970 | –0.022 | 158 | 239 |
| Sis-b | 492 | –0.029 | 645 | 458 | 957 | –0.028 | 113 | 544 |
| Sis-c | 472 | –0.046 | 2244 | 580 | 933 | –0.020 | 610 | 715 |
| bulk ore | 410 | –0.015 | n.a. | n.a. | 800 | –0.015 | n.a. | n.a. |
| Qfer-a | n.d. | n.d. | n.d. | n.d. | 922 | –0.027 | 17 | 270 |
| Qfer-b | n.d. | n.d. | n.d. | n.d. | 936 | –0.037 | 155 | 362 |
| bulk ore | 420 | –0.021 | n.a. | n.a. | 743 | –0.025 | n.a. | n.a. |
Reduction rates are given in % mass change per degree temperature; Tstart is the extrapolated onset temperature for a given reduction step; n.a. - not applicable (no hematite present); n.d. - not determined; values in italics are approximate.
Comparing among the bulk ores shows large variations in the start of reduction (Table 2), with a range in Tstart for hematite to magnetite reduction from 200°C for Yandi to more than 500°C for Carol Lake and Mont Wright. Similarly, the Tstart for the magnetite to wüstite transition varies from approximately 745°C for QFer to 890°C for Malm. Reduction rates are lowest for CaLa and Sis, and highest for MtW indicating that MtW starts to reduce late, but does so at a high rate. The observed bulk-ore reducibility does not correlate with the average ore composition of its separates (e.g. the median composition in Fig. 2) and again suggest a textural control. Indeed, Yandi contains abundant porous goethite fragments and this porosity is further enhanced during dehydration of goethite. Mont Wright and Carol Lake on the other hand are dominated by dense fragments of hematite, increasing overall transport length. The remaining hematite ores are dominated by layered and fractured fragments, as well as a significant goethite component for Carajas, and have an intermediate reducibility.
Reducibility tests on dense ore-fragment separates and bulk ore samples show a wide range of reducibility. This variation is controlled by ore-fragment texture, despite large, and highly characteristic difference in ore-fragment composition. Whereas the ore chemistry strongly overlaps, there is no accompanying overlap in reducibility between ores. Instead, different samples of a given ore tightly cluster together, irrespective of their composition. Only Mont Wright and Carajas compositional separates show a significant and consistent composition effect, displaying a shift in the start of reduction of ca. 35°C accompanied by a 30% change in reduction rate for the range of cumulative charge and radius mismatch in these ores. However, the start of hematite-to-magnetite reduction among bulk-ores varies by over 300°C (Fig. 3 and Table 2), and lack of systematic variations with composition indicates that this is dominantly a texture-controlled variation. Porous goethite-dominated ores show the highest reducibility, followed by fractured and layered fragments and finally dense ore fragments. We therefore conclude that it is not transport rates that control reduction, which are a function of impurity content, but rather transport length (i.e. the distance to the nearest surface). As a result, ore-fragment texture controls reducibility and compositional effects only play a minor role. In conclusion, for pyrometallurgical reduction, ore texture provides the more important parameter to tune reducibility of the ore bed.
Sample preparation and laser ablation ICP-MS analyses were carried out by Bobby Karimi, and part of the TGA analyses by Mary Weingaarden. We thank Bill Minarik and Jim Clark for help with chemical analyses and James Small for insightful discussions on ore reactivity. Thoughtful reviews improved the clarity of the manuscript.
Flow diagram showing the methodology applied in this study for bulk ore reduction-test samples and ore-fragment separates.