Abstract
In this study, the formation of calcium ferrites during heating and cooling was investigated by in situ and real-time observation using a newly developed system, i.e., “quick X-ray diffraction (Q-XRD),” and an in situ laser microscope. In the new Q-XRD, a specimen was heated up to 1773 K, and X-ray diffraction patterns were measured using a pixel-array area detector with an interval as short as a few seconds. In situ observation both of crystal structure and microstructure successfully revealed the effects of heating and cooling rates on the sintering reaction in the CaO–Fe2O3 system with special attention to overheating and overcooling phenomena. The first continuous cooling transformation (CCT) concept for iron ore sintering was proposed to understand overcooling phenomena when the molten oxide cooled down to room temperature and magnetite (Fe3O4), hematite (Fe2O3), and various types of calcium ferrite were formed. The CCT diagram for sintering provides crucial and fundamental information on the sintering accompanying solidification, precipitation, and formation of calcium ferrites from the molten oxide, and can be used as a guideline for controlling sintering processes.
1. Introduction
Iron-ore sinter constitutes the major component of the iron-bearing burden in the blast furnace in most countries in the Asia-Pacific region. Therefore, its quality and consistency have a significant impact on blast furnace performance. It is generally accepted that the quality of iron-ore sinter is governed by its microstructure, which is formed during the sintering process, as well as the properties of individual mineral phases and the size, shape, and distribution of their grains, and mutual interaction among the mineral phases.1,2,3,4,5) In the industrial sintering process, the fine ores are mixed with limestone flux and coke breeze, and heated by the combustion of coke breeze, resulting in heating up to temperatures of 1450–1600 K (above the eutectic temperature of CaO–Fe2O3: 1478 K, Fig. 1(a)) for a few minutes in the region (ca. 10−1 m) near the coke breeze. Figure 1(a) shows the phase diagram of the quasi-binary Fe2O3–CaO system.6) Consolidation of iron ores progresses with the formation of melt and material transport through the melt, referred to as liquid phase sintering, which is illustrated in Fig. 1(b) based on the review articles.2,4,7,8,9) The microstructure of the sinter basically consists of the unmelted ore, bond, pores, and cracks. The bond phases consist of calcium ferrites (CaO–Fe2O3), silico-ferrites of calcium and aluminum (SFCA), glass (CaO–SiO2), and their solid-solution phases.2) The final structure found in the sinter is critically affected by the way in which various phases develop during heating and cooling in the sintering process.10,11)
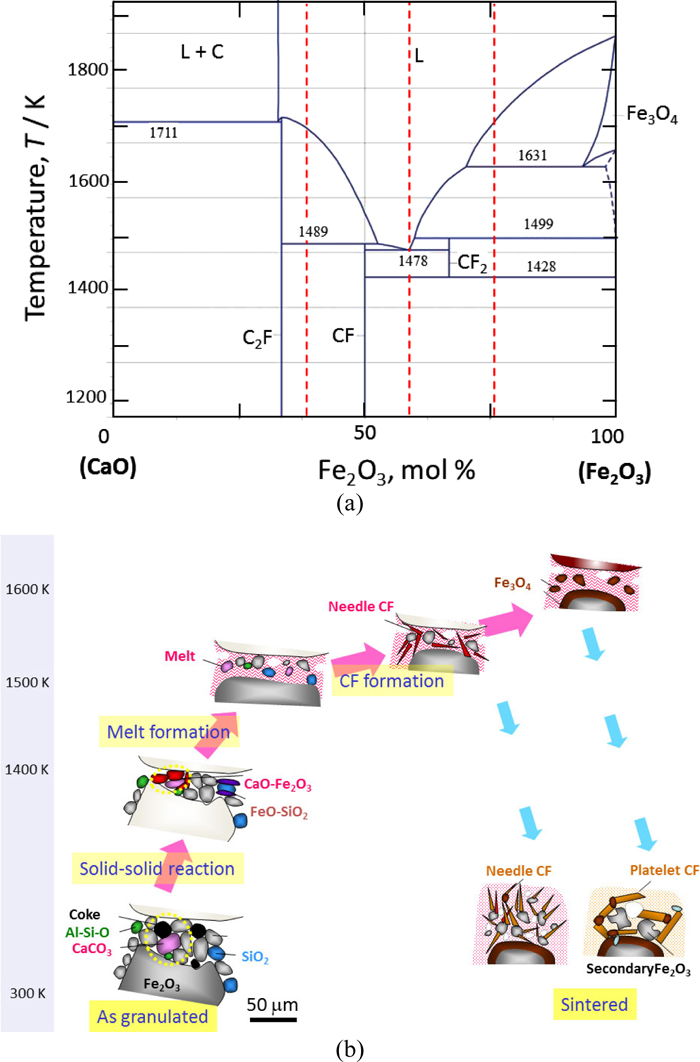
The phase stability and crystal structures of possible phases in the Ca–Fe–O system have been extensively studied and summarized.6) Three compounds were found at the Fe2O3–CaO section in the quasi-binary phase diagram (Fig. 1(a)): Ca2Fe2O5 (C2F),12) CaFe2O4 (CF),13) and CaFe4O7 (CF2),14) where C = CaO, F = Fe2O3, and W = FeO. CaFe4O7 (CF2) is a high-temperature phase, which is reported to be stable only between 1428 and 1499 K. However, other phases containing Fe2+ were reported to form α−CFF, β−CFF, and γ−CFF depending on oxygen potential,15) Ca2Fe9O13 (C2W5F2) and Ca2Fe7O11 (C2W3F2) at 1393 K,16) and CaFe3O5 (CWF), CaFe4O6 (CW2F), and CaFe5O7 (CW3F).17) These studies show that the type and amount of coexisting phases are sensitive to the heating condition and chemical composition even nearly at equilibrium state.
Most of these studies focused on the phase stability of various types of calcium ferrites and SFCAs that are included in specimens prepared in equilibrium and isothermal conditions or in the obtained sinters (i.e., after sintering reactions or ex situ measurements). However, sintering in a real process progress in short periods of 102 s on heating and 2 × 10² s on cooling in the temperature range T = 1473–1873 K, and the sintering reaction progresses under a non-equilibrium and non-isothermal condition. Thus, the final microstructure and type of coexisting phases of the sinter are highly susceptible to the heating conditions, especially the heating and cooling rates and the gas atmosphere such as the oxygen partial pressure pO2. In situ and dynamic observation is one of the most powerful techniques to reveal reactions mechanism undergoing in a non-equilibrium condition. However, few studies were reported in the molten including CaO and/or Fe2O3 mainly because of the following experimental difficulties: high reaction temperatures (T > 1473 K) and short reaction time (< 2 × 10² s). Formation of the silico-ferrite of calcium and aluminum (SFCA) was extensively investigated using a scanning electron microscope (SEM)18) and in situ X-ray diffraction (XRD).19,20) The crystallization of molten CaO–SiO2 was investigated using hot thermal coupling (HTC).21) These in situ observations mainly focused on the reaction scheme at equilibrium state, and there has been little information on the reaction scheme during heating and cooling with higher rates, which are used in actual industrial processes. Furthermore, the simultaneous observation of the change in the crystal structure and microstructure has not been reported in spite of its importance to reveal the mechanism of sintering process.
In this study, the formation of calcium ferrites (CFs) in the CaO–Fe2O3 system was investigated by in situ and real-time observation of both (a) crystal structures by using a newly developed technique, referred to as “quick X-ray diffraction (Q-XRD),” and (b) microstructures by using an in situ laser microscope. On the basis of these experimental observations, the concept of continuous cooling transformation (CCT) for sintering has been proposed.
2. Development of Quick X-ray Diffraction (Q-XRD)
The quick X-ray diffraction (Q-XRD) system was developed for the in situ and real-time observation of change in crystal structures during high-temperature reactions. Q-XRD is composed of (a) an X-ray source, (b) a two-dimensional hybrid pixel array detector, and (c) a reaction chamber system. Figure 2 shows the X-ray geometry of Q-XRD.

A rotating anode of cobalt (λKa1 = 0.17889 nm) and synchrotron radiation (λ = 0.17889 nm) were used as the X-ray source. These energies were used for suppression of fluorescence from a specimen and covering a sufficient range of the diffraction angle 2θ with a decent angular resolution in the area detector. The divergent X-ray beam generated from the rotating anode was monochromated and made parallel with a divergent angle of less than 0.05 deg using a parabolic mirror with its surface coated with multiple layers of tungsten and silicon; the lattice constants of artificial layered lattice is made gradient so that the incident beam with a divergence becomes parallel. A typical size of the X-ray beam directed at the specimen is 0.5 × 2.0 mm2 (Fig. 2(a)). For the synchrotron radiation experiments, Q-XRD measurements were performed at the bending-magnet beam line BL-6C at Photon Factory (PF), the High Energy Accelerator Research Organization (KEK) in Japan. The X-ray beam, monochromated with double Si(111) crystals, was focused on the specimen using a platinum-coated cylindrically bent mirror. The size of the X-ray beam directed at the specimen point is ca. 0.5 × 1.0 mm2 (Fig. 2(b)).
Diffraction profiles from a part of the Debye-Scherrer cone was collected by using two-dimensional hybrid pixel array detectors, PILATUS®.22,23) The following are some important specifications: pixel size = 0.172 × 0.172 mm2, number of pixels = 487 × 195, active area = 83.8 × 33.5 mm2, count rate: >2 × 10⁶ electrons/pixel/s, and readout time = 3 ms. In the case of the rotating-anode X-ray source, the X-ray source as well as the detector rotates around the reaction chamber independently to align the specimen horizontally (Fig. 2(a)).
Figure 3 shows (a) a schematic diagram of the reaction chamber of the Q-XRD system and (b) the details of the heating unit around the specimen. The heating unit was located at the center of the outer cover of the reaction chamber with a beryllium window for the transmission of incident and diffracted X-ray beams. The beryllium window was attached to the cover by glue and the heating chamber is water-cooled to maintain the temperature near the window lower than ca. 350 K. A heating insulator made of the porous alumina was used to cover the heating unit, and the heating insulator has a window for passing an X-ray beam. A metal foil was placed between the heating unit and the outer cover for filtering the Kβ line of the X-ray. In this study, a nickel foil having a thickness of 5 μm was used.
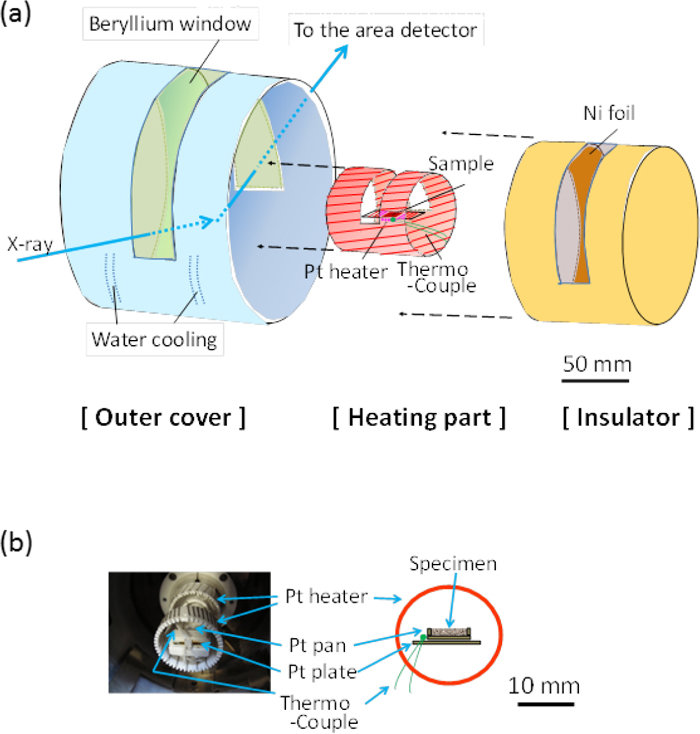
Specimens in various shapes such as powder, pellets, and sheets were mounted into a pan, and the pan was placed on the specimen-holder plate, made of platinum. The typical size of the pan is 18 mm (length) × 8 mm (width) × 1 mm (depth), and it is set into the furnace where the platinum wire is wound around the alumina base. The sample is mainly heated by the back and front heaters, which minimize the temperature gradient along the surface to the bulk less than a few degrees up to 1773 K.
3. Experiments
3.1. Specimens and Experimental Procedures
Chemical reagent powders of α-Fe2O3 (99.99%) and CaCO3 (99.99%) are mixed using an agate mortar and a pestle with initial chemical compositions listed in Table 1, which are shown in the phase diagram of the quasi-binary Fe2O3–CaO system6) (Fig. 1). The specimen Fe90Ca10 corresponds to the average chemical composition of the typical sinters used in iron making. Fe80Ca20 is near the eutectic composition (Fe2O3 57.2 mol.%), and Fe64Ca36 is for simulating the Ca-rich region. The grain sizes of α-Fe2O3 and CaCO3 are ca. 1–2 and 2–3 μm, respectively, which is comparable to the sizes of adhesive fine-grains found in large Fe2O3 grains. In industrial sintering, large Fe2O3 grains (a few mm in diameter) are granulated with fine-grains of Fe2O3, CaCO3, other minerals (less than a few tens of μm in diameter) and coke breeze. The chemical composition of the region that forms the bond phases largely depends on how these fines grains such as CaO and Fe2O3 are locally mixed. The specimen Fe80Ca20 is considered to represent a typical chemical composition of the bond phase.
Table 1. Composition of samples for quick-XRD measurements.
| Specimens | Fe2O3 (mass%) | CaO (mass%) |
|---|
| Fe64Ca36 | 64.0 | 36.0 |
| Fe80Ca20 | 80.0 | 20.0 |
| Fe90Ca10 | 90.0 | 10.0 |
Change in crystal structures were investigated using Q-XRD described in Sec. 2. The powder mixtures or their pellets were filled into a platinum pan and set into the furnace attached at the center of a goniometer. The specimen was heated from room temperature at a rate of 5.0 × 10⁻¹ K/s up to T = 1773 K, and cooled down at rates of −8.3 × 10⁻¹ and −8.3 × 10⁻² K/s down to T = 673 K under air atmosphere.
During heating and/or cooling, changes in the crystal structure of the specimen were evaluated by the area detector. For in situ and real-time observation, the detector was fixed at a specific angle and the diffraction patterns were measured continuously. A camera length of 200 mm from the specimen to the detector, diffraction angle of 2θ = 23.5–46.5 deg and arc angle of Debye-Scherrer ring of Δβ = 10 deg, angular resolution (corresponding to a pixel) of Δ2θ = Δβ = 0.05 deg, and exposure time of 1–102 s are the typical conditions.
3.3. Laser Microscope Measurements
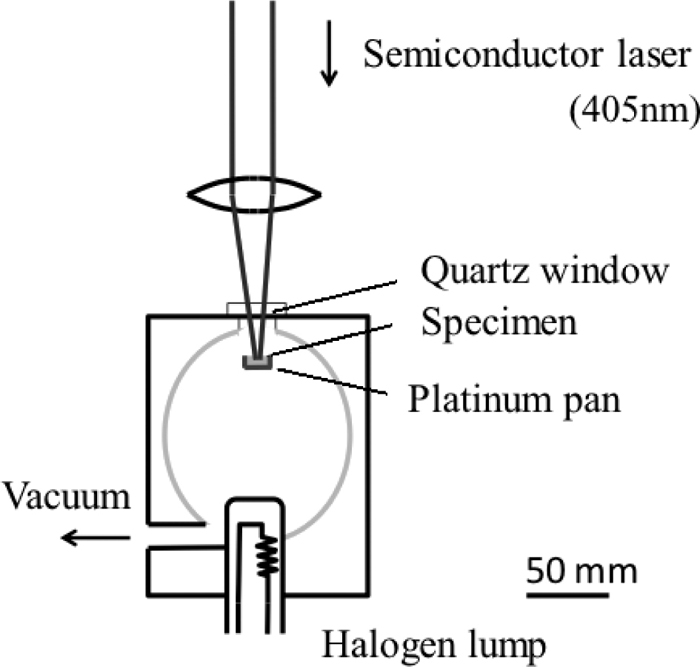
The changes in the microstructure were investigated using a confocal laser scanning microscope combined with an image furnace equipped with a 1.5-kW halogen lamp (Fig. 4), which was developed by Yonekura Corp. The changes in the microstructure could be measured up to 1773 K with a magnification of ×1100 at a spatial resolution 0.30 μm.
Powder mixture, typically 50 mg in weight, was compressed into a 5 mmϕ × 5 mmH platinum pan. The gas atmosphere during heating and cooling was Ar/O2 = 80 vol.%/20 vol.%. The specimen was heated from room temperature at a rate of 5.0 × 10⁻¹ K/s up to T = 1773 K and cooled at rates of −3.3 K/s and −8.3 × 10⁻¹ K/s down to T = 673 K under Ar/O2 flow with a rate of 3.38 × 10⁻² Pa·m3/s. By controlling the gas flow near the specimen, the changes in the microstructure were clearly observed in situ even in the case of gas emission from the specimen.
In general, it is necessary to define the thermal field, the phase diagram and the nucleation and growth behavior of the solid to understand precipitation from liquid. In this study, the molten oxide with a thickness about 0.5–1 mm was heated from the bottom side and was cooled down. The measured areas were the surfaces at penetration depths of a few micrometers for both in situ Q-XRD and laser microscopy. Thus, it is inevitable that there remains the temperature gradient 3–5 K from the bottom (i.e. the interface of the molten oxide and the platinum pan) to the top (i.e., the interface of the molten oxide and air) and the surface roughness of the platinum pan can provide the nucleation sites. Thus the obtained results, especially overheating and overcooling temperature may be affected to some degree by the amount of specimen such as 1 g in this study and 1 kg in industrial process. However the fundamental information on the reaction schemes are expected to be obtained as far as carefully considered including the scaling factor.
4. Results and Discussion
4.1. In Situ Observation of Change in Crystal Structure by Q-XRD
Various types of materials were tested for the usage of the sample pan. Oxides such as Al2O3 or ZrO2 were not appropriate for CaO–Fe2O3 systems because they reacted with each other at temperatures greater than 1450 K. We mainly used a platinum pan for the experiments because no severe reaction was observed between the specimens and the pan; this was not the case for pans made of oxides such as Al2O3 or ZrO2. We paid special attention while mounting the specimen so that a sufficient amount of the specimen was filled into the pan with a smooth surface at the irradiated area. This is important because the specimen volume reduces drastically when it melts, and the specimen surface often moves out from the area irradiated by the X-ray beam.
The temperature of the specimen was monitored by a Pt–Rh thermocouple located beside the specimen pan. The temperature difference between the thermocouple and the sample was corrected by measuring the temperature of phase transition of some standard samples using X-ray diffraction. Temperature calibration in a wider temperature range was also performed by measuring the thermal expansion of α-Al2O3 by X-ray diffraction (Fig. 5). The temperature measured by the thermocouple (Tobs.) was 30–50 K lower than the that of the sample (Tsample), which was estimated from the thermal expansion data24) using the lattice constants measured by in situ X-ray diffraction; the dependence of temperature difference on the temperature was observed between 300 and 1773 K (Fig. 5) and used for temperature correction.

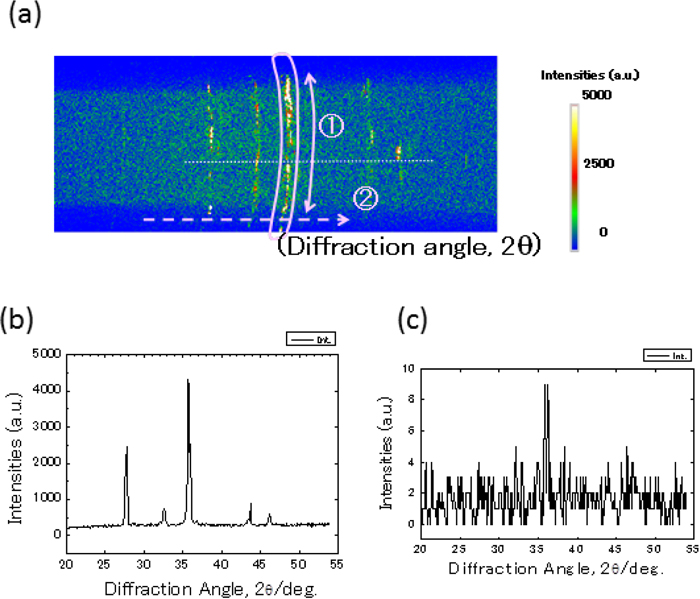
When heated at a temperature higher than 1400 K or cooled down from the molten oxide to form precipitated oxides, the preferred orientation of grains is often observed in the specimen because of grain growth or precipitation in a specific crystallographic direction. This is the case in this study, which makes the Debye-Scherrer cone discontinuous. In the system developed in this study, changes in the Debye-Scherrer cone were monitored by the area detector, and the diffraction intensities were obtained by integrating the diffraction intensities along the Debye-Scherrer cone. A typical example is shown in Fig. 6 where the specimen CaO:Fe2O3 = 25:75 mass% was heated at T = 1473 K. The measured Debye-Scherrer ring intensities are discontinuous (Fig. 6(a)), but integration of diffraction intensities along the Debye-Scherrer ring results in a diffraction pattern with a much better-quality (Fig. 6(b)). Figure 6(c) is the diffraction pattern obtained in the same condition with a scintillation detector in place of an area detector, demonstrating the merits of using an area detector for in situ observations of such reactions at high temperature.
Special attention was paid so that the platinum pan was covered by a proper amount of molten oxide with a sufficient thickness (ca. > 0.3 mm). As for using synchrotron radiation (Fig. 2(b)), the specimen holder was tilted by typically up to 5–10 deg, but the molten oxide did not move and continued to cover the pan. This was achieved by mechanical treatment of the pan surface, resulting in the control of the wetting property of molten oxide.
4.2. Structure Change in the Heating Process
In the heating process, the changes in the type and amount of coexisting phases progress through solid–solid diffusion among the grains below the eutectic temperature. Thus, these changes were observed in situ mainly by Q-XRD. Figure 7 shows a typical temperature evolution of X-ray diffraction patterns measured in situ by Q-XRD for Fe90Ca10 on heating from 300 to 1773 K at 5.0 × 10⁻¹ K/s. This heating rate is 1/4 times that of a typical industrial sintering process in the temperature region between 1350 and 1600 K. Only parts of measured patterns at each temperature interval of 25 K are shown in Fig. 7. Patterns at the bottom show the calculated diffraction patterns for the reference phases: α-Fe2O3 (F), Fe3O4 (M), Ca2Fe2O5 (C2F),12) CaFe2O4 (CF),13) CaFe4O7 (CF2),14) and CaFe4O6 (CW2F).17) The diffraction patterns of the reference phases are calculated from crystallographic data.6) Changes in the atomic structures of coexisting phases were clearly observed in situ by Q-XRD. The CF phase was formed at T = 1355 K because solid–solid diffusion becomes fast enough in the stable CF phase. On further heating, the CF reacted with α-Fe2O3 (F) and formed CF2 (CaFe2O4 + Fe2O3 → CaFe4O7) at T = 1513 K. On further heating, the mixture of CF, CF2, and Fe2O3 reacted with each other and formed a liquid phase at T = 1558 K. The overheating temperatures that were observed in situ for the reactions CaFe2O4 + Fe2O3 → CaFe4O7 and CaFe2O4 + CaFe4O7 → liquid were ΔT1c = 85 K and ΔTLc = 80 K, respectively, where ΔTxY represent a temperature deviation of the reaction X from the equilibrium one (overheating or over cooling temperature) at the heating or cooling condition Y. Then, the Fe2O3 phase transformed into the Fe3O4 phase at T = 1678 K, which is 47 K higher than that in the equilibrium state (ΔTWFc = 47 K). These overheating temperatures naturally depend on conditions such as heating rate, grain size of α-Fe2O3 and CaCO3 powders, and their alignment; when fine α-Fe2O3 and CaCO3 grains are mixed with each other, a relatively lower overheating temperature is expected.

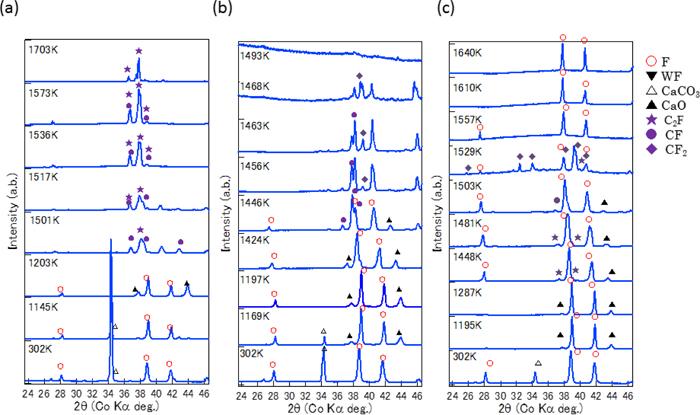
The same measurements were performed also for Fe64Ca36 and Fe80Ca20. Figure 8 shows some typical X-ray diffraction patterns measured in situ by Q-XRD for the three specimens. Figure 9 show reaction schemes obtained in situ by Q-XRD for the specimen (a) Fe64Ca36, (b) Fe80Ca20, and (c) Fe90Ca10 when heated from 300 to 1773 K at a rate of 5.0 × 10⁻¹ K/s. In the specimen Fe80Ca20, the CF phase started to form at T = 1443 K. On further heating, CF phases reacted with α-Fe2O3 (F) and the amount of CF2 increased (CaFe2O4 + Fe2O3 → CaFe4O7) at T > 1453 K, which is 25 K higher than that in the equilibrium state (ΔT1b = 25 K). The mixture of CF and CF2 phases eutectically formed a liquid phase at T = 1490 K, which is 12 K higher than that of the equilibrium state (ΔTLb = 12 K). In the specimen Fe64Ca36, both C2F and CF phases were formed at T = ca. 1493 K, which is 4 K higher than that of the equilibrium state (ΔT1a = 4 K). The mixture of C2F and CF phases remained up to T = 1710 K, where the fraction of C2F phase increases as the temperature increases.
The changes in the microstructure were investigated using the confocal laser scanning microscope combined with an image furnace (Fig. 4) for the specimens Fe90Ca10, Fe80Ca20, and Fe64Ca36, when heated from 300 to 1773 K with a rate of 5.0 × 10⁻¹ K/s. The morphology suggested bubble formation caused by the decomposition of calcium carbonate (CaCO3 → CaO + CO2) in the temperature range 1173–1350K for all specimens. On further heating, no clear change in microstructure corresponding to the formation of calcium ferrites was observed below the melting temperatures. At the melting temperatures, the initiation of melting spread over the viewing field (ca. 200 μm) within a few seconds, and all grains changed into the liquid instantly.
When the reaction schemes of the three specimens on heating were compared, the following features were observed (Fig. 9). (1) Overheating temperatures for the formation of CF2 and the melting from CF2 are 80 K and 59 K in the specimen Fe90Ca10, respectively. Overheating temperatures for the formation of CF and the melting from CF are 25 K and 12 K in the specimen Fe80Ca20, respectively. This difference can be explained as follows; the diffusion was enhanced in the specimen Fe80Ca20 because of its eutectic composition and lower melting temperature (1478 K). Furthermore, CF2 has a complicated crystal structure with a longer range ordering than CF, which requires a longer time and/or a higher temperature for CF2 to form. (2) In the Fe-rich specimens (Fe90Ca10 and Fe80Ca20), the Ca-rich calcium ferrite (CF > CF2) is formed first, whereas in the Ca-rich specimens (Fe64Ca36), the Fe-rich calcium ferrite (CF > C2F) is formed first. This suggests the mutual diffusion progresses among fine grains of CaO and Fe2O3 on heating. (3) The temperature where calcium ferrites are first formed (T1) increases with an increase in the CaO/Fe2O3 ratio of the specimen: T1a > T1b > T1c. This indicates that it requires a longer time and/or a higher temperature for CaO to diffuse than Fe2O3.
These reaction schemes suggest that the CaO–Fe2O3 systems near the eutectic composition not only show a low melting temperature at equilibrium but also a lower overheating temperature. In other words, Q-XRD has clearly showed why the CaO–Fe2O3 system near the eutectic composition forms a liquid phase at a lower temperature in the industrial sintering process, where the heating reaction progresses under non-equilibrium conditions.
4.3. Structure and Morphology Change in the Cooling Process
The formation of calcium ferrites form molten oxides during cooling process was investigated by in situ observations using Q-XRD and the confocal laser scanning microscope.
4.3.1. Specimen Fe80Ca20
Figures 10(a) and 10(b) show X-ray diffraction patterns measured in situ by Q-XRD for the specimen Fe80Ca20 when cooled from 1773 to 300 K with rates of (a) −8.3 × 10⁻¹ K/s and (b) −8.3 × 10⁻² K/s, respectively. Calcium ferrites (CF, CF2) and hematite (F) were formed from the molten oxide by the eutectic reaction: L → CF + CF2 at T = 1450 K (−28 K below the eutectic temperature) for the cooling rates of −8.3 × 10⁻¹ K/s and T = 1470 K (−8 K below the eutectic one) for −8.3 × 10⁻² K/s, respectively (Table 2). At these cooling rates, the CF2 phase, which is stable only at high temperatures in the range of T = 1428–1499 K, started to decompose to CF and hematite (CF2 → CF + F) during cooling and cannot be fully quenched down to a room temperature. It is worth noting that a severe preferred orientation was observed for solidification from the molten oxide (as shown in Figs. 1(a) and 1(b)), and obtaining a quantitative ratio of coexisting phases only by X-ray diffraction was rather difficult.

Table 2. Overcooling temperatures for phase transformations of the specimen Fe80Ca20.
| Cooling rate (K/s) | ΔTL → CF + CF2/K |
|---|
| −8.3 × 10⁻¹ | −28 |
| −8.3 × 10⁻² | −8 |
In situ observations by laser microscope as well as Q-XRD have been performed extensively for the specimen Fe90Ca10 to obtain the first “continuous cooling transformation (CCT)” concept for sintering. Figures 10(c) and 10(d) show X-ray diffraction patterns measured in situ by Q-XRD for the specimen Fe90Ca10 when cooled from 1773 to 300 K with rates of (c) −8.3 × 10⁻¹ K/s and (d) −8.3 × 10⁻² K/s, respectively. Calcium ferrites (CF, CF2) and hematite (F) were formed almost simultaneously from the molten oxide by the reaction: L + F → CF + CF2 + F at T = 1483 K for the cooling rates of −8.3 × 10⁻¹ K/s and T = 1491 K for −8.3 × 10⁻² K/s, respectively. These temperatures are −16 K and −8 K below the reaction temperature at equilibrium (1499 K) (Table 3). At these cooling rates, all of CF, CF2 and F are formed from the molten oxide at the same time, suggesting the precipitation of CF directly from the molten oxide proceeds the solid reaction: CF2 → CF + F which is expected in a lower-temperature region of T < 1428 K at equilibrium state (Fig. 1(a)). At these cooling rates, the precipitated CF, CF2 and F phases are cooled down to room temperature, and their phase fractions change little. Considering that these cooling rates in this study are almost in the same magnitude of typical cooling rates in industrial sintering, these results obtained by in situ Q-XRD suggest that the formation of calcium ferrites during overcooling process in a temperature range of 1480 and 1500 K determines the type and amounts of coexisting phases in the final sinters in industrial processes.
Table 3. Overcooling temperatures for phase transformations of the specimen Fe90Ca10.
Cooling rate
(K/s) | ΔTL → L + WF /K | ΔTL + WF → L + F /K | ΔTL + F → CF + CF2 + F /K |
|---|
| −3.3 | −63 | −132 | – |
| −8.3 × 10⁻¹ | −36 | −84 | −16 |
| −8.3 × 10⁻² | −8 | −11 | −8 |
When cooled down from the oxide molten, no clear diffraction peaks were observed above 1483 K and 1491 K for the cooling rates of −8.3 × 10⁻¹ K/s and −8.3 × 10⁻² K/s, respectively, even the temperature is well below 1733 K where the phase boundary: L = L + WF. This is because it is difficult to observe small precipitated-particles by diffraction, where the fine grains of precipitation (Fe3O4 and Fe2O3), often highly-preferred oriented, are floating among the molten oxide. Thus the only small peak of Fe3O4 and/or Fe2O3 was observed from time to time in the liquid-coexisting region of L + WF and L + F as shown in Figs. 10(c) and 10(d). Thus in situ observation using laser microscope is required to reveal the reaction schemes in the system including the molten oxide.
Figure 11 shows the typical microstructures obtained in situ by laser microscopy for the specimen Fe90Ca10, when cooled from 1773 to 300 K with rates of (i) −3.3 K/s and (ii) −8.3 × 10⁻¹ K/s, corresponding to the points shown in Fig. 12. When the specimen Fe90Ca10 was cooled, the magnetite (Fe3O4) crystal in a needle-like shape was first precipitated from the molten oxide by the reaction L → L + WF. The needle-like crystals were aligned in a triangular relationship, which is reasonable considering their crystallographic features: the “spinel-type” fcc structure. This was consistent with a weak diffraction peak corresponding to {hkl} = {006} was observed in the L + WF region (Figs. 10(c) and 10(d)). The overcooling temperatures ΔT iL → L + WF for the cooling rate of (i) −3.3 K/s and ΔT iiL → L + WF for (ii) −8.3 × 10⁻¹ K/s were −63 and −36 K, respectively. The overcooling temperatures are summarized in Table 3.


On further cooling, the initially precipitated magnetite grew into larger grains in a short period of 3–8 s by the reaction L + WF → L + F (Figs. 11(i-2) and 11(ii-2)). The overcooling temperatures : ΔT iL + WF → L + F and ΔT iiL + WF → L + F are shown in Table 3. At the faster cooling rate (i) −3.3 K/s, the precipitated grains were in triangular in shape, as shown in Fig. 11(i-2), while at the slower cooling rate (ii) −8.3 × 10⁻¹ K/s , the grains seemed to be more random in shape, as shown in Fig. 11(ii-2). This is because with a slower cooling rate, the magnetite (Fe3O4) precipitates change their morphology by transformation from magnetite to hematite (Fe2O3) more easily, and the slower cooling rate allows the molten oxide precipitate around the triangular crystals and form crystals that are more random in shape.
On further cooling, the solid–solid reaction CF2 + F → CF + F occurred, which was clearly observed in situ by Q-XRD as mentioned above. The overcooling temperatures of this reaction for the cooling rate (ii) −8.3 × 10⁻¹ K/s and (iii) −8.3 × 10⁻² K/s are −16 K and −8 K (Table 3).
Quantitative observation of overcooling for sintering that was first revealed by in situ Q-XRD and the laser microscopy is well understood by the continuous cooling transformation (CCT) concept, widely known in the area of heat treatment of steel.25) Figure 12 shows the first CCT diagram for sintering of the specimen Fe90Ca10. Solid lines show the time-temperature curves for cooling rates: (i) −3.3 K/s, (ii) 8.3 × 10⁻¹ K/s, and (iii) −8.3 × 10⁻² K/s. Dotted thin lines (blue) show the temperatures of phase transformation at equilibrium: L→ L + WF, L + WF → L + F, L + F → CF2 + F, and CF2 + F → CF + F. ΔTxY denotes the overcooling temperature of the reaction X when cooled down with a rate of Y (= i, ii, or iii). Broken lines (red) show those of L → L + WF and L + WF → L + F under non-equilibrium cooling conditions determined in this study. The dotted bold line (red) shows that of L + F → CF2 + CF + F under non-equilibrium cooling conditions determined in this study. Boundaries determined by laser microscopy are shown by diamonds. Cross marks show the time and temperature where typical microstructures obtained by in situ laser microscopy are shown in Fig. 11.
The CCT diagram (Fig. 12) clearly shows the following points:
(1) Overcooling temperature (ΔTXY) for a specific reaction X during cooling at a cooling rate Y decreases as the cooling rate decreases;
|
Δ
T
X
i
> Δ
T
X
ii
> Δ
T
X
iii
,
|
where (i) −3.3 K/s, (ii) −8.3 × 10
−1 K/s, and (iii) −8.3 × 10
−2 K/s.
(2) Overcooling temperatures (ΔTXY) for different reactions X during cooling at a specific cooling rate Y are as follows
|
Δ
T
L + F→CFx + F
Y
<<Δ
T
L →L + WF
Y
<Δ
T
L + WF→L + F
Y
,
|
where (i) −3.3 K/s, (ii) −8.3 × 10
−1 K/s, and (iii) −8.3 × 10
−2 K/s.
The point (1) is quite reasonable considering the reaction scheme of sintering (Fig. 1(b)), where the reactions: L → L + WF, L + WF → L + F, and L + F → CFx + F are the precipitation of solid phase (WF and F) from the molten oxide.
The point (2) can be understood in terms of the enthalpy difference ΔH for three reactions. The ΔH values estimated using the thermodynamic calculation package (FactSageTM) were as follows: L → L + WF: ca. 10 kJ/mol, L + WF → L + F: ca. 5 kJ/mol, and L + F → CF2 + F: ca. 25 kJ/mol. When an enthalpy difference ΔH is small, a larger overcooling temperature ΔT is generally expected.
The CCT diagram for sintering provides crucial and fundamental information on the sintering accompanying solidification, precipitation, and formation of calcium ferrites from the molten oxide. Expected typical conditions for industrial sintering processes2,4,7,8,9) are shown by the hatching area in Fig. 12. In the hatched area, the transition temperature for the reactions L + WF → L + F and L + F → CF2 + F heavily depend on the cooling rate. In other words, it is expected that a slight change in the cooling pattern results in the phase fraction of the coexisting phases and their microstructure in final sinters after processed. Thus, on the basis of the CCT diagram, one can design the ideal heating pattern that determines the final microstructure, which can be realized through the optimization of the heating and cooling conditions by controlling the amount of coke breeze or their burning patterns, and so on. This would be of great help to understand the inhomogeneity of reaction conditions such as temperature, oxygen partial pressure, and chemical composition in the regions among coagulated particles in industrial sintering processes, which have not been fully understood yet.
5. Conclusion
In this study, the formation of calcium ferrites during heating and cooling was investigated by in situ and real-time observation using a newly developed system, i.e., “quick X-ray diffraction (Q-XRD),” and an in situ laser microscope.
(1) In the new Q-XRD, a specimen was heated up to 1773 K, and X-ray diffraction patterns were measured using a pixel-array area detector with an interval as short as a few seconds.
(2) The specimens Fe2O3: CaO = 64:36, 80:20, and 90:10 (mass%) were heated up from 300 to 1773 K at 5.0 × 10⁻¹ K/s, and cooled down to 300 K with different cooling rates: −3.3 K/s, −8.3 × 10⁻¹ K/s, and −8.3 × 10⁻² K/s, for simulation of industrial processes. Reaction schemes are basically the same as expected from the quasibinary phase diagram, but in situ observation both of crystal structure and microstructure successfully revealed the effects of heating and cooling rates on the sintering reaction in the CaO–Fe2O3 system with special attention to overheating and overcooling phenomena.
(3) The first continuous cooling transformation (CCT) concept for iron ore sintering was proposed to understand overcooling phenomena when the molten oxide cooled down to room temperature and magnetite (Fe3O4), hematite (Fe2O3), and various types of calcium ferrite were formed. The CCT diagram for sintering provides crucial and fundamental information on the sintering accompanying solidification, precipitation, and formation of calcium ferrites from the molten oxide, and can be used as a guideline for controlling sintering processes.
Acknowledgments
We are very grateful to Mr. N. Ohta at Nippon Steel & Sumikin Technology for providing experimental support. Q-XRD and laser microscope experiments were performed with technical assistance from Rigaku Corp. and YONEKURA MFG Co., LTD., respectively.
References
- 1) S. N. Ahsan, T. Mukherjee and J. A. Whiteman: Ironmaking Steelmaking, 10 (1983), 54.
- 2) T. Mukherjee and J. A. Whiteman: Ironmaking Steelmaking, 12 (1985), 151.
- 3) P. R. Dawson, J. Ostwald and K. M. Hayes: Trans. Inst. Min. Metall., C 94 (1985), 71.
- 4) G. O. Egundebi and J. A. Whiteman: Ironmaking Steelmaking, 16 (1989), 379.
- 5) L. Lu, R. J. Holmes and J. R. Manuel: ISIJ Int., 47 (2007), 349.
- 6) J. Gröbner, N. S. Simona Delsante and V. Tomashik: Calcium – Iron – Oxygen, The Landolt-Börnstein Database, Springer, Berlin, (2008).
- 7) Y. Hida, J. Okazaki, K. ltoand and M. Sasaki: Tetsu-to-Hagené, 73 (1987), 1893.
- 8) T. Inazumi: Iron ore sinter -Review of Steps Taken to Overcome the Challenges Posed Japan’s Lack of Iron Ore Resources- (in Japanese), ISIJ, Tokyo, (2000).
- 9) S.-J. L. Kang: SINTERING Densification, Grain Growth & Microstructure, Elsevier, Oxford, (2005).
- 10) F. Matsuno and T. Harada: Trans. Iron Steel Inst. Jpn., 21 (1981), 318.
- 11) A. Yazawa, Y. Takeda and Y. Waseda: Can. Metall. Q., 20 (1981), 129.
- 12) G. J. Redhammer, G. Tippelt, G. Roth and G. Amthauer: Am. Mineral., 89 (2004), 405.
- 13) D. F. K. Becker, J. S.: Acta Crystallogr., 10 (1957), 332.
- 14) E. Millon, J. F. Brice, O. Evrard, B. Malaman, R. Gerardin and A. Bonazebi: Mater. Res. Bull., 21 (1986), 985.
- 15) O. G. Karpinskii and A. V. Arakcheeva: Dokl. Akad. Nauk SSSR, 282 (1985), 1139.
- 16) B. Malaman, H. Alebouyeh, F. Jeannot, A. Courtois, R. Gerardin and O. Evrard: Mater. Res. Bull., 16 (1998), 1139.
- 17) O. Evrard, B. Malaman, F. Jeannot, A. Courtois, H. Alebouyeh and R. Geradin: J. Solid State Chem., 35 (1980), 112.
- 18) Y. Hida, T. Miyazaki, M. Sasaki, H. Soma, K. Sato, H. Naito, M. Kagawa and M. Taniguchi: Nippon Steel Tech. Rep., 35 (1987), 59.
- 19) N. V. Y. Scarlett, M. I. Pownceby, I. C. Madsen and A. N. Christensen: Metall. Mater. Trans. B, 35 (2004), 929.
- 20) A. S. Nathan, M. I. Webster, I. Pownceby, C. Madsen and J. A. Kimpton: Metall. Mater. Trans. B, 43 (2012), 1344.
- 21) Y. Kashiwaya, C. E. Cicutti and A. W. Cramb: ISIJ Int., 42 (1998), 357.
- 22) B. Henrich, A. Bergamaschi, C. Broennimann, R. Dinapoli, E. F. Eikenberry, I. Johnson, M. Kobas, P. Kraft, A. Mozzanica and B. Schmitt: Nucl. Instrum. Method. Phys. Res., A607 (2009), 247.
- 23) P. Kraft, A. Bergamaschi, C. Broennimann, R. Dinapoli, E. F. Eikenberry, B. Henrich, I. Johnson, A. Mozzanica, C. M. Schlepütz, P. R. Willmotta and B. Schmitt: J. Synchrotron Rad., 16 (2009), 368.
- 24) T. L. B. D. Springer Materials, Physical Properties of Al2O3, The Landolt-Börnstein Database, Springer, Berlin, (2011).
- 25) W. C. Leslie: Heat-Treated Steels, The Physical Metallurgy of Steels, McGraw-Hill Book Company, New York, (1981).