Abstract
COURSE50 (CO2 ultimate reduction in steelmaking process by innovative technology for Cool Earth 50) carried out COG and reformed COG (RCOG) injection operation trials at LKAB’s experimental blast furnace in Luleå in cooperation with LKAB and Swerea MEFOS. Operation trials were successfully carried out. Input of C in both COG and RCOG injection periods decreased comparing the base period, because of increase in H2 reduction instead of C direct reduction that is a huge endothermic reaction. However poor penetration depth of injected gas from shaft tuyere made furnace efficiency worse. Hot top gas injection increased temperature of top gas and upper part of the furnace. Efficiency of hot top gas injection was not clear as sinter degradation did not occur in the base period.
1. Preface
COURSE50 (CO2 ultimate reduction in steelmaking process by innovative technology for Cool Earth 50) is a national project for development of technologies for environmentally harmonized steelmaking process to achieve drastic CO2 emissions reduction in steel industry.1,2) The consortium consists of the six partners; Nippon Steel Corporation, Kobe Steel, JFE Steel Corporation, Nisshin Steel Company, Sumitomo Metals and Nippon Steel Engineering (Nippon Steel and Sumitomo Metals have merged to Nippon Steel and Sumitomo Metal Corporation in October, 2012), and initiated within The Japan Iron and Steel Federation (JISF) and financed by NEDO. The project started 2008 fiscal year and will complete 2012 fiscal year as Step 1 of Phase 1 (Step 2 of Phase 1 will be completed 2017 fiscal year).
Main targets of COURSE50 project are development of technologies to reduce CO2 emissions from blast furnace and development of technologies to capture, separate and recover CO2 from blast furnace gas. CO2 reduction technology from blast furnace consists of research of control reactions for reducing iron ore with hydrogenous reducing agents such as coke oven gas (COG) or reformed COG (RCOG). RCOG is amplified its hydrogen content in COG by utilizing newly developed catalyst and unused waste heat. Also a technology to produce high strength and high reactivity coke for reduction with hydrogen is under development.
RCOG will be injected to the blast furnace through tuyeres located at lower part of the shaft of blast furnace, and COG will be injected through blast tuyeres to utilize CH4 combustion.
Amount of O2 enrichment to the hot blast air has to be increased when COG is injected to the blast tuyere to maintain the flame temperature constant to compensate for heat of decomposition of hydrocarbon. It results in decrease in upper part temperature and decreased upper part temperature prolongs the residence time for sinter where disintegration is promoted. In addition, H2 may promote sinter deterioration. To prohibit prolonged residence time for sinter at low temperature range, top gas is partly combusted is injected in the upper shaft for temperature control. We call it hot top gas injection in this article.
Basic and remarkable results are conducted through various laboratory tests and mathematical model calculation in COURSE50 project.3,4) H2 in COG or RCOG is expected to react with ferrous material very fast and to replace C as reducing agent of blast furnace.
However, reaction in the blast furnace is much complicated because it is dominated by burden and gas distribution those are depending each other. And consideration of penetration behavior of injected COG or RCOG is most important. So COURSE50 decided operation trial in experimental blast furnace as an integrated evaluation for the project.
Studies of ironmaking process using experimental blast furnaces were performed from early 20th century.5) Around 1960’s, operation tests using taconaite pellets or natural gas injection were studied at the experimental blast furnace of U. S. Bureau of Mines. Its inner volume was 8.5 m3.6) European steelmakers constructed 24.6 m3 experimental blast furnace in Belgium in 1953, and carried out operation tests under high pressure or injection of oil of methane.6)
In Japan, first basic experimental blast furnace was constructed at Nittetsu laboratory in Higashida in 1934. Its inner volume was 0.6 m3 equipped four tuyeres, production rate was 1.0 t/day and coke rate was 1.7 t/thm.7) In 1955 0.8 m3 experimental blast furnace was constructed in Tokyo University and was blown off in 1981 after 29 campaigns.7) Operation with various ferrous material or coke and natural gas or lime stone injection tests were performed, and production rate was 3.9 t/day and coke rate was 622 kg/thm in the 25th campaign.
NKK constructed a 0.63 m3 experimental blast furnace in 1967.8) Experimental blast furnace was up-scaled to inner volume of 3.2 m3 with hearth diameter of 0.8 m and height of 5.5 m for the purpose of operation tests of reduction gas injection in 1970. And then NKK’s experimental blast furnace was converted to inner volume of 3.9 m3 with hearth diameter of 0.95 m and started cold oxygen blasting operation tests in 1983.9)
There are two operating experimental blast furnaces at present in Japan and in Sweden. Japanese furnace is in Hasaki Laboratory of Nippon Steel and Sumitomo Metal Corporation, 3.0 m3 inner volume. Various operation tests such as Shaft Cupola process,10) high PCR injection, PC and powder ore simultaneous injection or high Al2O3 slag operation have been performed.11,12,13,14)
Another operating experimental blast furnace is located in Luleå owned by LKAB (Luossavaara-Kiirunavaara Aktiebolag), Swedish mining company, constructed in 1997.15,16) Already 25 campaigns were successfully carried out until 2010 winter at the LKAB’s experimental blast furnace supported by Swerea MEFOS. As it has relatively a big diameter that consideration of penetration behavior of injected gas is possible, COURSE50 decided to carry out test campaign at LKAB’s experimental blast furnace.
The main objectives of experimental blast furnace trial are to investigate and evaluate the potential in replacing coke and coal as reducing agents in the blast furnace with high H2 containing gas as COG or reformed COG, and also effects of hot top gas injection on temperature of upper part of the blast furnace and on sinter disintegration.
2. Experimental Conditions at LKAB’s Experimental Blast Furnace
2.1. LKAB’s Experimental Blast Furnace
Working volume of LKAB’s experimental blast furnace is 9.0 m3 and throat diameter (stock level) and hearth diameter are 1.0 m and 1.4 m respectively. Three blast tuyeres, a unique bell-less charging system, ore and coke bins, and injection system are equipped. Hot blast air is heated by pebble heaters up to 1200°C. PC, oil or various gases can be injected from the blast tuyeres.
Two horizontal shaft probes, upper and lower, measure radial temperature distribution and collect material in the furnace. And an inclined probe collects material partly from lower shaft and partly from cohesive zone, and vertical probes measure inner vertical temperature and pressure distribution from the top.
The levels of the burden, upper shaft tuyeres, lower shaft tuyeres and blast tuyeres are 7.65 m, 6.20 m, 4.19 m and 1.95 m from the hearth bottom level respectively. And the level of the upper shaft probe and the lower shaft probe are 6.75 m and 5.35 m from the hearth level respectively, so the upper shaft prove is located 0.90 m below the burden level and is located 4.80 m above the blast tuyeres, and the lower shaft probe is located 2.30 m below the burden level, 3.40 m above the blast tuyeres. Temperature of refractory and skinflow are measured by thermocouples.
2.2. Gas Injection
Synthetic COG and RCOG were mixed from pure gases to control constant and accurate gas composition through the trial operation for the main purpose of evaluating the effects of H2 reaction. COG was injected from blast tuyeres and RCOG injected from three lower shaft tuyeres 2.24 m above the blast tuyeres.
COG gas composition was 57%H2-31.3%CH4-11.7%N2, and its injection rate was 100 Nm3/thm (150 Nm3/h).
Two kinds of gas composition for RCOG were injected, 77.9%H2-22.1%N2 and 77.9%H2-10%CO-12.1%N2. When CO was contained, maximum 100 ppm of H2S was added to decrease the C deposition.
RCOG injection rate was 150 Nm3/thm (225 Nm3/h) with 77.9%H2-22.1%N2 mixed gas at the first stage of the operation, then injection rate was raised up to 200 Nm3/thm (300 Nm3/h) and CO was added. Volumes of input H2 in 100 Nm3 of COG and in 150 Nm3 of RCOG are approximately the same level.
RCOG penetration depth into the furnace was detected using the lower shaft probe above the shaft tuyere.
The RCOG was heated and was injected to the blast furnace using a counter-current heat exchanger and then injected to the furnace. The heat exchanger consists of two parts. In the upper counter-current heat exchanger the flue gas from the combustion chamber flows in the pipes while RCOG that surrounds was heated. After then RCOG flows into the pipes of the tube basket, the second co-current heat exchanger at a temperature of 650–760°C and reaches maximum of 925°C. When RCOG was injected to the blast furnace its temperature was cooled down around 800°C level because of heat loss.
The co-axial type swirl-tip lances installed in blast tuyeres were used for COG and PC injection. PC was injected in the central part with N2 as carrier gas and COG was injected in the outer part. Diameter of the shaft tuyere was 32 mm; the gas velocity was approximately 60 m/s at an injection rate of 300 Nm3/h of RCOG.
Top gas was collected and was cleaned through a cyclone and a filter, then a compressor increases the pressure above the internal shaft pressure. Three ceramic burners were installed at three injection tuyeres (upper shaft tuyeres), 1.45 m below the burden level and 0.55 m below the upper probe level, and top gas with about 20% oxygen synthetic air was combusted for the pre-heating of top gas. Hot top gas temperature was controlled at 800°C by addition of cold top gas and injected. Each upper shaft tuyeres was equipped with a camera and a light in order to watch the disintegration and movements in the sinter bed. Thermocouples were installed for monitoring of temperatures. Two are above, one is left and right each, and one or two are below the injection points.
All the upper shaft tuyeres, lower shaft tuyeres and blast tuyeres were installed in the same directions. Conditions of COG, RCOG and hot top gas injection are summarized in Table 1.
Table 1. Conditions of COG, RCOG and hot top gas injection.
| Composition | Injection Position (number) | Injection Rate | Injection Temperature |
|---|
| COG | 57%H2+31.3%CH4+11.7%N2 | Blast Tuyers (3) | 100 Nm3/thm (150 Nm3/h) | RT |
| RCOG | 77.9%H2-22.1%N2 | Lower Shaft Tuyeres (3) | 150 Nm3/thm (225 Nm3/h) | 770°C |
| 200 Nm3/thm (300 Nm3/h) |
77.9%H2-10%CO-12.1%N2
(78 ppmH2S) | 200 Nm3/thm (300 Nm3/h) |
| HTG | Combusted BFG | Upper Shaft Tuyeres (3) | 100 Nm3/t | 800°C |
| (CO/(CO+CO2)>0.05) |
A mixed burden of 70% sinter and 30% of acid pellet was used during the campaign. In order to adjust the final slag basicity, a small amount of lumpy quartzite was added to the burden.
Sinter was transported and screened into sizes larger than 4 mm and less than 40 mm before filling into the storage bins. Quality of sinter was generally stable. Examples of chemical compositions of sinter are shown in Table 2.
Table 2. Chemical composition of sinter.
| Total Fe
(wt%) | FeO
(wt%) | SiO2
(wt%) | Mn
(wt%) | P
(wt%) | TiO2
(wt%) | Al2O3
(wt%) | CaO
(wt%) | MgO
(wt%) | CaO/SiO2
(–) | Average Dp
(mm) |
|---|
| 30th April–6th May | 57.7 | 9.23 | 4.75 | 0.3 | 0.03 | 0.07 | 1.23 | 9.30 | 1.43 | 1.96 | 10.5 |
| 7th May–11th May | 58.3 | 9.33 | 4.52 | 0.3 | 0.02 | 0.06 | 1.21 | 8.75 | 1.65 | 1.94 | 8.9 |
The olivine pellet was used during start up week and the acid pellet was used as the mixed sinter and pellet burden. The pellet is a standard LKAB product produced in the pellet plant in Kiruna. Chemical compositions of pellets are summarized in Table 3.
Table 3. Chemical composition of pellet.
| Total Fe
(wt%) | SiO2
(wt%) | Mn
(wt%) | P
(wt%) | TiO2
(wt%) | Al2O3
(wt%) | CaO
(wt%) | MgO
(wt%) | CaO/SiO2
(–) | Average Dp
(mm) |
|---|
| Olivine Pellet 16–22 April | 66.7 | 1.93 | 0.04 | 0.008 | 0.29 | 0.36 | 0.44 | 1.39 | 0.23 | – |
| Acid Pellet 7–11 May | 66.7 | 2.68 | 0.05 | 0.024 | 0.19 | 0.25 | 0.57 | 0.66 | 0.21 | 10.6 |
Both sinter and pellet were transported in bags or in covered trucks and were stored inside a storage facility to avoid increase in moisture contents due to rain or snowfall. During whole test operation, sinter and pellets were collected everyday and were analyzed moisture content and particle size distribution.
Used coke and pulverized coal (PC) were produced at the SSAB plant in Luleå. Chemical composition of PC is shown in Table 4. Size of coke was 15–30 mm.
Table 4. Chemical composition of pulverised coal.
C
(wt%) | SiO2
(wt%) | Al2O3
(wt%) | CaO
(wt%) | TiO2
(wt%) | MgO
(wt%) | Mn
(wt%) | P
(wt%) | Fe
(wt%) | Na2O
(wt%) | K2O
(wt%) |
|---|
| 82.9 | 3.24 | 1.80 | 0.37 | 0.06 | 0.16 | 0.015 | 0.017 | 0.61 | 0.04 | 0.10 |
After all injection tests finished, basket samples containing coke and sinter were charged and then the furnace was quenched by injection of cold N2. Approximately two weeks later when furnace cooling completed excavation study was carried out.
As all baskets were labeled before charging, obtained baskets from the furnace during excavation can be distinguished each other. Mesh sizes of the baskets were adjusted to gas to come in and particle not to go out. Then, the reaction behavior of coke and sinter in the furnace at various height level was studied.
Total of 12 basket rows containing sinter and 8 basket rows containing coke were charged over 19 different layers before quenching. Four kinds of coke were contained in each basket. The baskets were charged at two positions, either towards the east side or towards the west side of the experimental blast furnace. Baskets containing sinter were charged to stay at the upper part of the blast furnace, considered to be the major reaction region. Also baskets containing coke were charged to stay at the lower part of the blast furnace. Dimension of each basket was 60 mm diameter and 150 mm length, three baskets filled with sinter, or two baskets filled with coke and an empty one were connected in-series. Baskets used for coke had double structure to avoid coke fine dissipation.
Excavation samples were collected over the radius at 6 positions. The sinter and pellets samples from every third ferrous layer were analyzed and their reduction and metallization degree determined based on chemical analyses. Figure 1 shows the sampling positions during excavation.
3. Results and Discussions
3.1. Outline of Test Operation
The test operation started on 16th of April and finished on 11th of May. Target PC rate was 128 kg/thm. Hot metal production was almost constant through the trial.
The first period of the trial was seven days start-up using pellet as ferrous material. Next, operation transferred to reference period for five days using 70% sinter and 30% pellet. Small coke was mixed to sinter and pellet and charged. Burden distribution was controlled to keep heat level at the first stage of reference period.
After stable condition was obtained, COG injection from the blast tuyeres started on 28th of April. Injection rate was 100 Nm3/thm (150 Nm3/hr). Oxygen enrichment was adjusted to maintain constant flame temperature. PCI decreased instead of COG injection at the first stage, then coke rate decreased. Soot was observed in dust collected from furnace top just after COG injection.
Pre-heated RCOG injection started on 6th of May. Injection rate was 150 Nm3/thm (225 Nm3/h) with the chemical composition of 77.9%H2-22.1%N2 at the beginning of the injection, then injection rate was raised up to 200 Nm3/thm (300 Nm3/h), and final chemical composition was 77.9%H2-10%CO-12.1%N2.
Hot top gas was injected from the upper shaft tuyeres during both COG and RCOG injection period. Injection rate was 100 Nm3/thm (150 Nm3/hr) in each case. Increase in top gas temperature was detected by quantity of automatically sprayed cooling water for protect the furnace.
3.2. Mass Balance Calculation of Operation
Table 5 shows the operational data of reference period, COG injection period and RCOG injection (150 Nm3/thm) period. Although operation condition had some fluctuation because of relatively short time schedule, day data regarded as in stable condition were selected and were averaged over 24 hours for each period. Tapping or burden data were adjusted with time shifting.
Table 5. Operational data of reference period, COG injection period and RCOG injection period.
| Reference | COG Inj. | RCOG Inj. |
|---|
| Production | t/d | 36.0 | 36.5 | 36.3 |
| Coke Rate | kg/thm | 450 | 432 | 435 |
| PC Rate | kg/thm | 130 | 123 | 128 |
| RAR (CR+PCR) | kg/thm | 580 | 555 | 563 |
| COG injection | kg/thm | 0 | 99 | 0 |
| RCOG injection | kg/thm | 0 | 0 | 149 |
| Blast Air Volume | Nm3/thm | 1057 | 982 | 972 |
| O2 Enrichment | % | 5.9 | 7.8 | 6.9 |
| Blast Temperature | Degree C | 1129 | 1126 | 1124 |
| Blast Moisture | g/Nm3 | 23.4 | 24.0 | 23.2 |
| TFT | Degree C | 2218 | 2202 | 2243 |
| Hot Metal Temperature | Degree C | 1446 | 1414 | 1451 |
| Eta CO | % | 42.2 | 40.7 | 41.5 |
| Eta H2 | % | 38.2 | 42.2 | 34.6 |
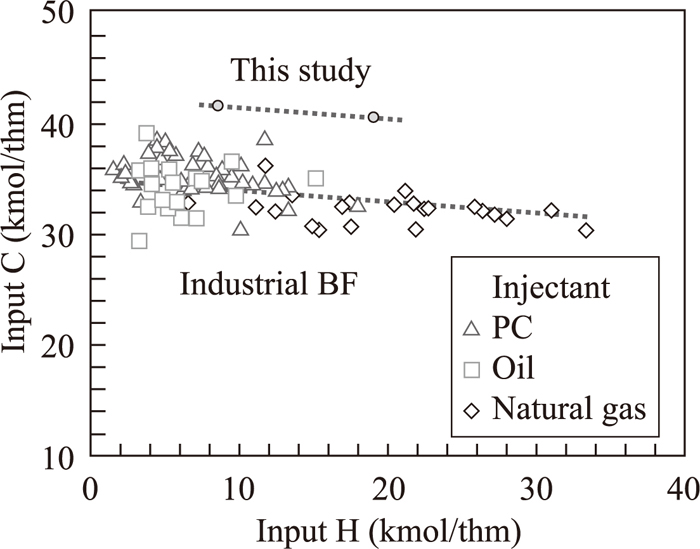
Input C and input H during operation are plotted in Fig. 2 with the results in industrial blast furnace injected high H2 content gases.17,18,19,20,21,22,23,24,25) Effect of input H on input C in this study almost matches to the industrial furnace data.
Coke rate and reducing agent rate decreased in both COG injection period and RCOG injection period. CO gas utilization efficiency (eta CO) decreased in both COG injection period and RCOG injection period. H2 gas utilization efficiency (eta H2) increased in COG injection period, while it decreased in RCOG injection period.
Mass balance between input and output terms was calculated. Shaft efficiency and heat loss were adjusted to match the operation results using RIST model and direct reduction and indirect reduction balance were calculated.
Authors used a modified RIST model for the purpose of mass and heat balance calculation of shaft gas injection. Process zone is divided into two regions; those are RCOG flow region and no RCOG region. Mass and heat balance calculation was done about each region and the results are integrated. Ratio of those regions is calculated from RCOG penetration depth data.
Figure 3 shows the change in fraction of reduction degree in each cases. Comparing reference period, H2 reduction increased while C direct reduction and CO reduction decreased in both injection periods. Increase in H2 reduction is considered due to the fast reaction rate of H2 reduction, and H2 reduction replaced C direct reduction and CO reduction. As C direct reduction is a huge endothermic reaction, decrease in it is the main reason of reduction of input of C.
3.3. Radial Distribution of Injected Gas
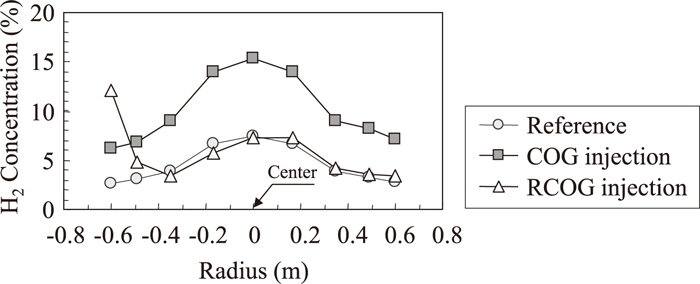
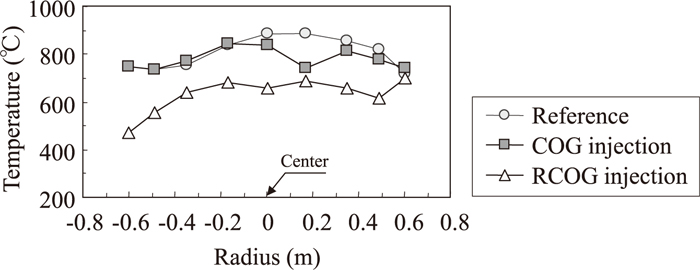
Radial distribution of H2 concentration measured by upper shaft probe and lower shaft probe are shown in Figs. 4 and 5. In these figures, COG or RCOG were injected from the left side. The H2 concentration at the center are the highest, and are the lowest near the furnace wall both in the reference period and in the COG injection period. And the H2 concentration distribution in COG injection period was uniformly higher than the reference period. On the other hand, H2 concentration only near the shaft tuyere was high in RCOG injection period. Figures 6 and 7 show the temperature distribution measured by upper shaft probe and lower shaft probe. The temperature distribution in the reference period and COG injection period are almost the same, while temperature near the shaft tuyere was low in RCOG injection.
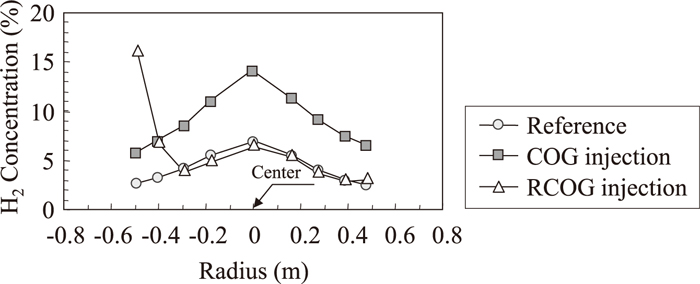
These data means that the gas from the blast tuyere goes into the furnace center because of relatively big raceway depth, while RCOG from the shaft tuyere immediately reduced ferrous material but it did not go into the packed bed. So authors investigated the penetration depth of injected gas into a coke packed bed is dominated by convection.
Equation (1) is derived as injected gas will expand until gas velocity coincides with bosh gas velocity. So, the penetration depth r is described as Eq. (2),
|
V
RCOG
/(
3
2
π
r
2
)
=(
V
shaft
+
V
RCOG
)
/(
1
2
π
R
2
)
| (1) |
|
r=R*
2
3
(
V
RCOG
V
shaft
+
V
RCOG
)
| (2) |
Where R is furnace radius, VRCOG and Vshaft are volume rate of RCOG and shaft gas respectively. Calculation result of r/R using operational condition is 0.22~0.28, it corresponds to the shaft probe measurement result described above. Increase in penetration depth of RCOG shaft injection is expected to improve gas utilization.
3.4. Hot Top Gas Injection
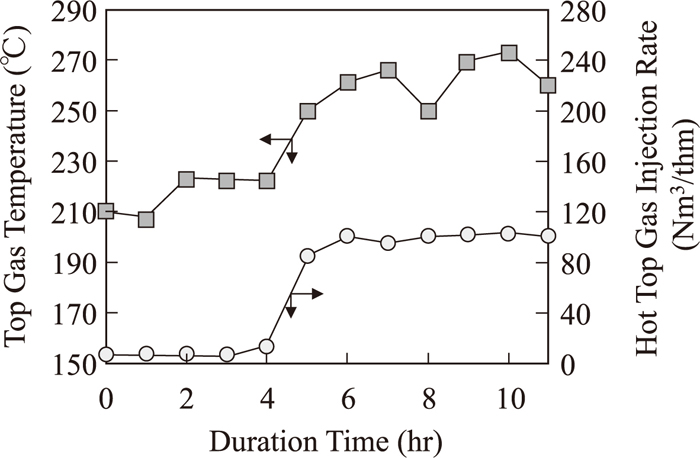
Figure 8 shows the change in hot top gas injection rate and top gas temperature. Top gas temperature was calculated by latent heat of sprayed cooling water. Top gas temperature increased just after hot top gas injection started.
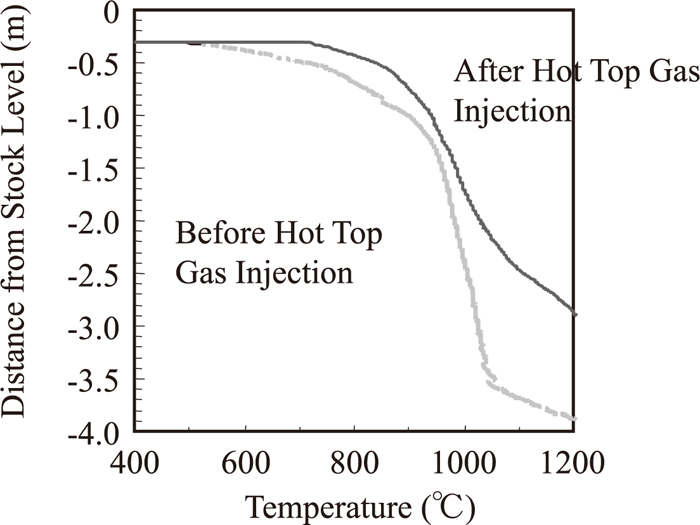
Figure 9 shows the vertical temperature distribution measured by a vertical probe during RCOG injection period with or without hot top gas injection. Temperature rose up 24 hours after hot top gas injection started. This was caused by decrease in heat flux ratio that is a ratio of heat flux of descending materials and that of up-going gas.
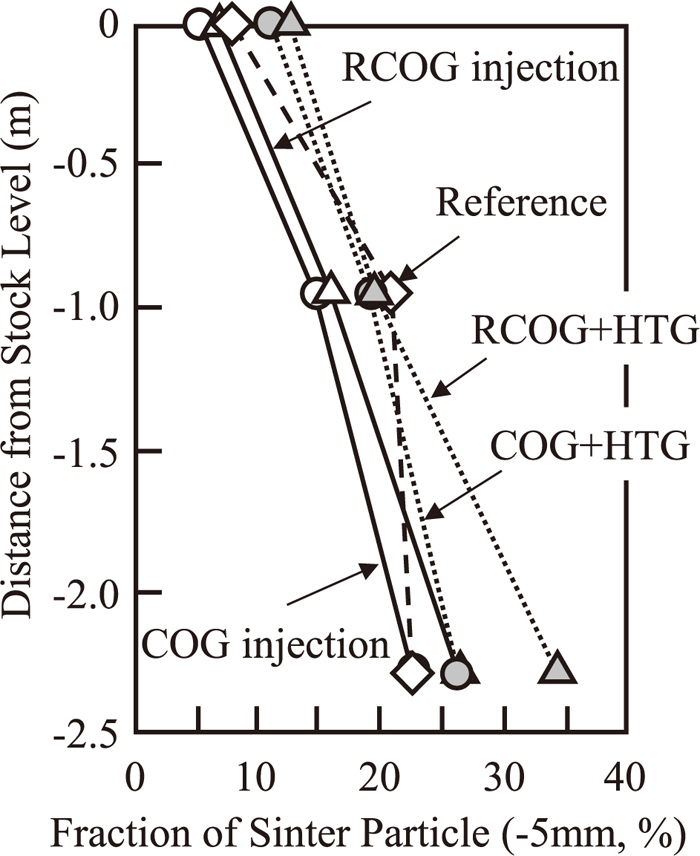
Change in sinter particle ratio collected at probe sampling is shown in Fig. 10. Fraction of sinter particle increased as lower part of the furnace. There cannot be seen big differences between base, COG or RCOG gas injection, nor with or without hot top gas injection. It is because heat flux ratio was already low in base condition, sinter degradation did not occur then.
4. Excavation Results
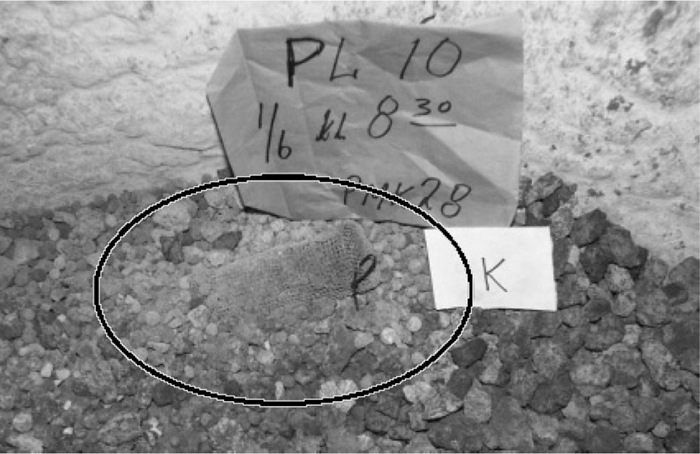
Out of the 12 charged sinter basket rows, 11 were found, 5 of the 8 charged coke basket were found. 31 identifiable basket rows or parts of baskets rows were recovered during the excavation. When baskets were found in a layer, they were photographed and their position was measured. The baskets are then removed from the furnace and identified. Figure 11 shows an example of situation of recovered basket.
Information about the layer, for example comments about the surface, scaffolds or channels are noted at each layer. At layers with large amount of coke in the centre, no iron ore samplings could be done in the center of the experimental blast furnace conducted by used charging pattern.
White area above the injection position of hot top gas burner 3 and shaft tuyere number 3 were observed. No signs of wear caused by the injection were found at the injection points inside the shaft.
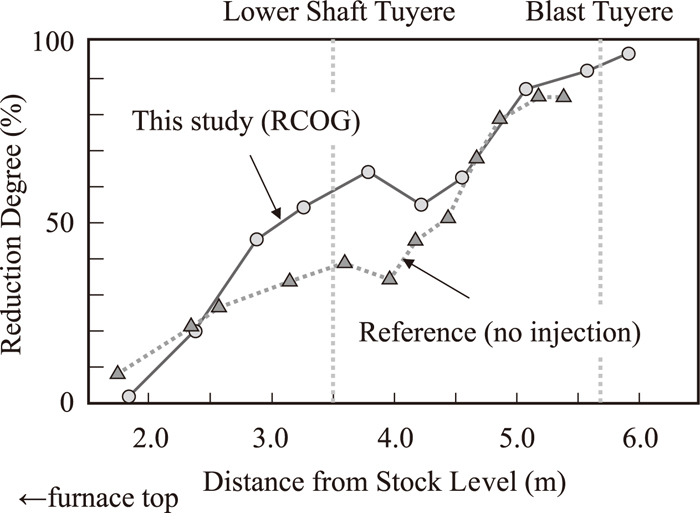
Vertical distribution of reduction degree of sinter collected in the shaft is shown in Fig. 12. Reduction degree of pellets in reference operation, without neither RCOG nor COG injection, is additionally plotted. Reduction degree of this operation is clearly higher than reference, especially around the RCOG injection level. Reason that reduction degree below the lower shaft tuyere is also high may be due to descending of inner material after operation finished.
Figure 13 shows the observed cohesive zone derived from excavation. Cohesive zone in this study (b) shows less thickness and less height than reference (a). Laboratory test results showed that H2 reduction causes quick reduction and maintenance ore shape until high temperature.
5. Conclusion
Operation trial with highly H2 containing gas injection, such as COG and reformed COG (RCOG), were performed in experimental blast furnace by cooperation of COURSE50, LKAB and Swerea MEFOS.
Operation trials were successfully carried out after performance of all planned experimental conditions. Input of C in both COG and RCOG injection periods decreased comparing the base period, because of increase in H2 reduction instead of C direct reduction that is a huge endothermic reaction. However poor penetration depth of injected gas from shaft tuyere made furnace efficiency worse.
Hot top gas injection increased temperature of top gas and upper part of the furnace. Efficiency of hot top gas injection was not clear as sinter degradation did not occur in the base period.
Acknowledgement
This study was carried out as a national project for development of technologies for environmentally harmonized steelmaking process, ‘COURSE50’. The authors are grateful to the New Energy and industrial Technology Development Organization (NEDO).
References
- 1) T. Miwa and H. Okuda: J. Jpn. Inst. Energ., 89 (2010), 28.
- 2) T. Miwa and K. Kurihara: Steel Res. Int., 82 (2011), 466.
- 3) K. Higuchi, S. Matsuzaki, A. Shinotake and K. Saito: CAMP-ISIJ, 24 (2011), 186.
- 4) K. Higuchi, S. Matsuzaki, A. Shinotake and K. Saito: CAMP-ISIJ, 25 (2012), 886.
- 5) T. Yasumoto: “Yokoro Seisen-ho”, Sangyo-Tosho, Tokyo, (1954), 318.
- 6) M. Tachi: Kinzoku, 33 (1963), 36.
- 7) M. Tachi: Tetsu-to-Hagané, 70 (1984), 1501.
- 8) R. Ando, T. Miyashita, T. Shimotsuma, T. Kaburagi and Y. Yamada: Nippon Kokan Giho, No.54 (1971), 471.
- 9) Y. Ono, H. Hotta, M. Matsuura, T. Ariyama, H. Mitsufuji, H. Saito, T. Kamoshida, N. Saito and H. Ito: Tetsu-to-Hagané, 73 (1987), S80.
- 10) T. Miyazaki, H. Yamaoka, Y. Kamei and F. Nakamura: Sumitomo Kinzoku, 44 (1992), No. 1, 103.
- 11) Y. Kamei, T. Miyazaki and H. Yamaoka: Tetsu-to-Hagané, 79 (1993), 449.
- 12) C. Yamagata, S. Suyama, O. Horisaka and Y. Kajihara: CAMP-ISIJ, 4 (1991), 142.
- 13) K. Sunahara, M. Hoshi, K. Nakano, T. Inada and T. Yamamoto: CAMP-ISIJ, 16 (2003), 136.
- 14) K. Nakano, K. Sunahara, M. Hoshi, T. Inada and T. Yamamoto: CAMP-ISIJ, 16 (2003), 137.
- 15) A. Dahlstedt, M. Hallin and M. Tottie: Proc. of SCANMET1, Vol. 1, MEFOS, Sweden, (1999), 235.
- 16) G. Zuo and A. Hirsch: Rev. Metall., No.9 (2009), 387.
- 17) S. Wakuri, K. Kanamori, N. Morishita, A. Furushiro, N. Nakano and S. Wakayama: Ironmaking Conf. Proc., Vol. 40, ISS, Warrendale, PA, (1981), 112.
- 18) S. Sakurai, H. Takahashi and A. Suemori: Ironmaking Seelmaking, 10 (1983), 137.
- 19) J. C. Agarwal, F. C. Brown, D. L. Chin, G. S. Stevens, F. C. Gambol, J. R. Wandling, R. K. Clark and D. M. Smith: Ironmaking Conf. Proc., Vol. 55, ISS, Warrendale, PA, (1996), 107.
- 20) J. C. Agarwal, F. C. Brown, D. L. Chin, G. S. Stevens, F. C. Gambol and D. M. Smith: Ironmaking Conf. Proc., Vol. 57, ISS, Warrendale, PA, (1998), 443.
- 21) J. C. Agarwal, F. C. Brown, D. L. Chin, A. R. Frydenlund, N. S. Jessiman, A. P. Lingras and S. J. Sikirica: Ironmaking Conf. Proc., Vol. 51, ISS, Warrendale, PA, (1992), 139.
- 22) L. A. Byalyi, V. D. Kailov, V. A. Kostrov, A. P. Kotov and N. A. Potanichev: Steel USSR (English), 3 (1973), 977.
- 23) L. A. Byalyi, B. L. Zhurakovskii, V. A. Ulakhovich, V. I. Solodkov and A. N. Savelov: Steel USSR (English), 8 (1978), 127.
- 24) V. A. Dobroskok, Y. V. Lipukhin, I. F. Kurunov and V. N. Loginov: Steel Transl., 28 (1998), 8.
- 25) J. C. Agarwal, F. C. Brown, D. L. Chin, G. S. Stevens, D. M. Smith and W. G. Sherwood, Jr.: Ironmaking Conf. Proc., Vol. 58, ISS, Warrendale, PA, (1999), 143.