Abstract
In-situ observations of the liquid high carbon iron (HCI) and slag flows in coke bed was carried out by using high temperature X-ray fluoroscopy at 1773 K. Along with the observation, 2-dimensional multiphase computational simulations of the liquid HCI and slag flows in the coke bed was carried out to investigate the effect of the slag on the HCI flow in the coke bed. The liquid HCI cannot pass through the coke bed with the coke diameter of 3–5 mm, however, the HCI can pass through the same size coke bed if the HCI comes into contact with the slag in the coke bed. When the HCI and slag contact each other on the coke surface, the contact angle of the HCI with slag decreases and its wettability increases. On the other hand, the slag’s contact angle increases and it changes to non-wettable phase. Based on the experimental and simulation results, it is confirmed that the contact angle change due to the HCI-slag contact makes them pass though the narrow coke slit which is small enough to prevent both of the liquid phases from flowing down if they do not contact each other. Based on the capillary rise model, the driving force of the HCI penetration into the coke bed will be the energy reduction by extending area of the coke surface covered with the liquid HCI.
1. Introduction
In the lower part of blast furnace (BF), several phases coexist.1) They are gas phase (CO, CO2 and N2), liquid phases (metal and slag) and solid phases (coke, char and coal powder). Despite of its importance, the multiphase flow behaviors in the lower part of BF have not been well understood because of their complex phenomena, especially the interactions between liquid phases. In the lower part of BF, coke is the only solid material at the high temperature of more than 1773 K and it occupies about 60% of the reactor volume. The other phases such as liquid materials and gas have to pass through the coke bed by using the space between packed coke particles. Thus, the flow behaviors of the liquids and gas are highly influenced not only by their physical properties but also by the packing structure of the coke bed.
Among many concerns related to BF operations, the liquid hold-up in the coke bed or the smooth liquid flow is one of the most important factors for the stable BF operation.2,3,4,5) Usually it is known that the liquids flow as droplets or channels in the coke bed. Namely, the liquid flow behaviors in the lower part of blast furnace have to be considered and dealt as discontinuous flows.6,7) The liquid high carbon iron (HCI) and slag have different surface tension values. The typical surface tensions of the liquid HCI and the slag at around 1773 K are 1.1 N/m and 0.4 N/m, respectively.2) These different surface tensions simply suggest the different flow behaviors of the HCI and the slag in the coke bed.
It is well known that the liquid hold-up in a packed bed increases with the decrease of the bed particle size.2,3) It means that the overall resistance to the liquid flow increases with decrease of the particle size. In BF operation, the liquid hold-up growth sometimes causes serious operation problems. Once the liquid flow is deteriorated in the lower part of BF, i.e., the liquid hold-up increases, not only the liquid flow resistance but also the gas flow resistance increases due to the decrease of the free space in the coke bed.8) Then the gas pressure drop in the coke bed increases, and the uneven gas distribution in the coke bed will be developed. Finally, the BF operation becomes unstable and sometimes forced to halt the operation.
The liquid HCI and slag flows in the lower part of BF are easily expected to be highly influenced by the capillary effect since they flow discontinuously as droplets or channels. It is noted that the interaction between liquid phases and solid coke particles is influenced not only by their own physical properties but also their relative interactions such as the interfacial tensions and the contact angles. The liquid HCI is non-wettable on the coke surface, but, the liquid slag is wettable on the coke surface. In other words, the liquid HCI has higher contact angle than that of the liquid slag on the coke surface. The differences of their wettabilities on the coke surface should make their flow behaviors different in the coke bed.
The coexistence of the HCI and the slag in the lower part of blast furnace is well known by plant scale observations for decades and by laboratory scale iron reduction experiments. For a long time, the mechanism of HCI/slag separation under reducing condition had not been clear. Kim et al. found out that the high interfacial tension between metal and slag made them unstable and it resulted in the phase separation to reduce the contacting area between metal and slag.9) They showed the possibility of physical movement of metal and slag induced by metal/slag interfacial tension. The interfacial phenomena may influence not only for metal/slag separation, but also for their dripping behaviors in the coke bed of blast furnace.
The relation of liquid bridge formation and breakage mechanism by different contact angles were well described by David Megias-Alguacil et al.10) In their work, the liquid amount in given bead size, inter particle distance and contact angle were calculated for the stable liquid bridge formation. By above calculation, the capillary forces which liquid bridges imposed on solid particles were analyzed. According to their results, as the wetting angle decreased, i.e., as the wettability increased, the solid beads were under an attractive capillary force field. In other words, liquid bridges were well formed between solid beads. In an extreme case, the maximum volume of liquid bridge could be twice as large as the volume of solid bead. This liquid bridge formation is also one factor increasing the static liquid hold-up in packed bed reactors.
As already mentioned, the appropriate liquid hold-up or smooth liquid flow in the coke bed is one of the most important factors for stable BF operation. Recently, low coke operation in BF attracts a lot of attentions to meet the recent demands of the energy and resource issues. Under this operation, the thickness of coke bed layer becomes so thin that the pressure drop in the coke bed will be enhanced. Consequently, the liquid flow behaviors in the coke bed strongly affect the gas flow pattern in the coke layers. Thus, the smooth liquid flow in the coke bed under the low coke operation is much more demanding and critical compared with the conventional operation.
From all these reasons, many investigations have been carried out to understand the liquid flow behaviors in the lower part of blast furnace.1,2,3,4,5,6,7,8,9,10,11,12,13,14) Most of experiments have been carried out by using water models.2,3,4) The surface tension of water is quite different from that of the liquid HCI and the slag. Thus, the results based on the water model experiments may not be directly applicable to the actual BF process since the liquid flow behaviors in the coke bed will be dominantly influenced by the surface tensions. Husslage et al. carried out high temperature experiments by using the HCI and slag in coke bed.5) In the experiment, the multiphase HCI and slag flow behavior were well observed by the X-ray fluoroscopic apparatus. Their result was, however, quite different from those of the previous water model experiments.
Recently, with the help of the highly developed computational power, the computational fluid dynamics (CFD) approaches get the spotlight in the liquid flow problems. The multiphase flow computational simulations also have been well adopted to analyze the interface interactions of multiphase liquid flows in a packed bed.15,16,17) Especially, these computational simulations are useful to investigate the influence of each parameter in the multiphase flow (such as the liquid flow in the coke bed), which is experimentally hard to obtain because experimentally dissociating one parameter from others is almost impossible due to the complex phenomena. Thus, the CFD approach to investigate the multiphase flow behaviors in the packed bed has now become the essential tools along with the experimental one.
In the lower part of BF, the liquid HCI flow in the coke bed will be influenced by the slag existence in the coke bed. Despite of the importance, however, the effect of slag existence in the coke bed on the liquid HCI flow has never been studied mainly due to the experimental difficulties. The computational approach could make it possible to investigate the liquid HCI and slag flow behaviors in the coke bed with considering the interaction between liquid HCI and slag. Thus, the main purpose of this study is to study the effect of the interaction between liquid HCI and slag on the liquid HCI and slag flow behaviors in the coke bed. The investigation is carried out by applying the high temperature X-ray fluoroscopic in-situ observation at 1773 K combined with the multiphase liquid flow computational simulations, especially focusing on the interaction between liquid HCI and slag in the coke bed.
2. Experimental
2.1. Samples
Industrial BF coke samples supplied from POSCO were used for this study. Tables 1, 2 and 3 show the chemical compositions and proximate analysis of the coke and the oxide contents, respectively. In the present study, two groups of coke size were used. The sizes of coke particles were controlled by sieving the coke. The each diameter of coke particles was 3–5 and 5–9 mms, respectively. In the lower part of BF, the liquid iron is supposed to be almost saturated with carbon. Thus, iron samples were prepared by melting electrolytic iron with graphite powder in a graphite crucible at 1773 K for 2 hours to make HCI (High Carbon Iron, 4.2–4.5 mass% Carbon contents).
Table 1. Chemical composition of coke.
| Overal chemical composition of coke (mass%) |
|---|
| C | H | N | S |
| 97.05 | 0.63 | 0.94 | 0.52 |
Table 2. Proximate analysis of coke.
| Proximate analysis of coke (mass%) |
|---|
| Fixed C | Volatile matters | Ash |
| 87.63 | 1.02 | 11.35 |
Table 3. Oxides in coke ash.
| Oxides in coke ash (mass%) |
|---|
| SiO2 | Al2O3 | CaO | MgO | Na2O | K2O | Fe2O3 |
| 54.21 | 28.19 | 3.26 | 0.587 | 0.540 | 1.03 | 5.29 |
Slag samples were prepared by mixing reagent grade chemicals and melting them at 1773 K for 30 minutes. Table 4 shows the chemical compositions of the prepared slag sample of which the melting temperature is 1696 K. It is highly similar to the general BF slag composition. Since the target of the research was not to find out the effect of the chemical composition of slag on the flow behaviors in the coke bed, the slag of the only one composition was used in the present study.
Table 4. Chemical composition of slag.
| Chemical composition of slag (mass%) |
|---|
| CaO | SiO2 | Al2O3 | MgO |
| 41 | 35 | 14 | 7 |
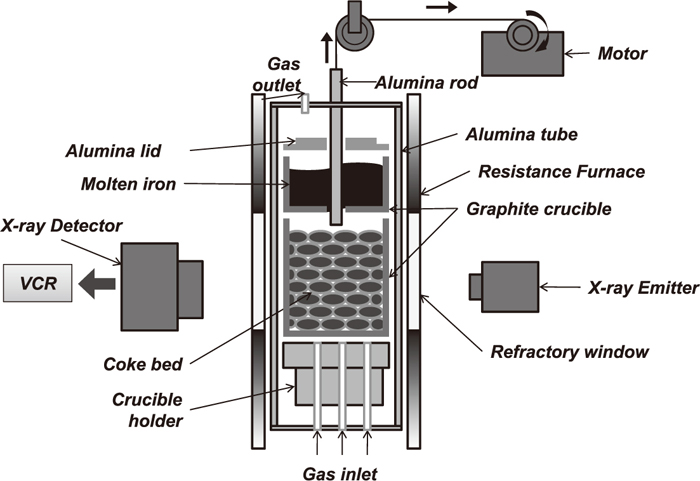
Experimental setup for the study of the HCI flow in the coke bed is shown in Fig. 1. Attached two cylindrical graphite crucibles were set vertically in an alumina tube. The inner diameter of the alumina tube was 80 mm. The dimension of the upper crucible was 60 mm of the inner diameter and 40 mm of the height. The lower crucible had 60 mm of the inner diameter and 100 mm of the height. The upper crucible had a circular hole of 7 mm diameter at the bottom so that molten HCI could drop to the lower crucible. The hole at the bottom of the crucible was plugged by inserting an alumina rod of 6 mm diameter so that the melted HCI would not flow down without permission. Before the furnace was heated, electrolytic iron plates (200 g) and graphite power (8 g) were put in the upper crucible while the bottom hole was blocked by the alumina rod. The lower crucible was filled with coke particles. The height of coke bed was 80 mm. After setting two crucibles in the reaction tube, nitrogen gas was introduced into the reaction tube (1 liter/min) and maintained during the experiment in order to keep the inert gas environment.
After purging by nitrogen gas for 60 minutes, the furnace was heated to 1773 K. The heating rate was 10°C/min. At around 1573 K during raising temperature, it was observed that the electrolytic iron in the upper crucible started to melt. The temperature was held for 2 hours at 1773 K. Then, the liquid HCI was introduced to the top of the coke bed contained in the lower crucible by pulling up the alumina rod in the upper crucible. The flow-down behaviors of the liquid HCI in the coke bed were continuously observed by using X-ray fluoroscopy and the images were recorded. The maximum electric voltage of the X-ray emitter was 150 KV. And it had 0.6 mm × 0.6 mm, and 1.0 mmAl as a focusing area and an inherent filtration, respectively. The shape and size of the visualized area are spherical and 160 mm diameter, respectively. After the experiments, resin was poured into the lower crucible in order to preserve the distribution of the iron and slag nuggets in the coke bed. Then, this crucible was dissected and the cross section was observed by using an optical microscope.
In the lower part of BF, some part of the spaces between cokes will be occupied by molten slag. To understand the actual liquid flow behaviors of the HCI and the slag in the coke bed, the interaction between the liquid HCI and slag in the coke bed must be studied. Thus, the liquid HCI flow behaviors in the coke bed containing molten slag were also investigated in the present study. The experimental setup, conditions and method were essentially the same as those mentioned in above paragraphs. The only difference is that the coke bed in the lower crucible contained some amount of molten slag. To make the coke surface wetted by the slag, the slag powders of which the sizes were in the range of 63 μm to 125 μm were uniformly dispersed in each layer of the coke bed. And the coke bed was heated up to 1773 K and held for 2 hours to make slag wetting coke bed. Then, the liquid HCI was introduced into the coke bed.
3. Computational Methods
The simulations of the HCI and slag flows in the coke bed were carried out by using the commercial CFD code of Fluent combined with the volume of fluid method. To decrease the computational burden, 2-dimensional simulation was used in the present study. The computation domain is shown in Fig. 2. Three spherical coke particle were positioned at the corner of a inverse regular triangle as shown in Fig. 2(a). The diameter of each coke particle was 12 mm and the distance between the each circle’s centers were 15 mm so that the minimum slit length became 3 mm. The contact angle of HCI melt on coke will be changed with the carbon content and those of molten slag also will be changed with the composition. The contact angle of liquid HCI on coke with inert gas atmosphere was set to be 120° (non-wettable) following the value suggested by Jin et al.15) In case of liquid slag, the contact angle of liquid slag is known to be decreased as reaction time increases. And, it decreases less than 90° within two and half hours at 1773 K when its basicity is less than 1.3.11) Following the result but for the sake of convenience, the contact angle of slag on coke surface was set to be 60° (wettable). Even though above contact angles of HCI and slag are not exactly same as those of real materials, 120° and 60° are quite acceptable values to show the typical non-wetting and wetting liquid materials on coke surface.

The initial condition of the position and shape of the HCI drop for the simulation is shown in Fig. 2(b) and that of slag is shown in Fig. 2(c). These conditions were determined based on the results of the preliminary simulations. The HCI and slag shape or movements in the coke bed were determined depending on their own contact angles and the gravity (each weight). Thus, the tentatively decided initial position and the shape of these drops were changed with time to minimize their energies and were finally stabilized. Namely the HCI drop stayed on the top of the coke bed and the slag formed the bridge in the coke bed. These finally stabilized positions were used as the initial conditions for the simulations to investigate the effect of the slag on the HCI flow in the coke bed as shown in Fig. 2(d). Table 5 shows the physical properties of the HCI and the slag which were used in the simulation.
Table 5. Physical properties at 1773 K used in simulation.
| Physical properties at 1773 K | Values |
|---|
| Density of HCI | 6700 kg/m3 |
| Viscosity of HCI | 0.001 Pa·s |
| Surface tension of HCI | 1.1 N/m |
| Density of slag | 2600 kg/m3 |
| Viscosity of slag | 0.4 Pa·s |
| Surface tension of slag | 0.4 N/m |
| Density of gas | 1.5 kg/m3 |
| Viscosity of gas | 2×10⁻⁵ Pa·s |
To simulate the movement of the HCI and slag drops after contacting each other in the coke bed, the contact angle of HCI with slag on the coke surface must be known. In this simulation, the contact angle of HCI with slag on the coke surface was set to be 75° based on the preliminary experimental results (shown in Fig. 12). To give better understanding, the contacting situations of HCI and slag drops on coke surface were schematically shown in Fig. 3. The initial positions of the contacted HCI and slag drops in the simulation were schematically shown in Fig. 3(c).

To make clear the effect of the contact angle transition, the HCI-slag flow simulation without wettability transition was also carried out. The term ‘without wettability transition’ means that the contact angles did not change even when the HCI came in contact with slag. In other word, the constant contact angle of 120° for the HCI and that of 60° for slag were fixed in the simulation. The initial positions with this condition were schematically shown in Fig. 3(d). In order to investigate the effect of slag for the HCI flow in more detail, the simulation with three layer packed beds were carried out. Figure 4 shows the layout of the initial positions in the simulation. The anisotropic slag bridge layout was intentionally introduced to see the effect of slag on the direction of the HCI drop flow.
All the multiphase simulations were carried out by applying the volume of fluid (VOF) method. The VOF method is a numerical technique for tracking and locating the free surface (or fluid-fluid interface). The control volume was considered to be filled with one of HCI, slag, gas and mixture of them. And the sum of each phase fraction in a control volume was unity as shown in Eq. (1),
where
q and
α indicate the number of each phase and volume fraction of the phase. The volume fraction in each control volume was conserved by continuity
Eq. (2).
|
∂
α
q
∂t
+
u
→
⋅∇
α
q
=0
| (2) |
To calculate the velocity field, the momentum conservation equation was applied like shown in
Eq. (3),
|
∂
∂t
(
ρ
u
→
)
+∇(
ρ
u
→
u
→
)
=–∇p+∇⋅[
μ(
∇
u
→
+
(
∇
u
→
)
T
)
]+ρ
g
→
+
F
→
| (3) |
In the phase interface, the surface tension force was applied as notated by
F
→
in
Eq. (3). The surface tension force,
F
→
, was obtained by calculating the curvature of the interface. In volume of fraction method, the interfacial tension is calculated by
Eq. (4),
|
F
→
=
σ
ij
α
i
ρ
i
k
j
∇
α
j
+
α
j
ρ
j
k
i
∇
α
i
1
2
(
ρ
i
+
ρ
j
)
| (4) |
where
σ are surface tension between two phases indicated by
i and
j, and
k
i
=∇⋅
n
ˆ
i
,
n
ˆ
i
=
n
→
i
|
n
→
i
|
,
n
→
i
=∇
α
i
. In case of the control volume nearby solid wall,
n
ˆ
i
is given by
Eq. (5),
|
n
ˆ
i
=
n
ˆ
iw
cos(
θ
iw
)
+
t
ˆ
iw
sin(
θ
iw
)
| (5) |
where
n
ˆ
iw
,
t
ˆ
iw
and
θiw are unit normal vector, unit tangential vector to the wall and contact angle, respectively.
4. Results and Discussion
4.1. In-situ Observation of HCI Flow in the Coke Bed without Containing Slag
The in-situ X-ray fluoroscopic results of the liquid HCI flow behavior in coke beds with the coke sizes of 5–9 mm and 3–5 mm as a function of time at 1773 K are shown in Figs. 5(a)–5(c) and 5(d)–5(f), respectively. When the diameter of the coke particle was 5–9 mm, the liquid HCI (charging amount of 200 g) could pass through the coke bed. When the coke particle size of 3–5 mm was used, however, the HCI drop could not pass through the coke bed, but it stayed on the top of the coke bed as shown in Figs. 5(d)–5(f). As expected, the HCI flow behaviors were highly influenced by the packing structure of the coke bed.
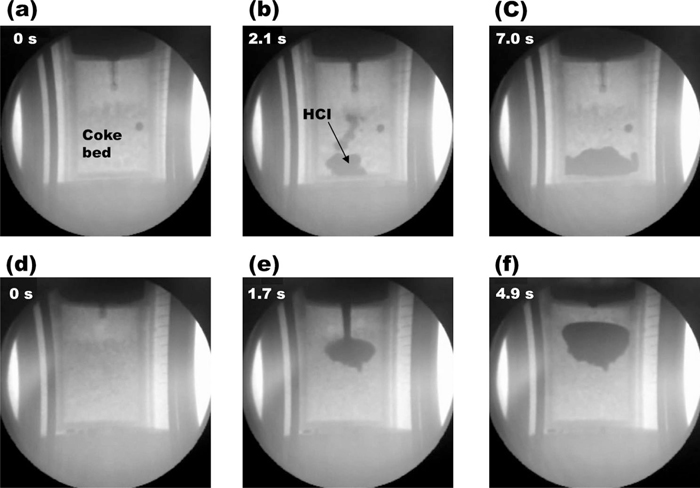
There exists a particular length, denoted κ–1, beyond which the gravity becomes important. It is referred to as the capillary length. At 1773 K, the capillary length of HCI is calculated to be about 4 mm (κ–1 = (γ/ρg)1/2). The coke particle size of 5–9 mm is longer than the capillary length. It means that the gravity becomes important for the HCI flow in the coke bed, or the effect of capillary can be neglected. So, the HCI drops could move though the coke bed without specific resistance in this coke size bed. For the case of the HCI flow with the coke size of 3–5 mm, the capillary effects dominated and the surface tension had a prevailing effect to hold the HCI drops.
4.2. HCI Flow in the Coke Bed with Containing Slag
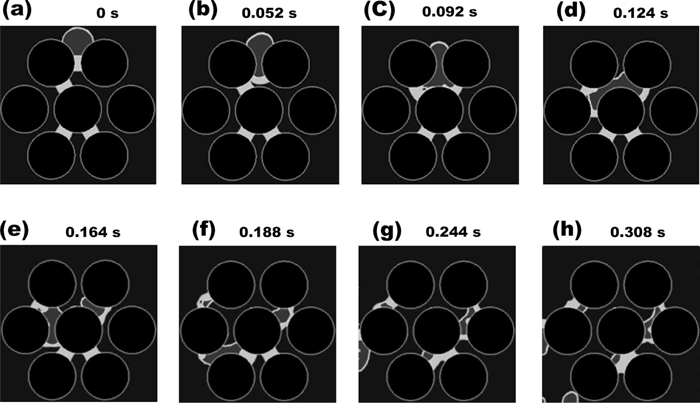
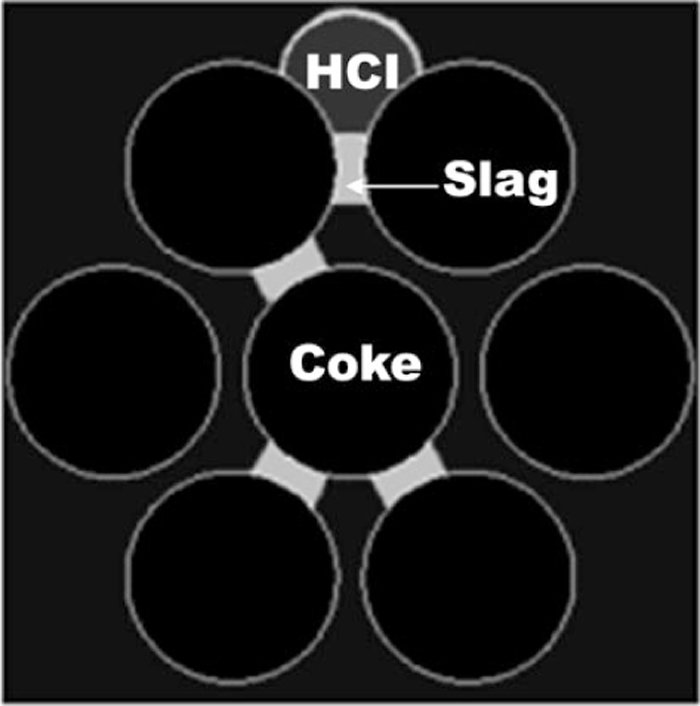
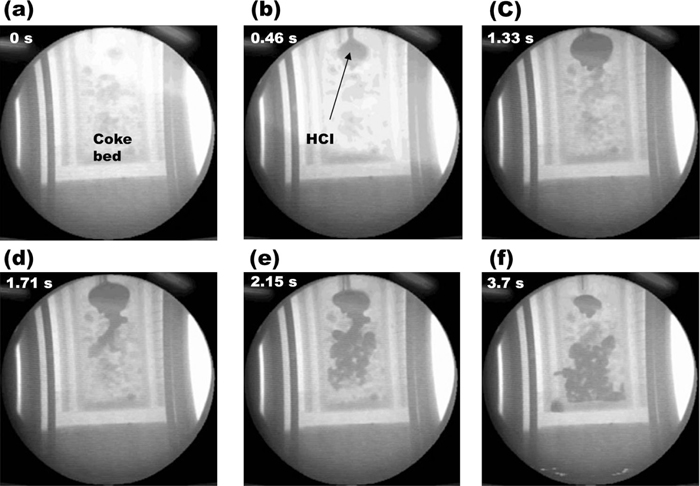
When the HCI drops flowed in coke bed containing slag, the HCI drops might come into contact with slag distributed in the coke bed. It is expected that the contact between the HCI and the slag could influence their flow behaviors each other since the interfacial tension between the HCI and the slag would be introduced after the contact of them. In the present experimental study, only the coke bed with the coke size of 3–5 mm was used because the flow should be highly affected by the capillary force in Figs. 5(d)–5(f). The in-situ X-ray fluoroscopic observation of the HCI flow in coke bed with containing slag is shown in Fig. 6. The HCI drops were initially stayed on the slag at the top of coke bed, but intriguingly they started to penetrate into the space in the coke bed after 1.33 seconds like shown in Fig. 6(c). Namely, differed from the previous result of the HCI flow without the slag coexistence as shown in Figs. 5(d)–5(e), the HCI drops passed through the coke bed even though the coke size was small enough to halt the dripping of the HCI into the coke bed. This HCI flow behavior was certainly introduced by the coexisted slag in the coke bed.
In the X-ray fluoroscopy observation, the slag flow behavior in the coke bed was not clearly observed differed from that of the HCI. Thus, the slag flow behavior was examined indirectly based on the results of the dissection observation of the samples in the crucible after the experiments. The vertical directional dissection image of the coke bed (3–5 mm diameter) was shown in Fig. 7. Initially the slag stayed in the bed as small drops. And they were uniformly distributed in the bed. However, after the HCI stream flowed down through the coke bed wetted by slag, only small amount of slag was observed in the coke bed near the passage of the HCI stream. In fact, slag drops staying in the passage of the HCI stream might have been washed down with the HCI drops. But the slag drops which was not in the passage of the HCI stream remained as large drops. They might not have contacted with the HCI or might have been pushed aside by the HCI stream. In other words, slag drops which had not been contact the HCI or had lost their contact with the HCI could not drip down because they could not change their contact angle without the help of the HCI drops.

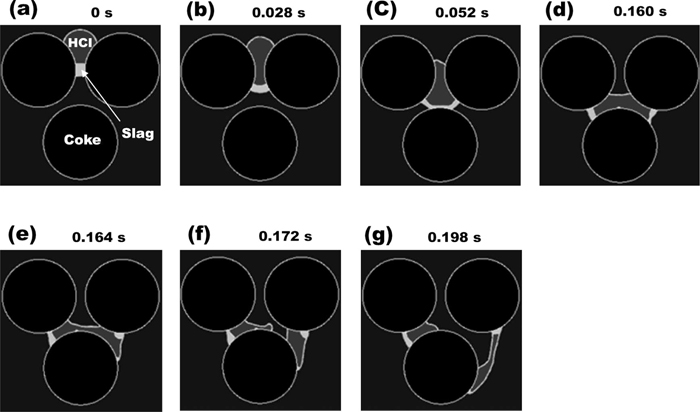
In order to investigate the effect of the coexisted slag on the HCI flow, two kinds of simulations were performed. In the first case, the contact angle of the HCI was assumed to be changed after coming into contact with the slag. Figure 8 shows the results of the HCI and slag flows when the contact angle of the HCI was 120° before contacting with the slag and it was changed to 75° after contacting. Since the contact angle change of the HCI made it wettable (75°) on the coke surface by contacting the slag, the HCI drop could penetrate into the narrow coke slit by deforming the shape in Figs. 8(b), 8(c) and 8(d). The slag became non-wettable (105°) on the coke surface by contacting the HCI, and the slag liquid bridge was started to be broken. After both the HCI and the slag reached at the large empty space in the middle of three coke particles in Fig. 8(d), the wettable HCI and the non-wettable slag in their interface continuously moved through the narrow coke slit in Figs. 8(e), 8(f) and 8(g). Consequently, the HCI as well as the slag moved down through the coke bed.
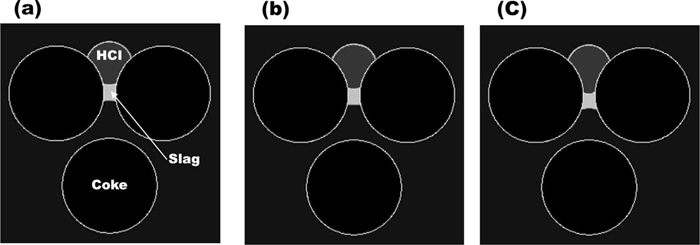
The effect of the gravitational force could be neglected under this condition since the coke particle size of 3–5 mm was shorter than the capillary length. Thus, this flow down behavior would not be introduced by the increased weigh on the slag bridge. To confirm the negligible effect of this gravitational force, the following simulation was carried out. In this simulation, the contact angles of the HCI did not change even when it touched with the slag. And the contact angle of the slag was also fixed. Figure 9 shows the HCI-slag flow in the packed bed with the fixed HCI contact angle of 120°. According to the result, the HCI drop stayed on the top of the coke bed and did not pass through the packed bed and neither did the slag. This result confirms that the change of the HCI interfacial contact angle can be the driving force of the HCI and slag flows in the coke bed, but the increased gravitational force on the slag bridge is not. The detail about the effect of the interfacial contact angle change on the liquid flows will be discussed later.
In order to see the interacting effect of the slag on the HCI flow more clearly, the multiphase HCI-slag simulation in 3 coke layers were performed. The slag bridges were initially distributed in the coke bed without symmetry. Figure 10 shows the simulated results of the HCI drop flow in the coke bed of 3 layers with the slag bridges as a function of time. According to the result, the HCI drops preferred to move toward the slag bridge in Figs. 10(d) and 10(e). This calculated result suggests that the distribution of the slag bridge in the coke bed may have the strong influence on the distribution of the HCI flow.
4.4. HCI and Slag Flow in the Coke Bed Induced by the Change of the Contact Angles
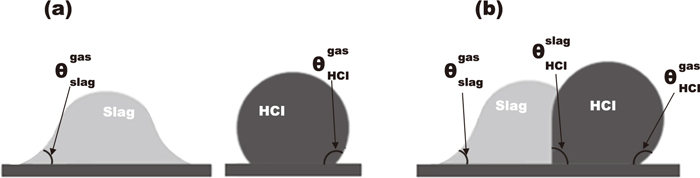
The HCI drop and slag drop have their own contact angles on the coke surface with inert gas atmosphere. According to Young-Laplace equation, the contact angle was determined by the interfacial tensions between each phase. The contact angle of HCI over gas on the coke surface may be different from that of HCI over slag phase, because the HCI-gas and the HCI-slag have different interfacial energies. For a similar reason, the contact angle of slag over gas on the coke surface may be different from that of slag over HCI. Thus, the contact angles of the HCI or slag will be changed if they touch each other on the coke surface due to the emerged new interface between the HCI and slag. Figure 11 schematically shows how the contact angles of the slag and HCI could change when they meet each other. For example, slag typically has wettable contact angle (<90°) on the coke substrate with inert gas atmosphere as shown in Fig. 11(a). But, it will change to non-wettable once the slag is contacted with the liquid HCI on the coke surface in Fig. 11(b).
The contact angle of the HCI and slag can be determined following Young-Laplace equation.
|
γ
HCI
gas
cos(
θ
HCI
gas
)
+
γ
HCI
coke
=
γ
coke
gas
| (6) |
|
γ
slag
gas
cos(
θ
slag
gas
)
+
γ
slag
coke
=
γ
coke
gas
| (7) |
Above two
Eqs. of (6) and
(7) are typically used to measure and estimate of the interfacial tension or contact angle of individual HCI and slag drops on the coke substrate. In the case when HCI and slag drop touch each other, the new equation is generated as shown in
Eq. (8). The meaning of
θ
HCI
slag
is illustrated in
Fig. 11(b).
|
γ
HCI
slag
cos(
θ
HCI
slag
)
+
γ
HCI
coke
=
γ
slag
coke
| (8) |
When the
Eqs. (6) and
(7) are substituted into
Eq. (8), the
Eq. (9) is obtained as follows.
|
γ
HCI
slag
cos(
θ
HCI
slag
)
=
γ
HCI
gas
cos(
θ
HCI
gas
)
–
γ
slag
gas
cos(
θ
slag
gas
)
| (9) |
By using
Eq. (9), the interfacial tension and the contact angle between HCI and slag can be calculated. The values of
γ
HCI
gas
,
θ
HCI
gas
,
γ
slag
gas
and
θ
slag
gas
are extensively measured by many researchers. But,
γ
HCI
slag
and
θ
HCI
slag
are not easy to be measured because of the experimental difficulties. Precise measurements of the interfacial tensions and the contact angles are not the aim of this study. Thus, obtaining the exact interfacial tension and contact angle in the HCI-slag interface is left for the future work.
The contact angle change of the HCI and slag can be approximately estimated by melting HCI and slag in a graphite substrate at 1773 K. Figure 12 shows the HCI and slag drops on graphite at room temperature after they were cooled down. A single HCI drop had non-wetting contact angle (>90°) in Fig. 12(a). But, once the HCI drop contacted with a slag drop, it had wetting contact angle (<90°) in Fig. 12(b). As already mentioned, the contact angle of 75° was used in the simulation based on this observation.

The similar behaviors with the penetration of HCI into the coke bed are widely observed in our daily life such as the wetting of the fabric or the impregnation of water into porous materials. These phenomena are related to that of capillary rise, the invasion of the tube by liquid proceeds if the surface energy of the wall decreases with wetting. Thus, the liquid HCI flow in the coke bed can be possibly explained based on the capillary rise models. Huge amount of experimental and numerical investigations of the capillary rise have been carried out.18) All the results of the capillary rise can be applied to describe the penetration of liquid HCI into the coke bed simply by replacing the gas phase with the liquid slag phase.
Namely, the change to the wettable characteristic of liquid HCI on the coke surface from non-wettable after contacting with the liquid slag means that the surface energy of the coke surface decreases when the surface are covered by the liquid HCI. In other words, the total energy of the system decreases with increase of the area covered with the liquid HCI. Namely, the driving force of the HCI penetration into the coke bed is the reduction of the total energy by extending the area covered with the liquid HCI. Consequently, the HCI can penetrate into the slit of the coke bed.
Through this study, it has been found that the molten slag in the coke bed have an important role to assist the smooth liquid HCI flow in the coke bed. It will not be a special case, but will be expected to often take place in the actual BF. During descending the BF, the coke reacts with CO2 and the carbon in the surface layer of the coke is removed. Consequently, the minerals initially contained in the coke appear at the surface of the coke. These minerals may react with the slag or melt themselves so that they possibly cover the coke surface. This molten slag will help the smooth running of the liquid iron in the coke bed. The reaction between coke minerals (ash) was already investigated.19) However, the effect of coke ash to enhance the liquid HCI flow in the coke bed is not yet well studied. The contribution of the coke minerals to improve the liquid HCI flow in the coke bed will be studied in near future.
5. Conclusion
In the lower part of blast furnaces, two different liquid phases of iron and slag coexist. In the BF operation, the smooth flow of these liquids in the coke bed is very essential for the stable operation. Many studies have been carried out for the liquid flow behaviors in the coke bed. However, the effect of the iron-slag interaction on the liquids flows in the coke bed have not been well understood despite of its importance. In the present study, the flow behaviors of the high carbon iron (HCI) and slag in the coke bed and the effect of interactions between them on their flows were investigated experimentally and numerically by using in-situ high temperature X-ray fluoroscopy and the multiphase flow numerical simulation. Based on these studies, the following conclusions are obtained:
(1) From the in-situ X-ray observation at 1773 K, it was found that the liquid HCI passed through the coke bed with the coke particle size of 5–9 mm. For the coke particle size of 3–5 mm, however, the HCI drop did not pass through the coke bed, but it stayed on the top of the coke bed.
(2) The HCI drops were able to pass through the coke bed of the coke size of 3–5 mm when the slag was existed in the coke bed.
(3) When HCI and slag touch each other on the coke surface, it was found that the contact angle of the HCI were decreased and became wettable to the coke surface On the other hand, the slag was changed to non-wettable with the coke surface.
(4) Based on the computational simulation, it has been confirmed that the contact angle transition of HCI from non-wettable to wettable after contacting with the slag make the liquid HCI and slag possible to pass though the narrow coke slit regardless of their initial wettabilities.
(5) The driving force of the HCI penetration into the coke bed slit is due to the total energy reduction by extending the area covered with the liquid HCI.
Acknowledgements
The authors wish to express their appreciation to POSCO for the support to this research.
References
- 1) J. Yagi: ISIJ Int., 33 (1993), 619.
- 2) H. Kawabata, Z. Liu, F. Fujita and T. Usui: ISIJ Int., 45 (2005), 1466.
- 3) H. Kawabata, K. Shinmyou, T. Harada and T. Usui: ISIJ Int., 45 (2005), 1474.
- 4) K. Saito, K. Ohno, T. Miki, Y. Sasaki and M. Hino: ISIJ Int., 45 (2006), 1783.
- 5) W. M. Husslage, M. A. Reuter, R. H. Heerema, T. Bakker and A. G. S. Steeghs: Metall. Mater. Trans B, 36B (2005), 765.
- 6) G. S. Gupta, J. D. Litster, E. T. White and V. R. Rudolph: Metall. Mater. Trans. B, 28B (1997), 597.
- 7) G. X. Wang, S. J. Chew, A. B. Yu and P. Zulli: Metall. Mater. Trans. B, 28B (1997), 333.
- 8) Y. Bando, S. Hayashi, A. Matsubara and M. Nakamura: ISIJ Int., 45 (2005), 1461.
- 9) H-S Kim, J. G. Kim and Y. Sasaki: ISIJ Int., 50 (2010), 1099.
- 10) D. Megias-Alguacil and L. J. Gauckler: AlChE J., 55 (2009), 1103.
- 11) T. W. Kang, S. Gupta, N. Saha-Chaudhury and V. Sahajwalla: ISIJ Int., 45 (2005), 1526.
- 12) K. Nishioka, D. Fujiwara, K, Ohno, T. Maeda and M. Shimizu: ISIJ Int., 50 (2010), 1016.
- 13) G. S. Gupta and K. Naveen: Metall. Mater. Trans B, 38B (2007), 203.
- 14) L. Baussaron, C. Julcour-Lebigue, A-M. Wilhelm and H. Delmas: AIChE J., 53 (2007), 1850.
- 15) H. Jin, S. Choi, J-I. Yagi and J. Chung: ISIJ Int., 50 (2010), 1023.
- 16) X. F. Dong, A. B. Yu, S. J. Chew and P. Zulli: Metall. Mater. Trans B, 41B (2010), 330.
- 17) F. Augier, A. Koudil, A. Royon-Lebeaud, L. Muszynski and Q. Yanouri: Chem. Eng. Sci., 65 (2010), 255.
- 18) P. de Gennes, F. Brochard-Wyart and D. Quere: Capillarity and Wetting Phenomena: drops, bubbles, pearls, waves, Springer, New York, (2004), 122.
- 19) M. Grigore, R. Sakurovs, D. French and V. Sahajwalla: Int. J. Coal Geology, 75 (2008), 213.