1. Introduction
Nozzle clogging is a serious problem during continuous casting in the steel industry due to its harmful effect on the casting process and the final product. The clogs in the nozzle change the nozzle flow pattern, disrupt the flow in the mold, and result in top slag entrainment and surface defects.1) Clogging problems caused by spinel inclusions have been reported by some researchers. Park et al.2) and Sakata3) pointed out that the spinel inclusions tended to adhere on the nozzle wall. Therefore, the control of the soluble Al and Mg contents in molten steel is very important to inhibit spinel formation and nozzle clogging during casting.
The formation mechanism of spinel inclusions in stainless steel has been discussed based on a thermodynamic consideration of molten steel4,5,6,7,8,9) and slag composition.10,11,12,13,14,15) The formation of spinel inclusions was considered as a result of a formation of singular spinel (only consisting of MgO·Al2O3) and/or of a spinel crystallization from liquid droplets of CaO–SiO2–MgO–Al2O3 during solidification.2) Park8) reported that the inclusions containing the MgO·Al2O3 crystals were not observed in an Fe–16Cr–14Ni steel if the concentration of Al2O3 in the inclusions was smaller than 20 mass%. However, the number of these inclusions increased drastically at Al2O3 concentrations larger than 20 mass%. Todoroki and Mizuno13) found that an increased content of silica in the slag can enhance the formation of spinel inclusions in Fe–18Cr–8Ni steels deoxidized with aluminum. Furthermore, the effect of ferrosilicon additions on the composition of inclusions was also reported.16,17,18) For instance, Park and Kang17) reported that the addition of FeSi with a higher Al content promoted an increase of Al2O3 in the inclusions and a formation of spinel. Modifications of spinel inclusions by a Ti addition and calcium treatment in liquid steel during the refining process were studied by several researchers.19,20,21,22,23,24,25,26) The formation condition of MgTi2O4 instead of MgAl2O4 was studied by Ono et al.25,26) However, the Ti will accelerate the Mg dissolution from the refractory and slag which will lead to an easier formation of spinel inclusions.20) Yang et al.22) pointed out that spinel inclusions would transform to liquid complex inclusions, if the dissolved Ca content in the liquid steel exceeds 1 ppm.
The previous studies of inclusions were carried out by using two dimensional (2D) investigations, in which the surface layer composition can not be determined precisely. In addition, the above mentioned thermodynamic calculations are based on the Henrian standard state which is not recommended for high alloy steels. In the present study, two heats of high-silicon non-calcium treated (HSiNC) stainless steels were investigated by a three dimensional (3D) analysis by using electrolytic extraction. The characteristics of inclusions and clusters (such as morphology, number, size and composition) in steel samples taken during ladle treatment and casting in the Low Al steel were compared with those in the High Al steel. The formation mechanisms and evolution of different inclusions including spinels were investigated and discussed for both heats. Furthermore, the phase stability diagram based on Darken’s quadratic formalism and Redlich-Kister type polynomial27,28,29,30) was estimated for both heats at a non-infinite solution.
3. Results and Discussion
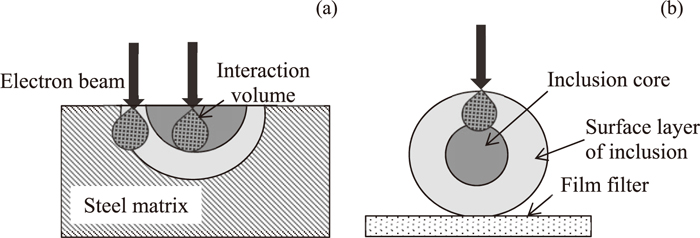
2D investigations on a polished cross section of a metal sample and 3D investigations on the surface of film filter after electrolytic extraction are the most common methods used for analyzing inclusions in steel samples. However, Doostmohammadi et al.32) reported that the accuracy of the composition determination for small size particles from the 2D method is lower than that from the 3D method due to the effect of the steel matrix. Moreover, the compositions of the surface layers of the inclusions are also very important due to the following reasons: 1) Each inclusion connects to the nozzle wall or the other particles through the surface layer. Therefore, the possibilities for precipitation of a given inclusion on the nozzle wall and for coagulation with the other particles will in most cases depend on the properties of the surface layer of this inclusion. 2) The compositions of the surface layer of the inclusion is also very important for thermodynamic calculations when the inclusions are not homogenous (the inner part of the inclusions may come from the previous step). However, it is difficult in many cases to determine the accurate composition of a surface layer with a thickness smaller than 1 μm by using the 2D method due to the additional effect of steel matrix. Schematic illustrations of the EDS analysis of inclusion composition by using these two methods are shown in Fig. 2. In this case, the 3D method after extraction of inclusions from steel sample can be used for more precise estimations of the surface layer compositions of the inclusions without the effect of the steel matrix. Furthermore, the morphology and size of inclusions can be determined accurately by using 3D investigations. Thus, the 3D method was chosen in this study as the main method for investigation of inclusion characteristics. It should be pointed out that the composition obtained from the 2D method in this study corresponds to the central part of an inclusion on the SEM photos.
Inoue et al.33) reported that a 10%AA electrolyte can be successfully used for the extraction of spinel inclusion. However, pure MgO inclusions can dissolve in a 10%AA electrolyte. In this study, compositions of different inclusions was obtained from the 2D observations on metal cross section and from the 3D investigations on film filter after EE by using 10%AA and 2%TEA electrolytes. The MgO contents in spinel and inclusions with high concentrations of MgO (≥ 80 mass%) in steel samples as a function of inclusion size are shown in Fig. 3. It can be seen that the MgO content in spinel and the inclusions with high MgO content that dV > 2 μm obtained from the 2D method is slightly higher than that from the 3D method. This is because the MgO content in the central part is larger than that in the surface layer of inclusion. However, the MgO contents in different inclusions obtained by the 3D investigations by using 10%AA and 2%TEA electrolytes agree satisfactorily well. It can be explained by the short time of EE (2.5–3 hours) in this study. According to results reported by Inoue et al.,33) the percentage of MgO particles dissolved during EE with a 10%AA electrolyte is smaller than 0.1%.

Janis et al.34) reported that the Cr-rich compounds can precipitate during the EE of Fe-20mass% Cr alloy by using a 2%TEA electrolyte. Similar precipitations were also observed in this study by extraction of stainless steel samples by using a 2%TEA electrolyte. These precipitations partially cover the film filter and made the observation of small size inclusions (dV < 2 μm) difficult. Therefore, the 10%AA electrolyte was used in this study for the 3D investigations of inclusion characteristics after a short time of electrolytic extraction.
3.1. Morphology of Inclusions
In the present study, the non-metallic inclusions in all steel samples from the Low Al (LAl) and High Al steel (HAl) were classified into three different groups based on the morphology: Spherical (SP), irregular and regular (IR) and clusters (CL). The typical SEM images, size range and composition of different types of inclusions are shown in Table 2. It can be seen that the size ranges of SP and IR inclusions in the Low Al steel is significantly wider (1.0–10.5 μm) than those in the High Al steel (1.0–5.5 μm). However, the size range for clusters in the High Al steel is slightly wider than that in the Low Al steel. It should be mentioned that the composition of inclusions are listed in a descending order based on the oxides content.
Table 2. Morphology of inclusions in steel samples from Low Al (LAl) and High Al steel (HAl).
In this study, it was found that the morphology of inclusions in Low Al and High Al steel were significantly changed during ladle treatment and casting. Figure 4 shows the frequency of different type inclusions in different steel samples. As can be seen in Fig. 4(a), the frequency of clusters and IR inclusions in the Low Al steel decreases drastically during ladle treatment and casting from 16% CL and 40% IR in the L1 sample to 1–2% CL and 1–2% IR in the T1 and T2 samples. The frequency of spherical inclusions in this steel grade increased and reached values of 96–98% in the cast steel (samples T1 and T2). This fact can be explained by the removal of some clusters and by a gradual transformation of IR inclusions and some clusters to spherical inclusions. The spheroidizing of IR inclusions and clusters indicates a change in the inclusion composition (wholly or partially on the surface), which corresponds to the composition of a liquid phase at the given temperature range. A formation of a new liquid oxide layer on the surface of the existing cluster and IR solid inclusions can completely change the morphology and behavior of these inclusions regarding clogging problems during casting. The composition of inclusions with different morphologies will be discussed below.

As can be seen in Fig. 4(b), the frequency of clusters in the steel samples of the High Al steel increases from 3% (sample L1) to 15% (sample T2) during ladle treatment and casting. The frequency of IR inclusions decreases from 24% to 12%. However, the frequency of spherical inclusions in steel samples is almost same during all the time of ladle treatment and casting (73–76%). Based on the obtained results, it can be assumed that the clusters in the High Al steel are formed from IR inclusions, which reached a maximum frequency in sample T2. Therefore, it was concluded that the clusters and IR inclusions are responsible for nozzle clogging during casting of the High Al steel.
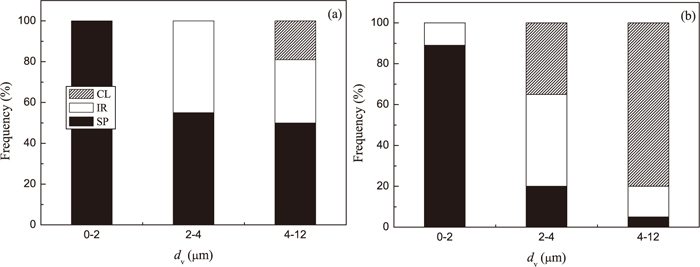
The frequency of different type of inclusions in Low Al and High Al steel as a function of size is shown in Fig. 5. It can be seen that most inclusions in the range of dV ≥ 4 μm are spherical (50%) and irregular (31%) inclusions in Low Al steel (Fig. 5(a)). Only 19% of the observed inclusions in this size range correspond to clusters. Furthermore, the frequency of IR inclusions and clusters decreases drastically during ladle treatment and casting of the Low Al steel, as was shown in Fig. 4. However, the large size clusters (with dV ≥ 4 μm) are dominant (80%) in the High Al steel samples. The frequency of IR and SP inclusions in this size range reaches only 15 and 5%, respectively. Moreover, the inclusions in the range of dV from 2 to 4 μm in this steel are mostly IR inclusions (45%) and clusters (35%). Therefore, the large size clusters and IR inclusions in the High Al steel can be considered as the most possible reason for nozzle clogging during casting of this steel grade.
The compositions of different inclusions and clusters in steel samples were determined from 2D (analysis of central zone of inclusion on the SEM photos and mapping of distribution of main elements in inclusion on a polished surface of steel sample) and 3D (analysis of surface layer of inclusions on a film filter after electrolytic extraction) methods.
A distribution of the main elements in different inclusions on the surface of steel sample obtained by EDS mapping is shown in Table 3. It was found that the spherical inclusions in the samples of a Low Al steel are presented by homogeneous (SP1) and heterogeneous (SP2) inclusions. All elements (such as Ca, Si, Mg, Al and O) in SP1 inclusions are distributed almost homogeneously. The SP2 inclusions consist of a solid MgO phase and a CaO–SiO2–Al2O3–MgO shell. The irregular and regular (IR) inclusions and clusters (CL) in LAl steel consist of pure MgO or inclusions partially covered by a CaO–SiO2–Al2O3 layer. The spherical inclusions in the samples from the High Al steel are presented mostly by heterogeneous SP2 and SP3 inclusions. The SP2 inclusions have a similar construction as those in LAl steel. The SP3 inclusions contain solid phases of pure MgO and Al2O3, which are covered by a CaO–SiO2–MgO–Al2O3 shell. The IR inclusions and clusters in HAl steel consist of almost homogeneous MgO·Al2O3 inclusions.
Table 3. Distribution of main elements in different inclusions and clusters in steel samples from Low Al (LAl) and High Al steel (HAl).
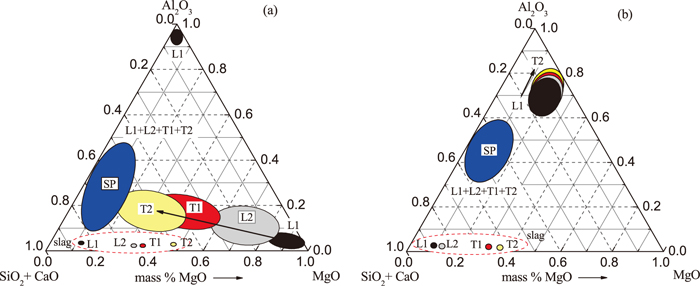
The compositions of typical inclusions in Low Al and High Al steel obtained from the 3D investigations after electrolytic extraction are shown schematically using MgO–Al2O3–(SiO2+CaO) diagrams in Fig. 6. Data are given for different stages of ladle treatment and casting. The compositions of slags from ladle and tundish for appropriate sampling moments are also shown in these diagrams by circle-marks with corresponding colors. It can be seen that the compositions of most SP inclusions (blue zones) on all stages of both heats are located in the left-side part of these diagrams. According to the MgO–Al2O3–SiO2–CaO diagrams,35) most of these spherical inclusions in the LAl steel correspond to the liquid phase zone at the given steel temperatures (1750–1840 K). The IR inclusions and clusters in L1 and L2 samples (black and grey zones) of Low Al steel and in all samples of High Al steel located in the zones of solid phases. However, the composition of the surface layer that cover the IR inclusions from L1 to T2 samples in LAl steel approach to the liquid phase zone of SP inclusions. It should be mentioned that the surface layer compositions of the spherical inclusions (without these located left side of the phase diagram) in the LAl steel and mostly the spherical inclusions in HAl steel located in the solid phase zone.35) This fact may be explained by the presence of a thin outer layer (< 1 μm) of a liquid phase on the surface of the solid IR inclusions. In this case, the analyzed volume during the 3D investigations of inclusion composition captured some part of the solid phase in the center of the inclusion, as shown in Fig. 2(b). The total content of SiO2+CaO in these inclusions increases significantly during ladle treatment and casting, while the MgO content decreases (Fig. 6(a)). However, as shown in Fig. 6(b), the compositions of IR inclusions and clusters in HAl steel samples tend to move to a higher concentration of Al2O3 and a lower content of SiO2+CaO, which correspond to the zone of a solid phase at the given temperature range.
Change of inclusion morphology and compositions during ladle treatment and casting of LAl and HAl steel are schematically illustrated in Table 4. The content of each oxide in typical inclusions is represented in this table by the average value as well as the standard deviation (±σ) obtained by the 3D investigations.
Table 4. Morphology and content of main oxides (mass%
*) in typical inclusions from Low Al (LAl) and High Al steel (HAl).
* Content of each oxide represented by average and standard deviation values.
As was described above, the samples of LAl steel contain homogeneous (SP1) and heterogeneous (SP2) SP inclusions. The CaO content in SP1 inclusions in the LAl steel significantly decreases from 49±3 mass% in L1 sample to 10±9 mass% in T2 sample, while the SiO2 content increases from 21±1 mass% in L1 to 49±15 mass% in T2 samples. The composition of most SP1 inclusions could be found in the liquid phase zone at the given steel temperatures (1750–1840 K).35) Thus, it can be assumed that these inclusions are involved from liquid slag and then the composition of these slag inclusions was changed due to the reaction with liquid steel.
Moreover, the L2, T1 and T2 samples of a LAl steel contain the heterogeneous SP2 inclusions. The formation of these spherical inclusions is more interesting for modification of IR inclusions and clusters to the spherical inclusions. It was found that the composition of most IR inclusions and clusters in the L1 sample of the Low Al steel are almost pure MgO (>80 mass% MgO). However, the content of MgO in these inclusions and clusters decreases drastically during ladle treatment and casting from 87±7 mass% in the L1 sample to 25±13 mass% in the T2 sample. During the same period, the SiO2 content in the surface layer increases from 5±3 mass% to 40±2 mass%. The contents of Al2O3 and CaO in these inclusions also increase on average from 4±3 mass% to 20±5 mass% and from 4±4 mass% to 15±4 mass%, respectively. It may be explained by precipitation of a SiO2–Al2O3–MgO–CaO liquid oxide layer on the surface of a solid MgO phase. If the precipitated liquid phase covered all surface of the solid phase, the IR inclusions and clusters was modified to the heterogeneous spherical inclusions (SP2). As a result, the sum of IR inclusions and clusters in LAl steel drastically decreases from 56 mass% in L1 sample to 2–4 mass% in T1 and T2 samples, as was shown in Fig. 4(a).
It was also found that a few IR inclusions in the L1 sample of the LAl steel are pure Al2O3 (>97 mass% Al2O3) inclusions as shown in Fig. 6(a). Their presence in the melt may be explained by some content of Al oxides in added ferroalloys (such as FeSi) and deoxidizers. However, these Al2O3 inclusions are only present in the L1 sample. This might be explained by the reaction of the Al2O3 inclusions with the liquid steel and by the heterogeneous precipitation in the other inclusions during ladle treatment and casting.
3.3.2. Inclusions in HAl Steel
The HAl steel samples contain mostly heterogeneous spherical inclusions (SP2 and SP3). However, the Al2O3 content (30–80 mass%) and a scattering of the Al2O3 concentrations in these spherical inclusions in the High Al steel are significantly larger compared with those in the Low Al steel. Furthermore, the content of Al2O3 in the surface layer of spherical inclusions tends to increase, whereas the content of SiO2 decreases significantly during ladle treatment and casting. It may be explained by the higher activity of Al in the melt in comparison to the Si activity during formation and modification of inclusions in the HAl steel. It was shown in Table 3 that the solid cores of SP3 inclusions are not homogenous spinel inclusions as the typical IR inclusions and clusters. The SP3 inclusions often contain separate phases of Al2O3 and MgO. Although the composition of most spherical inclusions corresponds to the solid phase, the surface layer that covered the solid core correlate with the liquid zone at a given melt temperature of HAl steel (1711–1761 K). As a result, about 75% of the inclusions in the High Al steel have a spherical shape.
The Al2O3 content in IR inclusions and clusters in the HAl steel is slightly increased from 66 to 73 mass% on average whereas the contents of SiO2 and CaO are decreased till 2 mass% during ladle treatment and casting. These inclusions and clusters are mostly MgO·Al2O3 spinel. According to the MgO–Al2O3–SiO2–CaO diagram,35) all IR inclusions and clusters in HAl steel inclusions are solid.
Based on the consideration of contact angle (θ) between Fe–Cr melt and pure MgO or pure Al2O3 at 1923 K under an Ar atmosphere, Park and Kim12) concluded that the Al2O3-rich inclusions in the Fe–Cr melt have a larger tendency for cluster formation than the MgO-rich inclusions. Moreover, the Al2O3 inclusions are often responsible for nozzle clogging.1) In this study, an effect of an increased Al2O3 concentration in the surface layer of inclusions is considered and discussed regarding the possibility of cluster formation and nozzle clogging during casting of given steel grades. The ratio of MgO to Al2O3 contents in the surface layer of inclusion is shown in Fig. 7 as a function of size for typical inclusions and clusters in Low Al and High Al steels. It can be seen that the (mass% MgO)/(mass% Al2O3) ratio for most IR inclusions and clusters in the LAl steel is drastically higher than that for spinel inclusions. Therefore, the spinel inclusions were not observed in this steel grade. The IR inclusion that are located below the line for MgO·Al2O3 in Fig. 7(a), correspond to the almost pure Al2O3 inclusion that is present only in the L1 sample. Almost all IR inclusions and clusters in the High Al steel are spinel inclusions. However, the (mass% MgO)/(mass% Al2O3) values for most IR inclusions and clusters in the HAl steel samples are smaller than that for spinel inclusion. It means that the concentration of Al2O3 in inclusion surface layer exceeds the value stoichiometrically required for a spinel formation. Based on the obtained results, it can be concluded that the surface layer of IR inclusions and clusters in HAl steel was enriched by the Al2O3 oxide, as is shown schematically in Table 4. As a result, these IR inclusions can easily be clustered and precipitated on the inner nozzle walls during casting.

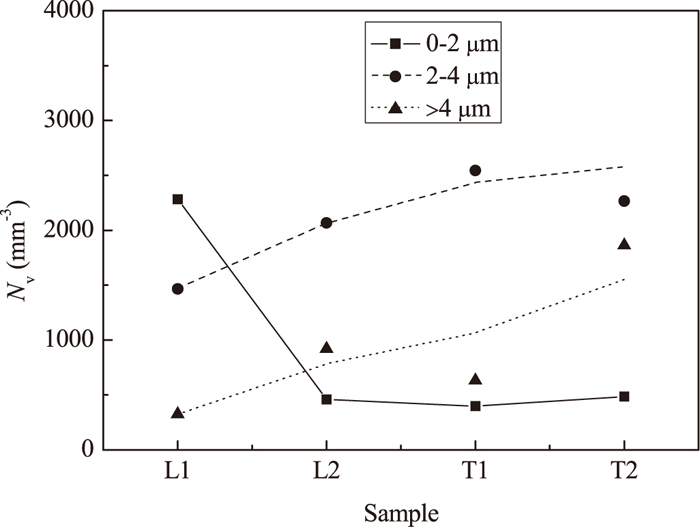
A relationship between the number of IR inclusions and clusters, size and sampling time during High Al steel is shown in Fig. 8. It can be seen that the number of smaller size spinel inclusions and clusters (< 2 μm) decreases significantly during ladle treatment due to the clustering. As a result, the numbers of larger size spinel IR inclusions and clusters (2–4 and > 4 μm) are increased during all times of ladle treatment and casting. However, it should be noted that the number of clusters (> 4 μm) increases significantly during casting when the Al2O3 contents in the surface layer of inclusions reached the maximum values (73 ± 4 mass% in T2 sample, Table 4). This is in good agreement with that the Al2O3 rich inclusion can easily be clustered as mentioned before. The material of the nozzles is alumina-graphite in both heats in this study. The alumina rich layer of the nozzle will be exposed to the liquid steel after a dissolution of the graphite rich layer has taken place.36) Therefore, the Al2O3 rich spinel inclusions can easily be clustered and precipitated on the alumina network of the nozzle wall.
Phase stability diagram was calculated in order to confirm the conditions for the formation of different oxide phase in Low Al and High Al steel. The thermodynamic model in this study is based on Darken’s quadratic formalism and Redlich-Kister type polynomial, which is more suitable for high alloy steel.27,28,29,30) The thermodynamic interaction parameters employed in the present study are shown in Appendix in Table A1.
As was discussed above, the SiO2–CaO–MgO–Al2O3 phases precipitated on a surface of MgO or Al2O3 inclusions in the present steels after alloying by FeSi. Unfortunately, reliable data of Ω (the interaction parameter) values for Ca in high alloy steels have not been presented in the literature up to now. Moreover, the content of CaO in all IR and most spherical (SP2 and SP3) inclusions is significantly smaller in comparison with SiO2 and Al2O3 (Table 4). Therefore, the following reactions were considered for calculations of the phase stability diagram of Mg–Al–Si–O system in Low Al and High Al steel:
|
Si(l)+2O(l)=Si
O
2
(s),
Δ
G
o
(1)
=-946 350+197.64·
T
| (1) 37) |
|
2Al(l)+3O(l)=A
l
2
O
3
(s),
Δ
G
o
(2)
=-1 682 927+323.24·
T
| (2) 37) |
|
Mg(l)+O(l)=MgO(s),
Δ
G
o
(3)
=-607 600+115.0·
T
| (3) 30) |
|
3A
l
2
O
3
(s)+2Si
O
2
(s)=3A
l
2
O
3
⋅2Si
O
2
(s),
Δ
G
o
(4)
=-8 600-17.41·
T
| (4) 37) |
|
2MgO(s)+Si
O
2
(s)=2MgO⋅Si
O
2
(s),
Δ
G
o
(5)
=-67 200+4.31·
T
| (5) 37) |
|
A
l
2
O
3
(s)+MgO(s)=MgO⋅A
l
2
O
3
(s),
Δ
G
o
(6)
=-20 790-15.7·
T
| (6) 5) |
|
2MgO(s)+2A
l
2
O
3
(s)+5Si
O
2
(s)=2MgO⋅2A
l
2
O
3
⋅5Si
O
2
(s),
Δ
G
o
(7)
=297 410-229.2·
T
| (7) 37) |
where, Δ
Go represents the Gibbs free energy change (J/mol), T represents the temperature (K). By combining
Eqs. (1),
(2),
(3),
(4),
(5),
(6),
(7), the Δ
Go value can be determined for the following reaction:
|
6Al(l)+2Si(l)+13O(l)=3A
l
2
O
3
⋅2Si
O
2
(s),
Δ
G
o
(8)
=-6 950 081+1 347.59·T
| (8) |
|
2Mg(l)+Si(l)+4O(l)=2MgO⋅Si
O
2
(s),
Δ
G
o
(9)
=-2 228 750+431.95·T
| (9) |
|
2Al(l)+Mg(l)+4O(l)=MgO⋅A
l
2
O
3
(s),
Δ
G
o
(10)
=-2 311 317+423.45·T
| (10) |
|
4Al(l)+2Mg(l)+5Si(l)+18O(l)=2MgO⋅2A
l
2
O
3
⋅5Si
O
2
(s),
Δ
G
o
(11)
=-9 015 414+1 637.3·T
| (11) |
Equations for determination of the partial molar excess for free energy change of Mg, Si, Al and O based on Redlich-Kister type polynomial are given in Appendix. The activity of MgO, SiO2, Al2O3, 3Al2O3·2SiO2, 2MgO·SiO2, MgO·Al2O3 and 2MgO·2Al2O3·5SiO2 phases are taken as unity. The equilibrium phase stability diagrams for Mg–Al–Si–O system in Low Al and High Al steel are shown in Fig. 9. As can be seen, the compositions of both LAl and HAl steels are located in the MgO stable zone during the initial period of the ladle treatment. Therefore, the pure MgO inclusions can precipitate in both heats during the initial stage of ladle treatment. Then, in Low Al steel (Fig. 9(a)) the 2MgO·SiO2, MgO·Al2O3 and 2MgO·2Al2O3·5SiO2 phases can precipitate in the melt. However, the amount of MgO·Al2O3 phase is small due to the small Mg concentration range for this phase (around from 2 to 0.08 ppm). After then, the 3Al2O3·2SiO2 and SiO2 phases will heterogeneously precipitate on a surface of formed solid inclusions. It should be noted that the amount of 3Al2O3·2SiO2 and SiO2 phases can be significantly larger (particularly in the inclusion surface layer) than that of the MgO·Al2O3 phase. This fact is in good agreement with the obtained composition results for the SP2 inclusions, in which the concentrations of SiO2 and Al2O3 increased during ladle treatment and casting of LAl steel while the MgO content decreased. In the High Al steel (Fig. 9(b)), after formation of some amount of MgO phase, the MgO·Al2O3 spinel phase may precipitate heterogeneously and homogeneously in this melt. However, the amount of MgO·Al2O3 phase is significantly larger in comparison to the MgO phase. Finally, according to the obtained phase stability diagram for HAl steel, the Al2O3 and/or 3Al2O3·2SiO2 phases can precipitate as a surface layer of inclusions. The 3D composition analysis of inclusions in the HAl steel shows some increasing of Al2O3 in the IR inclusions (Table 4). Some increasing of Al2O3 and decreasing of SiO2 contents in the SP2 and SP3 inclusions may be explained by precipitation of 3Al2O3·2SiO2 and 2CaO·Al2O3·SiO2 phases in which the (mass% SiO2)/(mass% Al2O3) ratio is close to the value obtained in the T2 sample (=0.49 on average). As a result, the CaO contents in SP2 and SP3 inclusions increased in both heats.

In the steelmaking companies, it is difficult to estimate the content of soluble Mg in steel samples with enough accuracy. Furthermore, the SiO2 and Al2O3 are the main components of inclusions in T2 samples in LAl and HAl steel respectively, according to the obtained experimental results. Therefore, the phase stability diagram of Al–Si–O system is also considered in the high-Si steel case in this study. The phase stability diagram of the Al–Si–O system for the LAl and HAl steel is shown in Fig. 10 for different temperatures corresponding to each heat. It can be seen that the contents of Al and Si in steel of the Low Al steel corresponds to the 3Al2O3·2SiO2 phase stable zone. In this case, the possibility for pure Al2O3 precipitation and MgO·Al2O3 formation is very low. As deposition of 3Al2O3·2SiO2 phase, the Al content in the melt decreases and the SiO2 starts to precipitate. Depending on Al and Si contents, the 3Al2O3·2SiO2 and/or SiO2 phases can precipitate during ladle treatment and casting, which fact is verified by the inclusion compositions obtained from the experimental results. However, the composition of steel in the High Al steel correlates to the Al2O3 stable zone. It means that the Al2O3 and/or MgO·Al2O3 phases are precipitated in this steel, as was verified by the inclusion compositions in the HAl steel. Moreover, it can be seen in Fig. 10 that the zone of Al2O3 precipitation increases with an increased content of Al and with a decreased temperature of liquid steel. Therefore, the higher Al content (till 0.009 mass%) and lower temperature (till 1711 K) in the High Al steel might be the main reasons for obtaining a higher Al2O3 content in surface layer of spinel inclusions.
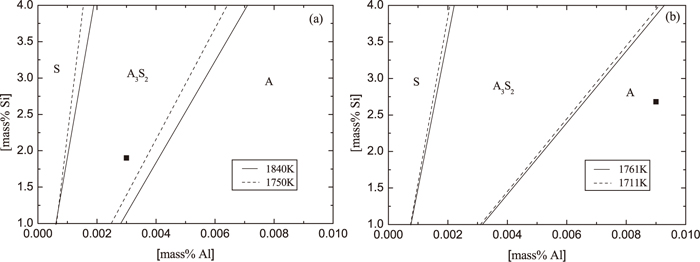
Thus, for avoiding of spinel formation in liquid HSiNC stainless steels and nozzle clogging problem during casting, the critical concentration of Al content in the melt can be determined for different Si contents and melt temperatures based on the obtained phase stability diagram. For instance, the Al content in the melt for given High Al steel should be lower than 0.006 mass%.
;%0A%09%09%09newWindow.document.open();%0A%09%09%09newWindow.document.write('<img src=%22./Graphics/53_2099_tbl_2.jpg%22>');%0A%09%09%09newWindow.document.close();%0A%09%09)
;%0A%09%09%09newWindow.document.open();%0A%09%09%09newWindow.document.write('<img src=%22./Graphics/53_2099_tbl_3.jpg%22>');%0A%09%09%09newWindow.document.close();%0A%09%09)
;%0A%09%09%09newWindow.document.open();%0A%09%09%09newWindow.document.write('<img src=%22./Graphics/53_2099_tbl_4.jpg%22>');%0A%09%09%09newWindow.document.close();%0A%09%09)