Regular Article
A Kinetic Model to Predict the Compositions of Metal, Slag and Inclusions during Ladle Refining: Part 1. Basic Concept and Application
2013 年 53 巻 12 号 p. 2110-2117
詳細
2013 年 53 巻 12 号 p. 2110-2117
A kinetic model to predict chemical composition changes in molten steel, slag, and inclusions in ladle refining was developed and used to elucidate the mechanism underlying the change in the chemical composition of the inclusions. The coupled reaction model was applied to estimate the reaction between molten steel/slag and molten steel/inclusion originating from the slag. The thermodynamic calculation software, FactSage6.3, was employed to obtain the activity of each component in the slag phase. Empirical equations were applied to the reaction between the slag and the refractory. The resulting model can calculate changes in (1) the composition of each element in the molten steel, slag, and the inclusion originating from the slag, (2) the amount of inclusion originating from the slag and the deoxidation products, and (3) the ratio of the inclusion originating from the slag and the deoxidation products to the total inclusion. The calculated results were found to agree with the operational results of a 165 t ladle refining process reported in the literature. The deoxidation products altered from alumina to a MgO·Al2O3 spinel-type inclusion due to an increase in the Mg content of steel. In the average composition changes of each element in the total inclusions, calculated results for the MgO and Al2O3 contents were also found to agree with the operational results.
As the demand for high-quality steel continues to increase, the ladle refining process has become increasingly important in recent times to obtain molten steel with the suitable composition and cleanness. Precise control of the inclusion composition and the reduction of the sulfur content of steel are very important. However, the reactions in the ladle treatment of steel are complex, as they occur simultaneously among the molten steel, added alloying elements, slag, and the refractory, because of which the mechanisms underlying changes in the composition of the inclusions have not yet been completely understood.
In the past, the reactions that occur during the ladle treatment were investigated under the assumption of an equilibrium state.1,2) If the entire ladle treatment system reaches the equilibrium, then the oxide phase must have a uniform composition. However, in the actual steel present in the ladle, the chemical composition of the slag differs from that of the inclusions. Moreover, the chemical compositions of the inclusions are non-uniform, i.e., inclusions with various compositions have been observed. These facts indicate that chemical reactions in the ladle do not reach their equilibrium state, and that the differences in the reaction rates between steel and each inclusion result in the non-uniformity in the inclusion composition. In addition, a MgO·Al2O3 spinel-type inclusion forms, even though magnesium is not added during the treatment.3) From a thermodynamic consideration, it is presumed that magnesium is formed in the molten steel due to the reduction of MgO in the slag by Al, which is added to the molten steel as a deoxidizer. In order to understand these phenomena in refining, a process analysis based not only on the equilibrium theory but also on the reaction kinetics is necessary.
Okuyama et al.4) measured the change in the chemical composition of steel by the reaction between the molten steel and the slag in a small-scale induction furnace to simulate the reactions in the ladle refining process. Then, they calculated the chemical reaction kinetics by using the coupled reaction model in which the mass transfer of each element was assumed as the rate-controlling step. Graham et al.5) also analyzed the operational results of 165 t ladle refining process using the coupled reaction model considering the reaction between the molten steel and the slag and estimated the desulfurization behavior as well as the composition changes in the metal and the slag. However, the analyses that consider the reactions occurring simultaneously among the molten steel, added alloying elements, slag, inclusions and refractory during the ladle refining process have not been reported in the literature.
Therefore, in order to clarify the mechanism of the composition change in steel, slag, and inclusion in the ladle refining process, a kinetic model that considers the reaction between the metal and the slag as well as that between refractory/slag and metal/inclusion was developed.
In this study, a kinetic model is developed based on the concept reported by Kitamura6) to analyze the changes in the composition of the metal, slag, and the inclusions in the ladle refining process. The following reactions are considered in this model:
(1) Reactions between the molten steel and the slag
(2) Reactions between the molten steel and the inclusions originating from the slag
(3) The deoxidation reaction caused by the addition of alloying materials
(4) Dissolution of the refractory into the slag phase
(5) (a) Formation, (b) floatation, and (c) agglomeration of the inclusions.
In this model, the molten steel and slag phases are separated into the interface and bulk zones, and the zones in each phase are circulated at a constant rate by means of argon gas stirring (Fig. 1). Dissolution of elements from the refractory into the slag is taken into consideration, because they affect the chemical composition of the molten steel indirectly via the reaction between the slag and the molten steel. On the other hand, the reaction between the molten steel and the refractory is not considered because reaction rate is lower than that for the reaction between the molten slag and the refractory. Si, Mn, and Al are added as ferrosilicon alloy, ferromanganese alloy, and metallic aluminum, respectively. Since the densities of ferrosilicon and ferromanganese are greater than that of slag, they are added to the bulk zone of the molten steel, as shown in Fig. 1. On the other hand, since metallic aluminum has low density, it is added to the interface zone of the molten steel.
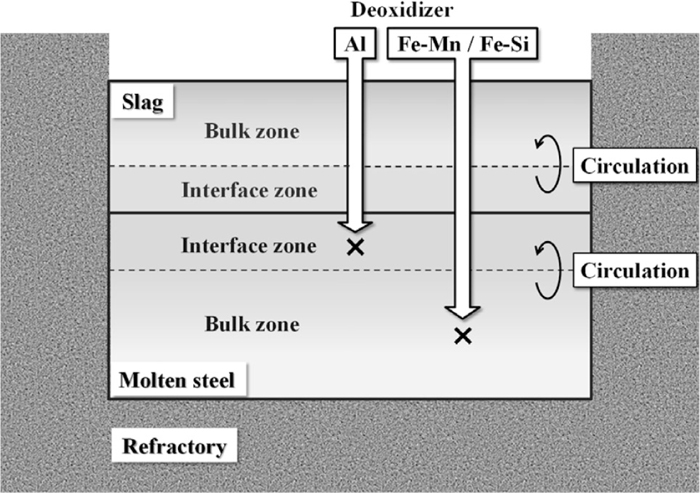
Schematic of the calculation model.
Figure 2 shows an illustration of the calculation concept. In this model, we consider the interaction between six phases, i.e., molten slag, molten steel, refractory, alloying materials, inclusion originating from the slag, and deoxidation products. The chemical reaction between the molten slag and the molten steel and that between the inclusions originating from the slag and the molten steel are calculated using the coupled reaction model. The dissolution rate of the refractory into the molten slag and the deoxidation reaction because of the added alloying materials are also considered. The inclusion originating from the slag and the deoxidation products are recognized as independent phases, and the average composition is calculated. Therefore, the composition of small inclusion particles dispersed in metal phase is not considered. In every time interval, a part of the slag is entrapped in the metal at a constant ratio (α), and causes an increase in the volume of the inclusion originating from the slag phase. Moreover, in every time interval, a part of the deoxidation products agglomerates with the inclusion originating from the slag at a constant ratio (γ). In every time interval, a part of the deoxidation products and a portion of the inclusion originating from the slag float in the slag at a constant ratio (β), leading to a decrease in their volume. The composition and volume of the slag are affected by the reaction between the metals, dissolution of the refractory, the mixing of the floating inclusions, and the entrapment into steel to form the inclusion originating from the slag. On the other hand, the composition and volume of steel are affected by the reactions between the slag, reactions between the inclusions originating from the slag, dissolution of the alloying materials, and by the deoxidation reaction. Similarly, the composition and volume of the inclusion originating from the slag are affected by the reactions between steel, agglomeration with deoxidation products, floatation to slag, and the entrapment from the slag, whereas that of the deoxidation products are affected by the deoxidation reaction, agglomeration with the inclusion originating from the slag, and floatation to slag. Details of each interaction are explained in the subsequent sections.
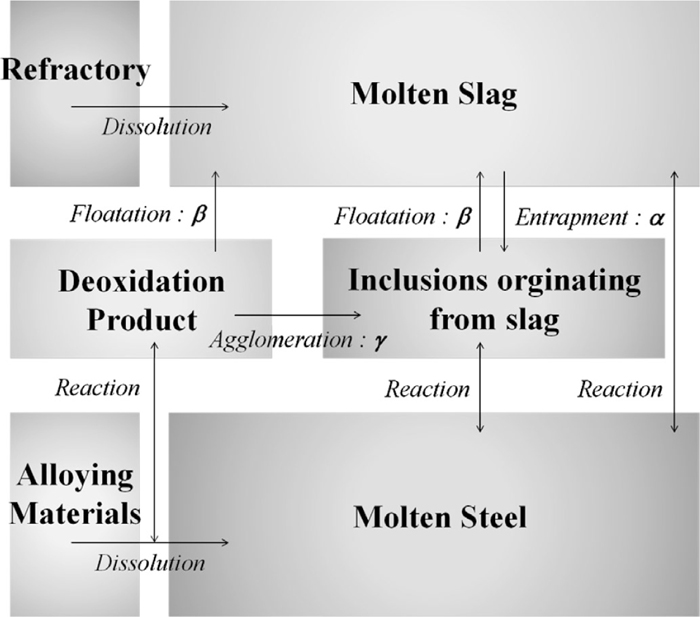
Calculation concept.
In the steel-making process, kinetic analysis is often conducted using a reaction model under the assumption that mass transfer is the rate-controlling step. When the process is not in equilibrium and multiple reactions occur simultaneously, as in hot metal dephosphorization, the coupled reaction model7,8) is used. In this study, the coupled reaction model is applied to the reaction between the metal and the slag phase. In this model, reactions are described via the double film theory, assuming equilibrium conditions at the interface. For example, in the oxidation reaction of element “M” in Eq. (1), the molar flux density (JM) is described by Eq. (2) whose left and right parts represent the molar flux of each element in the metal and the slag phase, respectively. The driving force of mass transfer of each element in the metal and the slag phase is expressed by the concentration difference between the interface and bulk phase. In this equation, the molar flux density of each element flowing into the interface is assumed to be equal to that flowing out of the interface. The equilibrium relation at the interface is represented by Eq. (3). By calculating the activity coefficient of each element in the metal and the slag phase and the equilibrium constant, the equilibrium partition ratio of each element (EM) is obtained. In this model, Al, Si, Mn, Ca, and Mg are considered as element “M.”
| (1) |
| (2) |
| (3) |
The molar flux densities of Fe and oxygen are calculated using Eqs. (4) and (5), respectively.
| (4) |
| (5) |
Equation (6) represents the desulfurization reaction, while Eq. (7) describes the molar flux density. The equilibrium relation is described by Eq. (8) and is calculated using the relational expression involving optical basicity and sulfide capacity, as reported by Sosinsky et al.9)
| (6) |
| (7) |
| (8) |
Equation (9) expresses electrical neutrality and indicates that the total molar flux densities of cations and anions are assumed to be equal.
| (9) |
The thermodynamic calculation software, FactSage6.3, was linked to the developed program coded by Visual C++ through ChemApp to calculate the activity of each component in the slag phase at every step of the calculation.
The reaction area is calculated as the cross sectional area of furnace. The mass transfer coefficient of the metal phase is calculated using an empirical equation as a function of the stirring energy, as reported by Kitamura et al.,8) represented in Eqs. (10) and (11). This coefficient is used for every element in the metal phase. Equations (12) and (13) represent the average mass transfer coefficient of the slag phase. It is set as one-tenth of that of the metal phase, because the diffusion coefficient of each component in the slag phase is 10−100 times smaller than that in the metal phase.8) This value is assumed to be the mass transfer coefficient of CaO in the slag phase; the ratio of mass transfer coefficient of each oxide to that of CaO in the slag is assumed to be proportional to the one-half power of the ratio of the diffusion coefficient.
| (10) |
| (11) |
| (12) |
| (13) |
The inclusion resulting from the entrapment of the top slag in the molten steel is named the inclusion originating from the slag. The calculation method for the reaction between the molten steel and the inclusion originating from the slag is similar to that explained in Section 2.1. The reaction area is calculated by multiplying the surface area of one inclusion particle with the number of inclusions, assuming a spherical inclusion (10 μm in diameter). Equations (14) and (15) represent the mass transfer coefficient in metal phase for an injected flux particle in hot metal dephosphorization.10) In this model, these equations are adopted to calculate the mass transfer coefficient of the inclusion particles originating from the slag.
| (14) |
| (15) |
Equations (12) and (13) are used to calculate the mass transfer coefficient of the liquid oxide phase in the inclusion originating from the slag using the mass transfer coefficient of the molten steel calculated from Eqs. (14) and (15). However, in the actual calculation, the mass transfer coefficient is assumed to be one-fiftieth of the value obtained using Eq. (14), because the composition change of each element in the inclusion originating from the slag is too fast and unstable when the value obtained from Eq. (14) is used.
In this study, the inclusion size is very important factor because it affects not only the interfacial area but also km and uslip in Eqs. (14) and (15). However, the size distribution of inclusion originating from slag during ladle treatment is not known. Therefore, in this paper, the size is just assumed as 10 μm to carry out the model calculation. The study on the size distribution of the inclusion originating from slag is a future subject.
2.3. Dissolution Rate of Refractory in the Slag PhaseIn this study, MgO is considered as the refractory. The dissolution rate of MgO in the slag is also taken into account, which is calculated using Eqs. (16) and (17), empirically obtained by Umakoshi et al.11) In Eq. (16), the mass transfer of MgO in the slag phase is assumed to be the rate-controlling step, and the driving force for the decrease in the refractory thickness is expressed by the concentration difference between the MgO content and the saturated MgO content in the molten slag. Equation (17) was obtained through experiments to determine the mass transfer coefficient of MgO in the slag phase.11)
| (16) |
| (17) |
In Eq. (16), rm is the refractory thickness (m); kMgO is the mass transfer coefficient of MgO in the slag phase (m/s); ρs and ρr are the densities of the slag and the refractory, respectively (kg/m3); (%MgO) is the concentration of MgO in the liquid slag; and (%MgO)* is the saturated concentration of MgO. In Eq. (17), St is the Stanton number (k/u), Sc is the Schmidt number (v/D), Re is the Reynolds number (d·u/v), k is the mass-transfer coefficient (m/s), u is the characteristic velocity (m/s), v is the dynamic viscosity (m2/s), D is the diffusion coefficient (m2·s), and d is the characteristic length (m).
In this calculation, the characteristic velocity (m/s) is assumed as the rising velocity of the molten steel in the plume area created by the injected gas, as proposed by Sawada et al.12) In addition, the characteristic length (m) is determined to be the one-half power of the contact area between the slag and the refractory.
2.4. Formation, Coagulation, and Floatation of the Inclusions in the Slag PhaseIn this model, two sources of inclusions are considered:(1) entrapment of slag in the metal phase and (2) the deoxidation product formed by the addition of the deoxidizer. MnO–SiO2, Alumina, MgO·Al2O3 spinel, and CaO–Al2O3 are considered as the deoxidation products.
The following deoxidation reactions are taken into consideration: Eq. (18) is the oxidation reaction to form pure Alumina, while Eqs. (19), (20), (21) are the oxidation reactions to form a solid solution or liquid oxide. For simplicity, in order to calculate the deoxidation equilibrium, the mole fraction and the activity of CaO in Eq. (19) are assumed to be 0.525 and 0.2, respectively; those of MgO in Eq. (20) are assumed to be 0.5 and 0.08, respectively; and those of SiO2 in Eq. (21) are assumed to be 0.575 and 0.4, respectively.
| (18) |
| (19) |
| (20) |
| (21) |
The free energy change of formation (ΔG) is described in Eq. (22) for Eq. (21), and this value depends on the equilibrium constant and the concentration of the solute element in steel.
| (22) |
To achieve the deoxidation reaction, after the addition of deoxidizer, the ΔG value of each reaction is calculated. The reaction that has the smallest negative value of ΔG is deemed to occur, and the concentrations of the deoxidized element and oxygen are changed slightly. This procedure is repeated until the ΔG values in all reactions become positive.
In the inclusion originating from the slag, the volume ratio of the entrapped slag to the total slag is assumed as a constant, indicating that every second, some slag is constantly entrapped in the metal phase. The composition change owing to the chemical reaction is calculated by the model shown in Section 2.2.
As mentioned previously, a portion of deoxidation products agglomerates with the inclusion originating from the slag, while a part of deoxidation products and a part of inclusion originating from the slag inclusions float in the slag. The volume ratio of deoxidation products which agglomerate with the inclusion originating from the slag, and the volume ratio of the deoxidation products or the inclusion originating from slag, which float in the slag, are assumed as constants.
2.5. CirculationIn this model, the molten steel and the slag phases are separated into the interface and bulk zones, and the zones in each phase are circulated at a constant rate by means of argon gas stirring (Fig. 1). The perfect mixing time is calculated as a function of stirring energy using Eq. (23).13) Subsequently, the circulation rate of the molten steel phase is calculated using Eq. (24). In this equation, it is assumed that each zone becomes uniform after circulating for three times.13) In the slag phase, the circulation rate is calculated using Eq. (25) by means of the mass ratio of the molten steel to the slag.
| (23) |
| (24) |
| (25) |
Considering the above reactions, the composition changes of each element in the molten steel, the slag, and the inclusion are calculated using a small time step, Δt, by inputting initial data such as the composition of the molten steel and the slag, the amount of the additional elements, temperature, and size of the ladle.
Figure 3 shows a flow chart of the calculation. The dissolution rate of the refractory in the slag phase is calculated and the composition of each element in the slag is altered. The molar flux densities between the molten steel and the slag are subsequently calculated, and the composition of each element in the slag and metal phases are changed. Next, the molar flux densities between the molten steel and the inclusions originating from the slag are calculated and the composition of the steel and the inclusion are changed. The mass of circulation between the bulk and interface zones in the molten steel and slag phase is calculated, and the composition of each element in each zone of the steel and the slag are exchanged. The deoxidizer is added to the metal phase at a predetermined time and the deoxidation reaction is calculated if the ΔG of the deoxidation reaction has a negative value. Then, the amounts of the slag entrapment, agglomeration, and floatation of the inclusion are calculated, and the composition of each element in the slag and the inclusion originating from the slag is modified. This procedure is repeated until the predetermined calculation time is reached. The time interval for calculation is 0.1 s for the reaction between the slag and the metal, the slag and the refractory, and circulation and deoxidation reactions. For the reaction between steel and the inclusion originating from the slag, the time interval is fixed at 0.005 s to improve the stability of the calculation.
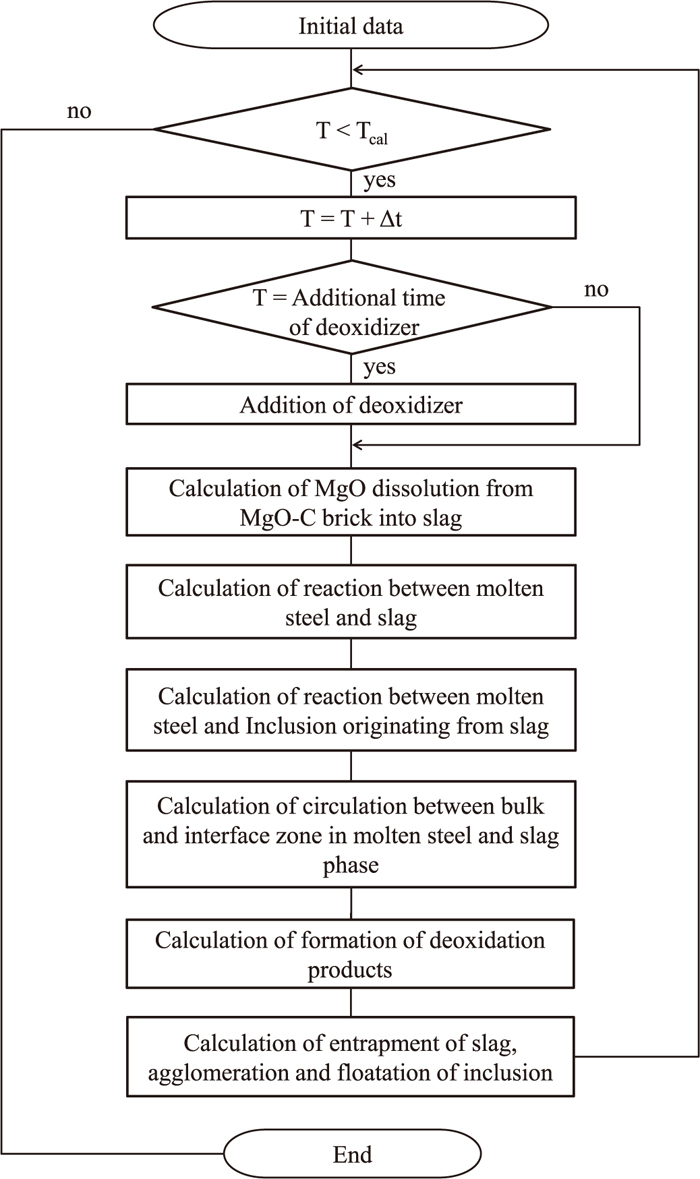
Flow chart of calculation.
The temperature of the molten steel is assumed to be constant and uniform at every position. The parameters regarding the behavior of the inclusion and the ratio of the bulk zone in the molten steel and slag phase are determined in the calculation by comparing the result with the experimental or operational results, such as the composition of the inclusion and the total oxygen.
This section shows an example of a calculation of the developed model. This model can specifically calculate the following changes:
(1) Changes in the composition of each element in the molten steel and the slag
(2) The desulfurization reaction
(3) Changes in the amounts of the inclusion originating from the slag and the deoxidation products
(4) Changes in the composition of each element in the inclusion originating from the slag
(5) Changes in the ratio of the inclusion originating from the slag and the deoxidation products in the total inclusion.
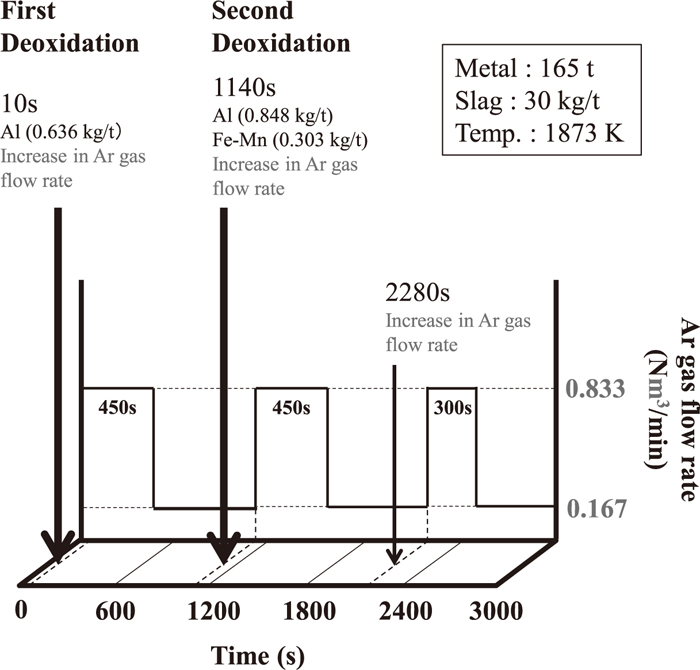
Graham et al.5) reported the operational results of 165 t ladle refining process. Therefore, the developed model calculation was conducted based on these operational conditions and compared with them. The initial chemical composition of the molten steel and the slag used in the study stated above are listed in Tables 1 and 2, and the operational conditions are shown in Table 3 and Fig. 4. In this operation, the molten steel and the slag were sampled at 480, 1080, 1560, 2160 and 2640 s after starting the treatment. Aluminum was added as a deoxidizer at 10 s (first deoxidation), and aluminum and ferromanganese were added at 1140 s (second deoxidation). For 450 s after the addition of the deoxidizer, Ar gas flow rate was increased from 0.167 to 0.833 Nm3/min. Additionally, in their study, titanium was added as a deoxidizer at 2280 s, and Ar gas flow rate was increased from 0.167 to 0.833 Nm3/min for 300 s after that. Therefore, the increase in Ar gas flow rate at 2280 s was considered in this calculation although titanium was not added. The aforementioned study then reported the empirical relational expression between the volumetric mass transfer coefficient of the molten steel and the effective stirring power represented in Eq. (26).
| (26) |
| (27) |
| Mn | Si | Al | Ca | Mg | O | S | |
|---|---|---|---|---|---|---|---|
| 0.12 | 0.008 | 0.001 | 10–6 | 10–6 | 0.01 | 0.06 | (mass%) |
| MgO | Al2O3 | SiO2 | CaO | MnO | FeO | CaS | |
|---|---|---|---|---|---|---|---|
| 8 | 32 | 5.9 | 51.5 | 0.8 | 1.9 | 0.01 | (mass%) |
| Weight of metal (t) | 165 |
| Weight of slag (kg/t) | 30 |
| Cross-sectional area of furnace (cm2) | 57684 |
| Ar flow rate (Nm3/min) | 0.833, 0.167 |
| Temperature of molten steel (K) | 1873 |
| Addition time of Al (s) | 10, 1140 |
| Addition time of Fe–Mn (s) | 1140 |
| Addition amount of Al | |
| in the 1st deoxidation (kg/t) | 0.636 |
| Addition amount of Al | |
| in the 2nd deoxidation (kg/t) | 0.848 |
| Addition amount of Fe–Mn (kg/t) | 0.303 |
Basic calculation conditions.
We used Eq. (26) for the calculation of the mass transfer coefficient instead of Eq. (11) to compare the calculation results with their operational results. The parameters based on the behavior of the inclusion and the ratio of the bulk zone used in the calculation is listed in Table 4. The details of the parameter determination using sensitivity calculation will be reported in a next report.14)
| Parameters | Ratio | |
|---|---|---|
| (1) | Entrapment of slag into molten steel (α) | 10–6 (%/s) |
| (2) | Floatation of inclusion into slag phase (β) | 0.1 (%/s) |
| (3) | Agglomeration of inclusion (γ) | 1 (%/s) |
| (4) | Bulk zone in molten steel and slag phase | 0.8 |
Figures 5 and 6 show the composition change in the molten steel and the slag, respectively. The operational results of the changes in the concentrations of Mg and Ca were not reported. The calculation results of the molten steel and the slag were found to be in agreement with the operational results. After the second deoxidation, SiO2 and FeO contents in the slag decrease, while that of Mn and Si increase. The aluminum content in the metal increases immediately following the addition of Al, and then gradually decreases. In addition, the calculated values for the concentration of Mg and Ca in the molten steel gradually increase in the early stages and rapidly increase after the second deoxidation. Finally, the concentrations of Mg and Ca in the molten steel reach ~1.1 and 0.5 ppm. The desulfurization behavior is also found to be in agreement with the operational results, as shown in Fig. 7.
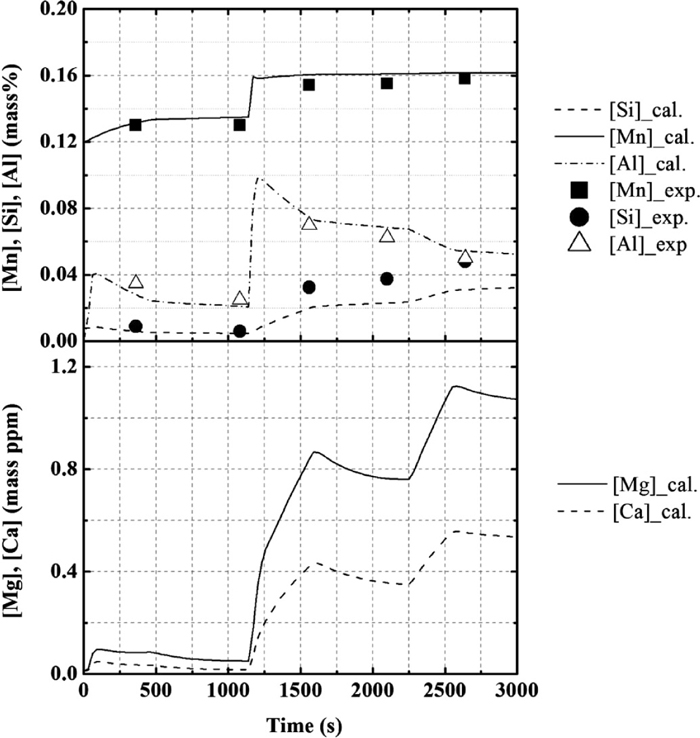
Calculation results for the concentration of Mn, Si, Al, Mg, and Ca in metal, in comparison with the operational results for the composition change with time.
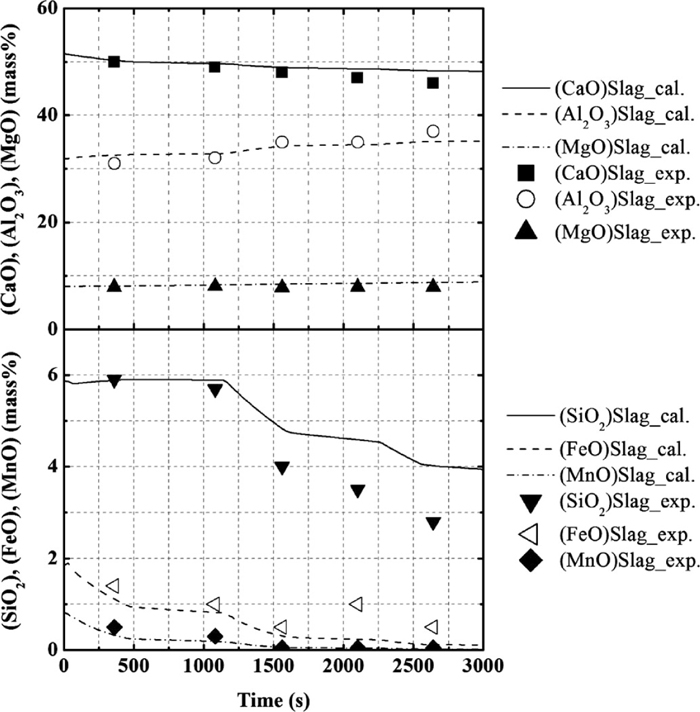
Calculation results for the concentration of CaO, Al2O3, MgO, SiO2, FeO, and MnO in slag, in comparison with the operational results for the composition change with time.
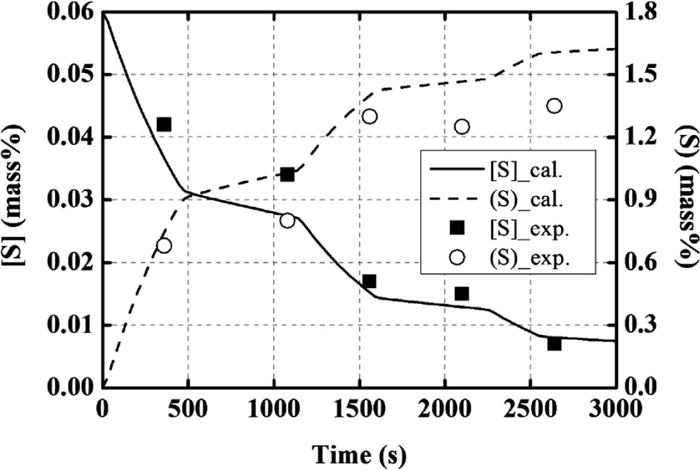
Calculation results for desulfurization behavior, in comparison with the operational results for the composition change with time.
Figure 8 shows the changes in the amounts of inclusions with time. The inclusions originating from the slag rapidly increase in the early stages but gradually decrease later due to its floatation in the slag phase. An alumina-type deoxidation product forms immediately following the first and second deoxidation, and then, its concentration gradually decreasesno. However, MnO–SiO2 or CaO–Al2O3 does not form. A MgO·Al2O3 spinel-type forms after the second deoxidation owing to the increase in the Mg content in steel.

Calculation results for the amount of total inclusion, inclusion originating from slag, alumina, and spinel.
Figure 9 shows changes in the composition of the inclusions originating from the slag. At the initial stage, SiO2, FeO, MnO originating from slag are reduced and form Al2O3. After that, CaO content originating from slag becomes low during the early stages, and the Al2O3 concentration is high due to the agglomeration of the alumina-type deoxidation product. After the second deoxidation, the Al2O3 concentration decreases gradually. In contrast, CaO and MgO concentrations increase gradually.
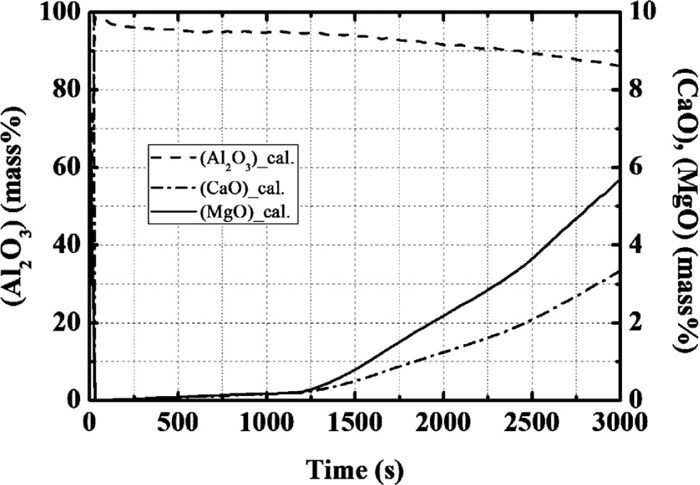
Calculation results for the concentration of CaO, Al2O3, and MgO in inclusion originating from slag.
The changes in the ratio of each type of inclusion to the total mass of the inclusions are shown in Fig. 10. In the early stages, the ratio of the alumina-type deoxidation product is ~70%, because alumina forms on the addition of Al. Subsequently, the amount of alumina-type deoxidation product decreases owing to agglomeration and floatation, and most inclusions change to the inclusion originating from slag. Following the second deoxidation, a MgO·Al2O3 spinel-type inclusion forms whose content increases. Finally, the ratio of the spinel reaches ~10% in the total inclusion.
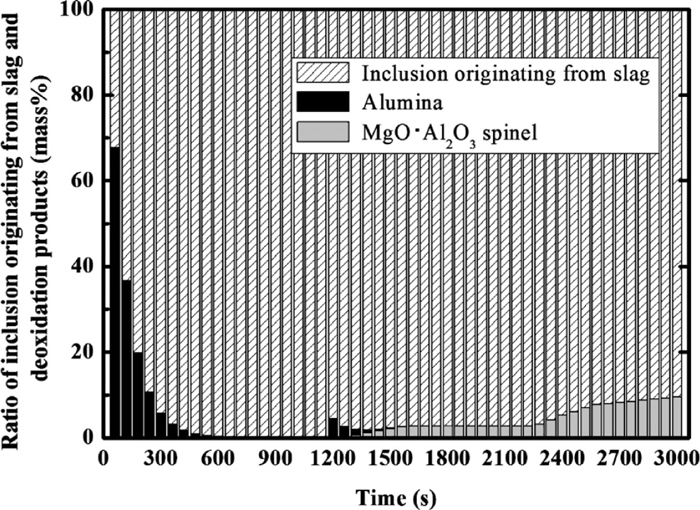
Change in the ratio of inclusion originating from slag and deoxidation products (alumina and spinel type).
Figure 11 shows the changes in the average composition of the total inclusion with time. In this case, the average composition of the oxide MOx is calculated using Eq. (28), where, (%MOx) in IOS, (%MOx) in DOP are the mass% of MOx in the inclusion originating from the slag and the deoxidation product, respectively, and WIOS and WDOP are the weights of the inclusion originating from the slag and the deoxidation product, respectively.
| (28) |
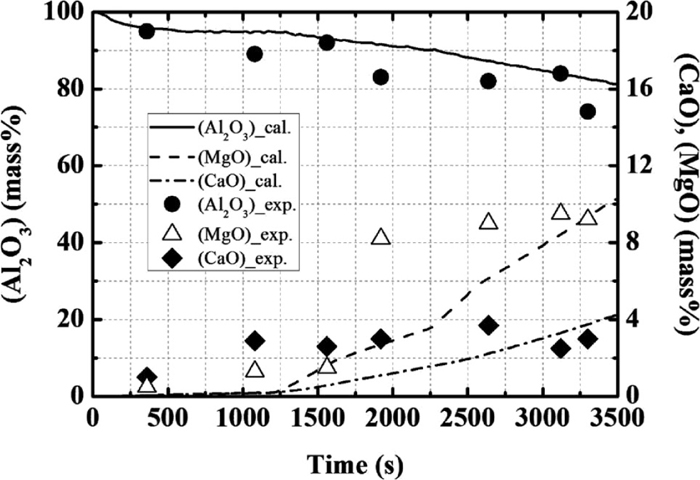
Calculation results for the average concentration of each element in total inclusion, in comparison with the operational results of the composition change with time.
The calculated changes in the contents of Al2O3, MgO and CaO are found to be in agreement with the operational results. After the second deoxidation, the content of MgO in the total inclusion increases because the amounts of inclusion originating from slag and alumina-type inclusion decrease, and the spinel-type inclusion forms and its content increases.
From these results, it is seen that the composition changes of steel, slag, and inclusion may be calculated using the simulation model. However, the precise values of parameters, especially the ratios of formation, coagulation, and floatation of the inclusions, are necessary for the calculation. The effect of these parameters on the calculation results will be discussed in a next report.
A model to simulate the reaction rate was developed in order to explain the kinetic mechanism of the changes in the composition of inclusions in ladle refining. The calculation results were compared with the operational results reported by Graham et al.5)
(1) This model can be used to calculate composition changes in the molten steel, the slag, and the inclusion in ladle refining. The coupled reaction model was applied to the reaction between the molten steel/slag phase and the molten steel/inclusion originating from the slag. The thermodynamic calculation software, FactSage6.3, was used to calculate the activity of each component in the slag phase. Empirical equations were used to calculate the rate of MgO dissolution in the slag from the refractory.
(2) The calculation results for the composition of each element in the molten steel and the slag, including the desulfurization reaction, were found to correspond with the operational results. The content of Mg in steel was found to increase due to the reaction between the molten steel and the slag.
(3) The deoxidation products changed from alumina to a MgO·Al2O3 spinel-type inclusion. However, the content of Al2O3 in the inclusion originating from the slag was high although the content of MgO gradually increased. The change in the average composition of each element in the total inclusion revealed that the calculated MgO and Al2O3 contents were in good agreement with the operational results.
The authors appreciate the financial support of the Research Grant of the 19th Committee of Steelmaking, the Japan Society for the Promotion of Science, and the ISIJ Research Promotion Grant of Iron and Steel Institute of Japan.