Abstract
In this study, in order to obtain complete size distribution results, the maximum carbide size in a Fe-17 mass% Cr-4 mass% C hypereutectic High Chromium Cast Iron (HCCI) produced with different cooling conditions, titanium additions and heat treatment conditions was determined by using the statistics of extreme values (SEV) method. In addition, the shape factor, circularity, was estimated in order to classify the type of carbides (primary M7C3 carbides, TiC carbides and secondary M7C3 carbides). Compared to the smaller size carbides, such as TiC carbides and secondary M7C3 carbides, it was found that the slope of the extreme value distribution (EVD) regression lines is lower for the large sized carbides such as primary M7C3 carbides than for the smaller carbides. Moreover, it was found that the circularity value for the larger size carbides is higher than for the smaller carbides. Furthermore, the estimated and observed maximum carbide sizes were compared with each other for all carbide types. The characteristic of the different carbide types are summarized and classified based on the shape factor. Finally, the relationship between the carbide size distribution including the maximum carbides size and mechanical properties is discussed based on the combination of a size distribution analysis and a maximum size analysis.
1. Introduction
The number, size and volume fraction of carbides play an important role in determining the mechanical properties (wear resistant properties and hardness) of tool steels, such as High Chromium Cast Iron (HCCI), High Speed Steel (HSS), etc. Hence, it is necessary to quantitatively and accurately measure the carbides size in the tool steel, particularly for the large scale carbides. This is due to that the large scale carbides can act as the destructive starting point of HCCI and HSS, etc. Moreover, they can also act as hard particles to accelerate the failure of tool steel in the wear applications process.
Recently, two analytical methods have often been used to estimate the maximum size of inclusions in a large volume of steel. One is the statistics of extreme values (SEV) method, which was developed and standardized by Murakami and co-workers.1,2,3,4) Moreover, Takahashi has studied the relationship between EVD of particle size from the 2D and 3D measurements by using numerical simulations based on the SEV method.5) The second method is the Generalized Pareto Distribution (GPD) method, which was developed by Shi and Atkinson.6,7,8) A detail comparison of these two methods has been described elsewhere.9) These methods are useful from the point of analyzing the inclusions data graphically. It should be noted that not only inclusions, but also carbides have a big effect on determining the performance of tool steel. However, very few reports estimate the maximum carbide size in tool steels by using these two methods. This is one important motivation for us to perform such an investigation. Moreover, the combination method between size distribution analysis and maximum size analysis is promoted in this investigation.
The maximum carbide (primary M7C3 carbides, TiC carbides and secondary M7C3 carbides) size in Ti-alloyed hypereutectic HCCI was studied by using the SEV method for different titanium additions, cooling rates and heat treatment conditions. Moreover, the characteristic of different types of carbides were discussed based on the shape factor (circularity value). Finally, the influence of the carbides size distribution including the maximum carbides size on the mechanical properties of Ti-alloyed hypereutectic HCCI is discussed based on the combined of a size distribution analysis and a maximum size analysis.
2. Two Analytical Methods for Estimation of the Maximum Size of Inclusions
Below the fundamental idea of the SEV method and the GPD method are described. However, a detail comparison between these two methods has been described elsewhere.9)
2.1. Statistics of Extreme Values (SEV) Method
The statistics of extreme values (SEV) method is based on measuring the maximum size of inclusions in randomly chosen areas or volumes. Thereafter, the Gumbel distribution function is used to predict the maximum size in a much larger area or volume.10) The SEV method is also useful for the quality control of steels and for improvements of the steelmaking processes.9) However, for the estimated maximum size from the SEV method, there is no upper limit for the estimated inclusion size. The estimated inclusion size increases linearly with the volume of steel, which is not expected during practical steelmaking. Figure 1 is an example to illustrate the SEV method. Here, the reduced variate is plotted versus the inclusion length.

The analysis procedure of SEV method is as follows. First of all, the maximum size of inclusions, which were observed from each micrograph, is ranked in an increasing order. More specifically, such as X1≤X2≤X3≤X4≤Xi≤…≤Xn, (1≤i≤n), where X is the maximum size of inclusions and n is the number of a unit volume or a unit area. Thereafter, the reduced variate (Red.Var.) of each size data, yi, was calculated by using the following equation:
|
y
i
=-ln(
ln(
i
n+1
)
)
(
1≤i≤n
)
| (1) |
In order to estimate the maximum size of an inclusion, the regression lines were determined from the extreme value distribution (EVD) for each experiment by using the Maximum Likelihood (ML) Method. The application of the ML method was done according to the ASTM E2283-03 standard.
13) This is a reference document for estimating the maximum size of inclusion by using the SEV method in ASTM Standards. Thereby, the regression lines were calculated as follows:
|
X
fit
=
δ
ML
⋅Red. Var. +
λ
ML
| (2) |
|
X
high
=
X
fit
+95%CI
| (4) |
where
δML is the location parameter of the extreme value distribution function and
λML is the scale parameter of the extreme value distribution function.
13) The range of error bars in every predicted value shows a 95% confidential interval (95%CI), which was determined by using the follows:
The standard error (SE)
i for each inclusion of length X can be calculated as follows:
|
SE
(X)
i
=
δ
ML
1.109+0.514⋅
y
i
+0.608⋅
y
i
2
n
(
1≤i≤n
)
| (6) |
Thus the SE value, SE(X)
max, for L
max can be calculated based on a probability P=99.9%. Then, the maximum size (L
max) of an inclusion in a reference volume or area (V
ref or A
ref) was calculated by using the following equations:
|
L
max
=-
δ
ML
ln(
-ln(
T-1
T
)
+
λ
ML
)
| (7) |
|
T=
V
ref
V
0
(
for volume investigation
)
| (8) |
|
T=
A
ref
A
0
(
for area investigation
)
| (9) |
where
V0 and
A0 are the unit volume and the unit area for SEV. Also,
T is the return period.
2.2. Generalized Pareto Distribution (GPD) Method
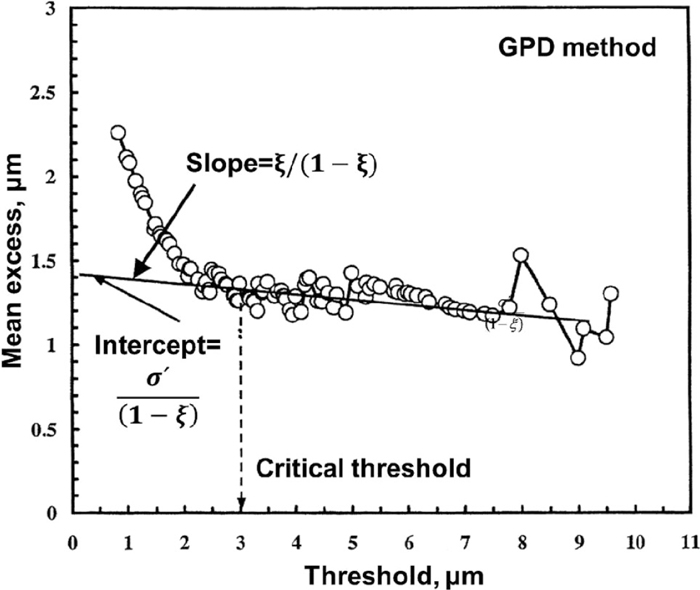
The Generalized Pareto Distribution (GPD) is the standard family of statistical distributions used for modeling data with values over a threshold value (u). This method was applied to inclusions in clean steels for the first time by Shi and Atkinson.6,7,8) The selection of the threshold value u is a major practical issue in this method. In contrast to the SEV method, the GPD method aims at measuring the inclusions, which are larger than a certain size. Moreover, it gives an upper limit for the inclusion size. Figure 2 shows an example of how illustrate the GPD method. The mean excess value is plotted as a function of the threshold value in a diagram. The analysis procedure of GPD method is as follows.7) The maximum inclusion for the chosen large volume V, XV can be calculated as follows:
|
x
v
=u-
δ′
ξ
{
1-
(Nv(u)V)
ξ
}
| (10) |
where:
δ ′>0 is a scale parameter and
ξ (–∞<
ξ<∞) is a shape parameter. The parameter
Nv(
u) represents the expected number of exceedance of
u in a unit volume. Here, it is first necessary to choose a certain size above which the inclusions are to be measured. Thereafter, once the inclusions have been measured, the mean excess value is plotted versus the threshold value. An illustrative example is shown in
Fig. 2. Thereafter, the plot is judged to determine where it becomes reasonably linear, rather than displaying the steep curve that tends to occur at the left hand end. The point beyond which it becomes reasonably linear is termed the critical threshold value. Thereafter,
NV(
u) is identified from the measured data. Finally, all the parameters for
Eq. (10) are known. Therefore, the characteristic size of the maximum inclusion
XV can be calculated for the chosen large volume
V.
In summary, both methods are useful to calculate the maximum inclusion size in a large volume (area) of the steel. In this case, the information is used to explain the wearing resistance properties control due to carbides. However, the SEV method is selected to estimate the maximum carbide size in this study because it is useful for the properties control of steels and for improvements of the steelmaking processes.9) Moreover, Murakami also succeeded to explain the fatigue properties due to inclusions by using the SEV method.
3. Experimental Procedure
3.1. Experimental Material and Measurement
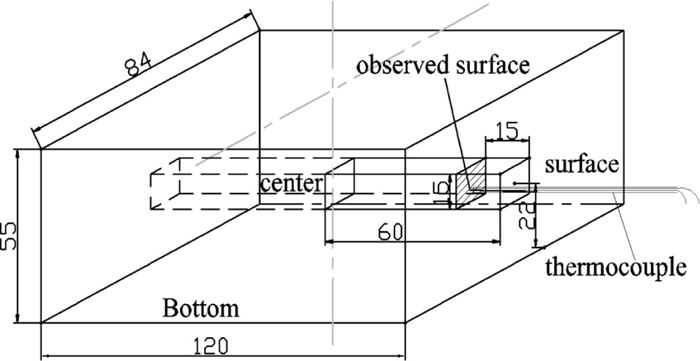
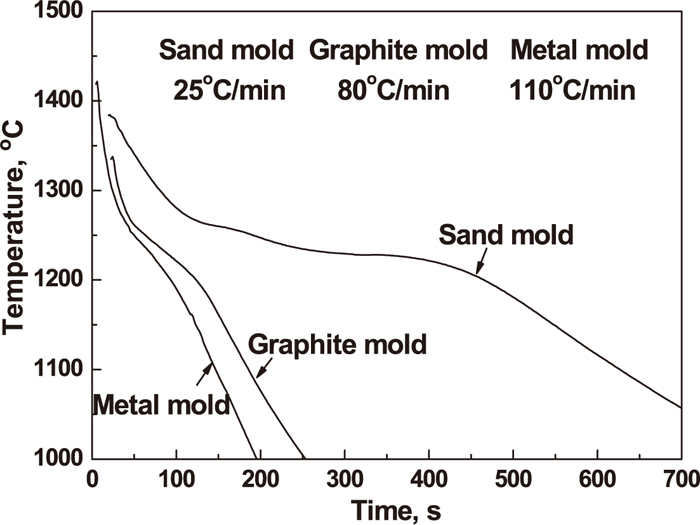
Sample preparation for Fe-17 mass% Cr-4 mass% C hypereutectic HCCI with different titanium additions, casting in the different molds and heat treated at different conditions was described in detail in our previous study.11,15,16) The as-cast samples, which were used for analyzing the maximum carbides size, were cut from an ingot and from a position near the thermocouple, as seen in Fig. 3.11) Moreover, the cooling curves, which were obtained from three kinds of mold, are shown in Fig. 4.11) Also, the heat treatment samples were selected from the as-cast ingot, which was casted in a graphite mold with 1.5% titanium addition. Furthermore, the as-cast samples and heat treatment samples were polished and observed by using Light Optical Microscopy (LOM) and Scanning Electron Microscopy (SEM) for conventional 2D (cross section) estimations of the maximum carbide sizes.
3.2. Estimation of the Maximum Carbides Size by Using SEV Method
In this study, the statistics of extreme values (SEV) was used to predict the maximum carbides size in a Fe-17 mass% Cr-4 mass% C hypereutectic HCCI. The analysis procedure of the SEV was performed according to Murakami’s method12) and following the ASTM E2283-03 standard.13) The size of a unit area for primary M7C3 carbides and TiC carbides is 0.505 mm2 (LOM) and 0.017 mm2 (SEM), respectively. This corresponds to a ×5 magnification micrograph (one pixel represented 0.555 μm) in a LOM and a ×400 magnification micrograph (one pixel represented 0.124 μm) in a SEM, respectively. In addition, the size of a unit area for secondary M7C3 carbides is 107.8 μm2 at a magnification of ×10000 and 420.3 μm2 at magnification of ×5000. The maximum carbide size has been measured in each unit area. Totally, 40 unit areas were examined for the carbide extreme value analysis according to the suggestions in the Murakami’s method for the inclusion.14) The total observed area for primary M7C3 carbides TiC carbides and secondary M7C3 carbides was 20.20 mm2, 0.692 mm2, and 0.106 mm2, respectively. The maximum size of carbides, dAmax, was calculated as the equivalent diameter of a circle by using the WinROOF image analyzer, which is commercial software.
4. Results
4.1. Estimation of Maximum Primary M7C3 Carbides Size
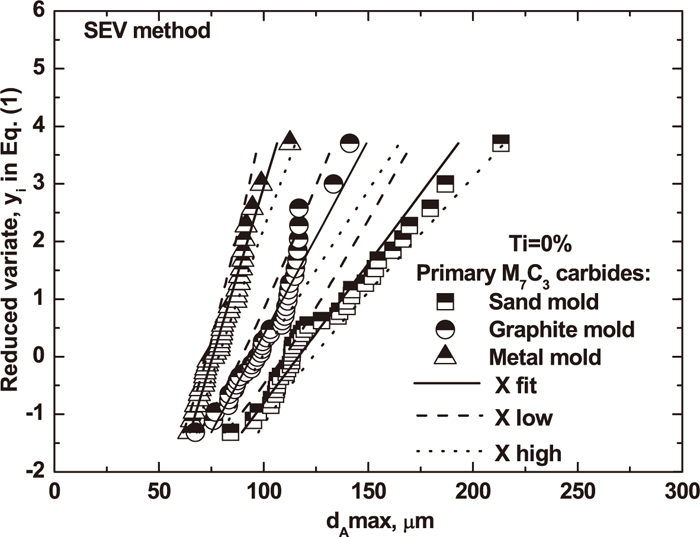
For all the samples of a Fe-17 mass% Cr-4 mass% C hypereutectic HCCI alloyed with titanium, the investigation unit area for primary M7C3 carbides is 0.505 mm2. This corresponds to a photograph when using a ×5 magnification. The number of measurements, the average size, d0, standard deviation (STDEV) for each maximum carbide and other experiments conditions are summarized in Table 1. Moreover, the slope value of regression lines, the observed maximum size and the predicted maximum size for primary M7C3 carbides are shown in Table 2.
Table 1. Experiment conditions of SEV method for primary M
7C
3 carbides.
| Exp. No. | Ti
(mass%) | Mold | Cooling Rate
(°C/min) | Mean d0 (μm) | STDEV | Image No. | Pixel
(μm) | Magnification | Per unit area
(mm2) |
|---|
| 1 | 0 | Metal | 110 | 80.38 | 10.22 | 40 | 0.555 | ×5 | 0.505 |
| 2 | 0 | Graphite | 80 | 102.00 | 15.48 |
| 3 | 0.75 | 76.62 | 13.65 |
| 4 | 1.5 | 29.68 | 6.14 |
| 5 | 3.0 | 25.87 | 6.16 |
| 6 | 0 | Sand | 25 | 129.04 | 28.02 |
Table 2. Regression line equations, observed value and predicted value for primary M
7C
3 carbides.
| Exp. No. | Regression line: y=c1x+c2 | Predicted dAmax (μm) | SE*
(μm) | Observed dAmax (μm) |
|---|
| C1 | C2 |
|---|
| 1 | 0.121 | 9.131 | 132.88 | 7.60 | 112.58 |
| 2 | 0.068 | 6.379 | 196.55 | 13.57 | 141.06 |
| 3 | 0.097 | 6.805 | 142.01 | 9.50 | 110.89 |
| 4 | 0.253 | 6.884 | 54.54 | 3.62 | 52.78 |
| 5 | 0.246 | 5.724 | 51.41 | 3.73 | 46.75 |
| 6 | 0.048 | 5.653 | 259.14 | 18.92 | 213.44 |
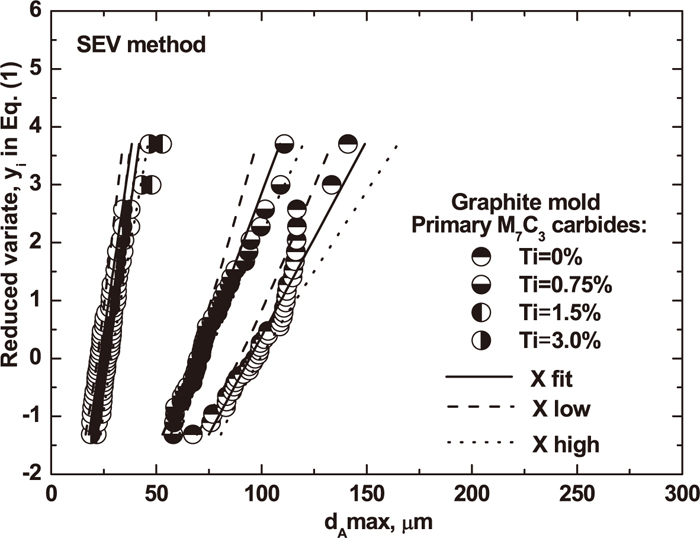
Figures 5 and 6 are plots of the size (dAmax) versus the reduced variate (yi) from six groups’ samples (each consisting of 40 observed areas from which the maximum carbide size has been determined). These extreme value distribution (EVD) figures confirm that a linear relationship holds between the size of the maximum carbides and the reduced variate. It was found that the sand mold had the slowest cooling rate, as expected. This means that the hypereutectic HCCI alloyed has the largest primary M7C3 carbides and the smallest slope of the EVD regression lines among the studied molds. The latter is especially true for carbide sizes larger than 150 μm, as seen in Fig. 5. In addition, for the smaller size carbides, such as for 1.5 mass% and 3.0 mass% titanium additions have a similar slope of the EVD regression lines, as seen in Fig. 6. It’s likely this is due to the different growing mechanisms. Also, the shape value between smaller sized and larger sized primary M7C3 carbides is different, as shown in detail in Table 2.
In present study, the shape factor, Circularity, was calculated as follows in order to classify the type of carbides:
|
Circularity=
4πA
p
2
| (11) |
where
A is the area of the shape and
p is the perimeter.
Figure 7 shows a typical size distribution of primary M7C3 carbides circularity versus the dAmax value for different molds and titanium additions. It was found that the circularity value of primary M7C3 carbides was in the range of 0.2–0.7. Moreover, the circularity value is slightly decreased with an increased cooling rate. However, the circularity values are not change too much in case of different titanium additions.
In summary, the circularity value of maximum primary M7C3 carbides, which have the typical hexagonal shape, is approximately 0.43, as shown in Fig. 7.
4.2. Estimation of Maximum TiC Carbides Size
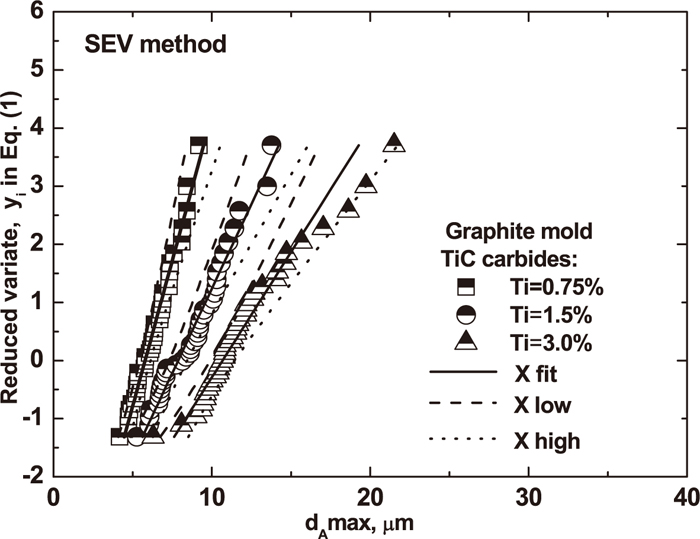
For all the samples of a Fe-17 mass% Cr-4 mass% C hypereutectic HCCI alloyed with titanium, the investigation unit area for TiC carbides is 0.017 mm2. This corresponds to a photograph when using a ×400 magnification. All the experimental conditions for estimated maximum TiC carbide size are summarized in Table 3. Moreover, the slope value of regression lines, the observed maximum size and the predicted maximum size for TiC carbides are shown in Table 4.
Table 3. Experiment conditions of SEV method for TiC carbides.
| Exp. No. | Ti
(mass%) | Mold | Cooling Rate
(°C/min) | Mean d0
(μm) | STDEV | Image No. | Pixel
(μm) | Magnification | Per unit area
(mm2) |
|---|
| 3 | 0.75 | Graphite | 80 | 6.35 | 1.17 | 40 | 0.124 | ×400 | 0.017 |
| 4 | 1.5 | 8.84 | 2.01 |
| 5 | 3.0 | 12.01 | 3.09 |
Table 4. Regression line equations, observed value and predicted value for TiC carbides.
| Exp. No. | Regression line: y=c1x+c2 | Predicted dAmax (μm) | SE*
(μm) | Observed dAmax (μm) |
|---|
| C1 | C2 |
|---|
| 3 | 1.00 | 5.80 | 12.68 | 0.92 | 9.183 |
| 4 | 0.58 | 4.58 | 19.75 | 1.58 | 13.764 |
| 5 | 0.43 | 4.60 | 26.71 | 2.13 | 21.510 |
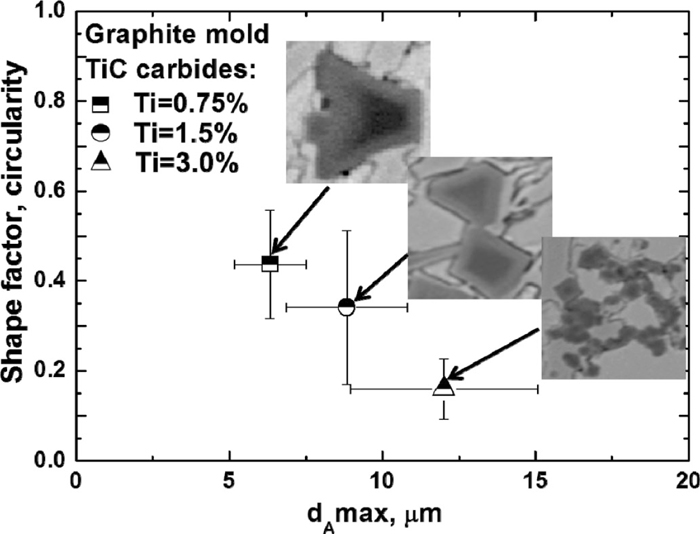
Figure 8 gives an extreme value distribution (EVD) for experiments using the graphite mold and different titanium contents. It confirms that a linear relationship holds between the size of the maximum TiC carbide and the reduced variate. Moreover, it was found that the tendency plots for a 3.0% titanium condition was suddenly changed in the region of a reduced variate value of yi >2.5 and for a dAmax value >15 μm, as shown in Fig. 8. It was believed that is due to the different shapes and sizes of TiC carbides. It can be seen in Fig. 9 that the circularity value of TiC carbides decrease from 0.45 to 0.16 as the titanium content is increased from 0.75% to 3.0%. In addition, the difference circularity value of TiC carbides is due to the shape change of TiC carbides. Fig. 9 also shows that the typical single TiC carbides have a cubic shape, which circularity value is about 0.45 for the case with a 0.75% titanium addition. However, the single TiC carbides seem to be adhered to each other and start to form cluster for the experiments with a 1.5% titanium addition. The circularity value is around 0.36. Furthermore, many TiC carbides aggregate with each other and form big cluster for the experiments with an addition of 3.0% titanium. Then, the circularity value is reduced to 0.16.
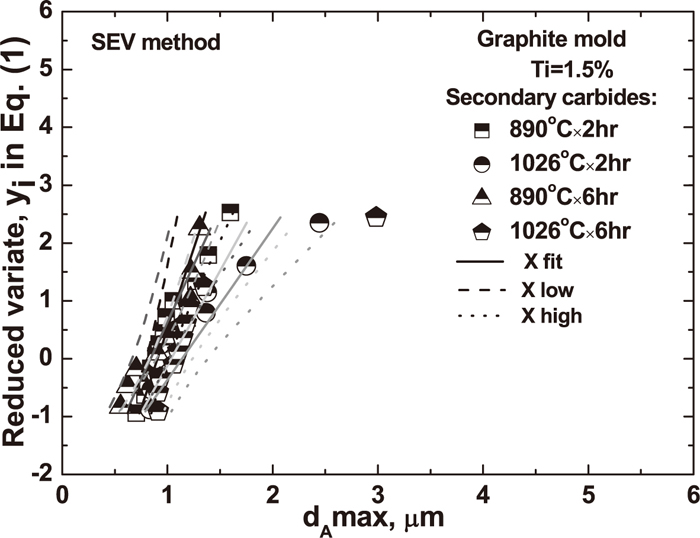
The type of secondary carbides in Fe-17 mass% Cr-4 mass% C hypereutectic HCCI, which precipitate during the heat treatment process, were identified as a M7C3 type based on the results of our previous study.15) The experimental conditions of SEV for secondary M7C3 carbides were shown in Table 5. In addition, the slope value of regression lines, the observed maximum size and predicted maximum size for secondary M7C3 carbides are shown in Table 6.
Table 5. Experiment conditions of SEV method for secondary M
7C
3 carbides.
| Exp. | Ti
(mass%) | Mold | Mean d0
(μm) | STDEV | Image No. | Pixel
(μm) | Magnification | Per unit area
(μm2) |
|---|
| 890°C×2 hr | 1.5 | Graphite | 1.02 | 0.27 | 40 | 0.0190 | ×5000 | 420.3 |
| 1026°C×2 hr | 1.24 | 0.52 |
| 890°C×6 hr | 0.97 | 0.28 | 0.0093 | ×10000 | 107.8 |
| 1026°C×6 hr | 1.43 | 0.76 |
Table 6. Regression line equations, observed value and predicted value for secondary M
7C
3 carbides.
| Exp. | Regression line: y=c1x+c2 | Predicted dAmax (μm) | SE*
(μm) | Observed dAmax(μm) |
|---|
| C1 | C2 |
|---|
| 890°C×2 hr | 5.5 | 4.98 | 2.16 | 0.17 | 1.60 |
| 1026°C×2 hr | 3.27 | 3.38 | 3.15 | 0.28 | 2.44 |
| 890°C×6 hr | 3.96 | 3.29 | 2.58 | 0.23 | 1.30 |
| 1026°C×6 hr | 2.61 | 2.97 | 3.79 | 0.35 | 2.98 |
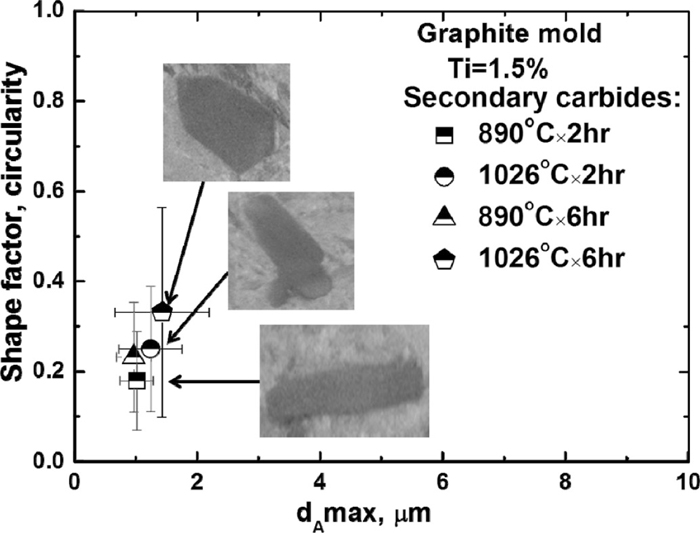
Figure 10 shows the extreme value distribution (EVD) for different heat treatment conditions. It confirm that a linear relationship holds between the size of the maximum secondary M7C3 carbide and the reduce variate. In general, it was found that the slope of the EVD regression lines is not changed by changing the heat treatment conditions, as shown in Fig. 10. However, in the region of a reduced variate value yi>1.5 and for a dAmax>2 μm, it was found that the tendency plots were a little bit changed for the 1026°C×2 hr/6 hr conditions. In addition, the shape of the secondary M7C3 carbide is rod-like and irregular and the mean circularity value is in range of 0.17–0.35, as shown in Fig. 11.
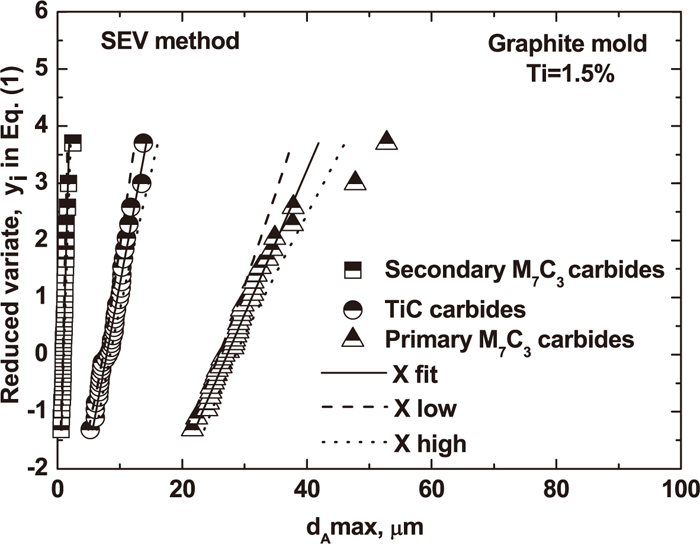
A summary of the extreme value distribution (EVD) among primary M7C3 carbides, TiC carbides and secondary M7C3 carbides for a case with a 1.5% titanium addition and casting in a graphite mold is shown in Fig. 12. The slope of the regression line for these three carbide types is different. The reasons for this discrepancy in the EVD value depend on their characteristic, such as the shape factor. It was found that the typical morphology of primary M7C3 carbides, TiC carbides and secondary M7C3 carbides is of a hexagonal shape, a cubic shape and an irregular shape, respectively. Moreover, the corresponding circularity value for three carbide types is quite different. Compared to the circularity value of TiC carbides and secondary M7C3 carbides, the circularity value of primary M7C3 carbides is larger (about 0.43) than the one for TiC carbides and secondary M7C3 carbides.
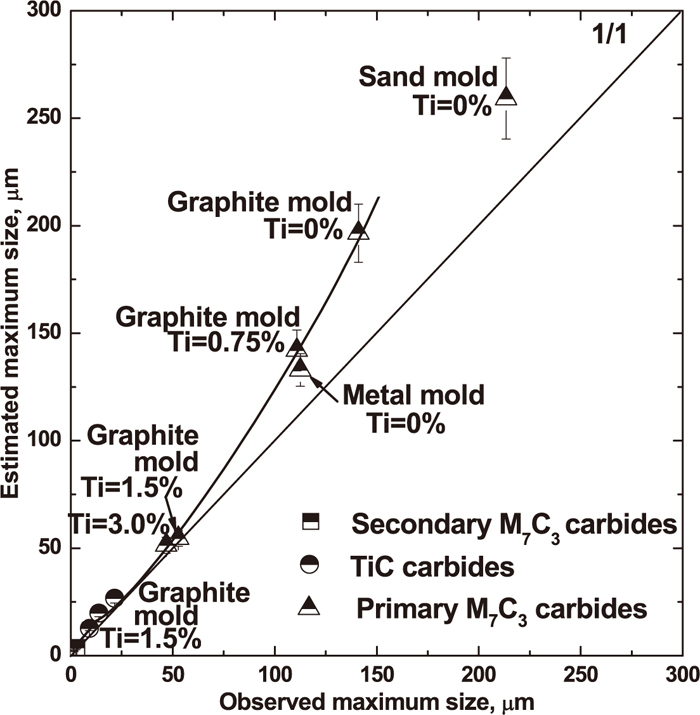
A comparison of the estimated and observed maximum size of primary M7C3 carbides, TiC carbides and secondary M7C3 carbides for the different experimental conditions is shown in Fig. 13. It can be seen that the estimated maximum size of primary M7C3 carbides are larger than the observed ones. This is especially true for the larger primary M7C3 carbides, such as in the sand and graphite mold experiments without titanium additions. Moreover, the estimated maximum size shows a large error bar (18.9 μm in sand mold), which represents a standard error in Eq. (6). However, the smaller carbides, such as primary M7C3 carbides in the graphite mold with 1.5% and 3.0% Ti additions, TiC carbides and secondary M7C3 carbides show a smaller error. The errors are 0.92 μm–2.13 μm for TiC carbides and 0.17 μm–0.5 μm for the secondary carbide, respectively. The predicted smaller carbides with small errors result in agree well with the observed one, as shown in Fig. 13.
5. Discussion
5.1. The Combination of Size Distribution Analysis and Maximum Size Analysis
The effect of size distribution of carbides on the mechanical properties of Fe-17 mass% Cr-4 mass% C hypereutectic HCCI, such as wear resistance and hardness, was described in our previous study.11,15) In some case, not only the average carbides size and number density, but also the maximum carbides size have a detrimental influence on the mechanical properties of hypereutectic HCCI. However, we cannot obtain enough real maximum carbides size information from limited experimental results of carbides size distribution even if a size distribution analysis is quite useful. This is due to the limitation of the observed and analyzed areas. As shown in Fig. 14, it can be seen that the observed maximum size value of the different carbide types is low in the size distribution results. This data is obtained based on 5 images studied using a ×10 magnification for primary M7C3 carbide, ×600 magnification for TiC carbide and ×10000 magnification for secondary M7C3 carbide, respectively.11,16) This procedure leads to a lack of a real maximum size information. In this case, the predicted maximum carbides size by using the SEV method, which was estimated based on 40 images by using a ×5 magnification for primary M7C3 carbide, ×400 magnification for TiC carbide and ×5000 and ×10000 magnification for secondary M7C3 carbide, is useful to make size distribution results more complete. This is due to that it quite close to the real maximum carbide sizes. Then, based on a combination of a size distribution analysis and a maximum size analysis, the relationship between the size distribution including the maximum carbides size and the mechanical properties can be discussed.
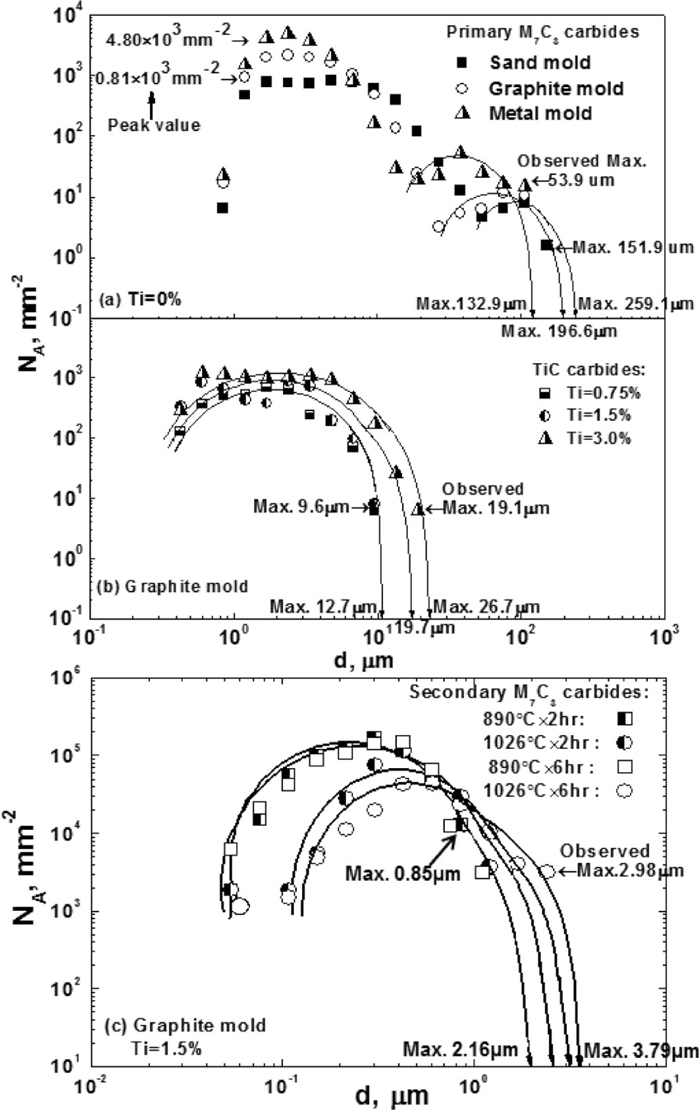
First, in the as-cast condition, the predicted maximum primary M7C3 carbide is 259.1 μm in a sand mold. This value is larger than the one for the graphite mold and metal mold, which is 196.6 μm and 132.9 μm, respectively. As a result, the hardness of hypereutectic HCCI in an as-cast condition decreased with an increased primary M7C3 carbide size, as shown in Fig. 15. Moreover, compared to 0%–1.5% titanium additions, it was found that the predicted maximum TiC carbide, which was found for a 3.0% titanium addition, is 26.7 μm. Compared to 0%–1.5% titanium addition, it is worse to improve the wear resistance of hypereutectic HCCI in as-cast conditions, as shown in Fig. 15. The reason might be that the agglomerated TiC carbides are easily peeled off during the wear application.
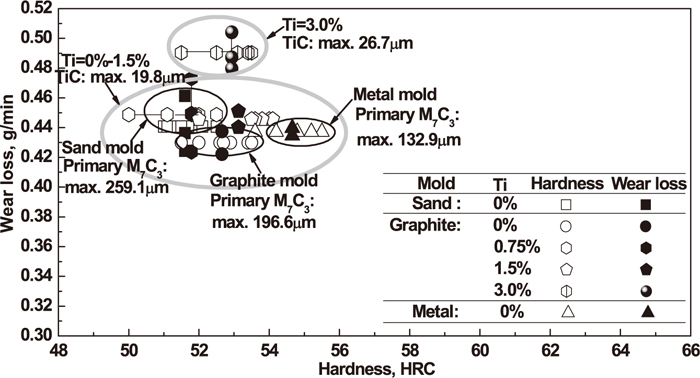
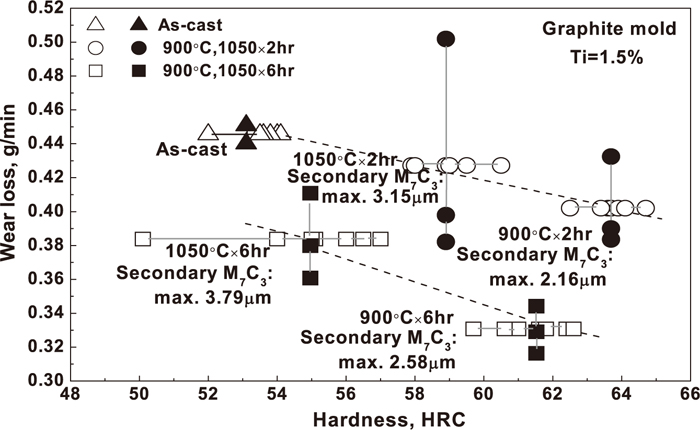
As discussed in our previous study,15) the wear resistance property of hypereutectic HCCI is mainly affected by martensite units after heat treatment. However, the secondary M7C3 carbide, which precipitated from the matrix during the heat treatment process, might also have an influence on the mechanical properties of a hypereutectic HCCI.16) This is particularly true for the hardness of hypereutectic HCCI. As shown in Fig. 16, it was found that the hardness decreased with an increased size of the secondary M7C3 carbide as the heat treatment conditions changed from 900°C×2 hr/6 hr to 1050°C×2 hr/6 hr.
6. Conclusions
In order to get more exactly size distribution results to fully explain the relationship between size distribution and mechanical properties, the maximum carbide size, such as primary M7C3 carbides, TiC carbides and secondary M7C3 carbides in Fe-17 mass% Cr-4 mass% C hypereutectic HCCI alloyed with titanium, was studied by using SEV methods. Moreover, the combined method between a size distribution analysis and a maximum analysis is proposed in this investigation. The following conclusions are obtained:
(1) The shape factor (circularity value) of maximum primary M7C3 carbides, TiC carbides and secondary M7C3 carbides was found to be different. It leads to different slope of the extreme value distribution (EVD) regression lines for these carbides. The large sized carbides such as primary M7C3 carbides have a lower slope than the smaller carbides such as TiC carbides and secondary M7C3 carbides.
(2) A more accurate carbides size distribution result was obtained by supplementing the maximum carbides size information to normal size distribution.
(3) The combination of a size distribution analysis and a maximum analysis results showed that the primary M7C3 carbides and secondary M7C3 carbides in as-cast condition and heat treatment condition are related to the hardness of hypereutectic HCCI. More specifically, it will decrease with an increased maximum size of primary M7C3 carbides and secondary M7C3 carbides.
(4) The maximum TiC carbide sizes for experiments with 3.0% titanium addition were found to be related to the wear resistance property of hypereutectic HCCI in the as-cast conditions. Compared to 0%–1.5% titanium additions, the wear resistance property of hypereutectic HCCI for 3.0% titanium addition will become worse due to increasing the size of TiC carbides.
Acknowledgements
The authors are grateful to assistant Professor Junichi Takahashi (Tohoku University, Japan) for helpful discussion. Qiang Liu acknowledges the China Scholarship Council for financial support of his research.
References
- 1) Y. Murakami: J. Res. Inst. Stand. Technol., 99 (1994), 345.
- 2) Y. Murakami: Trans. Jpn. Soc. Mech. Eng., 56 (1990), 162.
- 3) Y. Murakami, T. Toriyama and E. M. Coudert: J. Test. Eval., 22 (1994), 318.
- 4) T. Toriyama, Y. Murakami, T. Yamashita, K, Tsubota and K. Furumura: Tetsu-to-Hagané, 81(1995), 77.
- 5) J. Takahashi: ISIJ Int., 49 (2009), 1030.
- 6) G. Shi, H. V. Atkinson, C. M. Sellars and C. W. Anderson: Acta Mater., 47 (1999), 1455.
- 7) G. Shi, H. V. Atkinson, C. M. Sellars and C. W. Anderson: Ironmaking Steelmaking, 26 (1999), 239.
- 8) H. V. Atkinson, G. Shi, C. M. Sellars and C. W. Anderson: Mater. Sci. Technol., 16 (2000), 1175.
- 9) H. V. Atkinson and G. Shi: Prog. Mater. Sci., 48 (2003) 457.
- 10) E. J. Gumbel: Statistics of Extreme. Columbia University Press, New York, (1958).
- 11) Q. Liu, H. W. Zhang, Q. Wang, X. K. Zhou, P. G. Jönsson and K. Nakajima: ISIJ Int., 52 (2012), 2210.
- 12) Y. Murakami: Metal Fatigue: Effects of Small Defects and Nonmetallic Inclusions, Yokendo, Tokyo, Japan, (1993).
- 13) ASTM E2283-03, American Society for Testing and Materials, West Conshohocken, PA, (2003).
- 14) M. Tsuda: Tetsu-to-Hagané, 80 (1994), 74.
- 15) Q. Liu, H. W. Zhang, Q. Wang, X. K. Zhou, P. G. Jönsson and K. Nakajima: ISIJ Int., 52 (2012), 2288.
- 16) Q. Liu, H. Shibata, P. Hedström, P. G. Jönsson and K. Nakajima: ISIJ Int., 53 (2013), 1239.