Abstract
Failure criteria based on ductility associated with triaxiality are often used to define the strength of metal alloys as a function of the load modalities. However a discussion of the results with regards to the microstructural evolution and the behavior of the different phases is still not investigated, especially in multi-phase alloys. In this paper a ductile failure criterion was calibrated on α/β titanium alloy (Ti–6Al–4V). The applied approach is based on different experimental tests supported by numerical analyses carried out by detailed FE models. Specimens were tested on a multiaxial test system to investigate the failure induced by different states of stress triaxiality. Results have been discussed with regards to the textures induced in the lattice of the α-phase and β-phase, which are a direct consequence of the rotations associated with the dissipative plastic strains. Schmid factors at failure have been also calculated to determine which slip system have been activated by the different load modalities. The proposed approach could be also extended to steel.
1. Introduction
Modern structural design requires an ever increasing awareness of the material behavior to augment the structural capability of the components thereby improving both performance and safety in extreme conditions.
Titanium alloys are a valuable option for highly stressed and low weight components especially in highly demanding fields like aerospace industries.1) The use of titanium alloys is justified because of their high mechanical properties (both in static and fatigue conditions) and their low volumic mass. Specifically, the Ti–6Al–4V alloy is the “workhorse” of the titanium industry accounting for more than 50% of the total titanium usage; Ti–6Al–4V, grade 5, is an α + β alloy, containing approximately 6% aluminum and 4% vanadium.
Several factors and conditions drive the mechanism of failure in ductile materials: stress triaxiality (η, the ratio between hydrostatic stress component, σh, and the deviatoric one, σvm) is one of the most important factors. Starting from the fracture calibration of Ti–6Al–4V carried out using the Bao-Wierzbicki framework (B-W),2,3,4) this work presents an explanation based on the crystallographic textures of the failure mode at different states of stress triaxiality.
The B-W criterion2) belongs to a ductile failure model based on a phenomenological approach. It has been chosen by the authors due to the fact that it allows an accurate description of the failure onset at different stress triaxiality. Moreover, it is already indirectly implemented in most common finite element codes and has a good geometry transferability features.3,4) In general terms, in a cumulative damage criterion like B-W, damage is expressed by the parameter ωD, as shown in Eq. (1)
|
ω
D
(
ε
p
¯
)
=
∫
0
ε
p
¯
d
ε
p
ε
f
(
σ
h
σ
vm
,
ε
˙
p
,T
)
| (1) |
where
εp is the plastic strain and
εf is the strain at failure, as a function of the absolute temperature
T, the plastic strain rate
ε
˙
p
and the triaxiality
η=
σ
h
σ
vm
. The influence of
T and
ε
˙
p
haven’t been taken into account in the present calibration: accumulated plastic strain is therefore modified by
εf that depends, in this case, only on triaxiality. This curve, strain at failure vs. triaxiality, is called fracture locus. The fracture locus therefore has to be calibrated on the specific material mechanical behavior and is the core of such a phenomenological ductile failure criterion. Damage grows as a function of the accumulated plastic strain according to
Eq. (1) but it is not coupled with the constitutive behavior: an element (inside a Finite Element Analysis) is damaged (erased) when the accumulated plastic strain (modified by fracture locus),
ωD, reaches the unity (value = 1); this condition is the onset of damage.
The calibration procedure, described in detail in3) is based on different experimental tests supported by numerical simulations performed by means of detailed Finite Element (FE) models. Specimens were tested on a multiaxial test system to investigate the failure induced by different states of stress triaxiality. Therefore a dedicated FE model for each tested specimen was built up using ABAQUS/Explicit to numerically reproduce the experimental quasi-static tests.
The constitutive relation of Johnson and Cook (JC) has been chosen to represent the material’s plastic behaviour in the numerical model. This is expressed by Eq. (2) (only strain hardening was taken in account).
Parameters are A = 925 MPa, B = 930 MPa and n = 0.76 have been calibrated.3) For the elastic behaviour, a Young’s modulus of E = 111131 MPa and a Poisson’s ratio ν = 0.31 have been also obtained.3) Numerical simulations can provide a detailed stress-strain history to be used in the calibration process. Once the true stress-strain material curve has been obtained, it is possible to model, always by means of numerical simulations, the histories of the stress, triaxiality and the plastic strain up to the failure condition, thus allowing the calibration of the curve of the failure strain vs. stress triaxiality (fracture locus) over the entire stress triaxiality range (covered by experimental tests).
B-W have investigated the influence of stress triaxiality in fracture ductility2) and have identified three regions. Below a triaxiality value of –1/3 ductile failure doesn’t occur:5) for negative triaxialities (from the cut-off triaxiality value, η = –1/3, to 0) failure is governed by shear mode; for large triaxiality (from a transition point ηT at about 0.4/0.5) void nucleation, growth and linkage dominates, whereas for intermediate stress triaxiality (between 0 and ηT) a combination of shear and void growth causes the fracture (mixed-shear fracture). In this work SEM-EBSD analysis of the material has been performed to investigate the failure at crystal level induced by different states of stress triaxiality on the basis of the crystallographic textures. Samples were obtained from the fracture surface of the specimens tested in different modalities to identify the activation of the slip systems interested by plastic deformation as a function of the applied loading modalities (stress triaxialities). Investigations presented in this work are mainly centered in intermediate stress triaxiality zone. The most critical loading modalities (in terms of strain at failure) have been recognized by Viganò et al.3) to be the plane stress condition imposed by torsional loading (null stress triaxiality). The reason for the high severity of the plane stress loading modality is therefore discussed in the present work with regards to the microstructural examination.
When plastic deformation occurs in a ductile material, different slip systems can be activated. The lattice systems (i.e. a slip system is composed by a plane and by a direction) activated by plastic deformation process are featured by specific orientation of their slip direction as a function of loading direction, as defined in Schmid theory.6,7,8) The projection of a stress state on a slip system is defined as resolved shear stress (τ), as shown in Eq. (3). The plastic deformation takes place on a slip system when the resolved shear stress reaches the critical resolved shear stress value (τc):
|
τ=
s
i
⋅
σ
ij
⋅
m
j
≥
τ
c
| (3) |
where
si are the geometrical components of the direction of the activated slip system referred to the external fixed reference system;
mj are the geometrical component of the normal to the slip plane referred to the external fixed reference system and
σij is the generic component of the stress tensor. It is important to note that
m and
s remain always orthogonal to each other during the plastic deformation.
During the deformation the material undergoes hardening that can be expressed as reported in Eqs. (4) and (5):
|
dτ=
s
i
⋅d
σ
ij
⋅
m
j
+d
s
i
⋅
σ
ij
⋅
m
j
+
s
i
⋅
σ
ij
⋅d
m
j
| (5) |
where the first term on the right side of
(5) si·
dσij·
mj represents the increment of the resolved shear stress needed to activate the slip system, the second term
dsi·
σij·
mj is related to the change of direction of the slip system and the third one
si·
σij·
dmj represents the plane rotation. The activated systems tend to align along specific directions strictly related to the loading direction and this phenomenon implies the formation of crystallographic textures. The measurements of the textures induced by plastic deformation and the values obtained by the Schmid factor identify the slip systems aligned along the load direction and, therefore establish the slip systems that have been activated.
At present, a recently developed group of more complete but more complex (to calibrate and to implement in numerical software) fracture criteria, has been presented,9,10) to further improve the prediction. However, also for these new criteria the intermediate stress triaxiality zone represents an interesting area to be investigated. In particular torsional loading is a very interesting point due to the fact that plane stress and plastic plane strain (generalized shear) meet.
2. Experimental Procedure
All the specimens were obtained from 75 mm thick Ti–6Al–4V plates along the Longitudinal-Transverse (L-T) orientation, therefore with the specimens’ axis parallel to the main manufacturing direction. The plates were cut-edged by milling operation and then underwent an annealing heat treatment (780°C-2 h-air cooling). This material, treated with the same technological process, is used for aeronautic and aerospace applications, and is characterized by homogeneity, clearness and absence of defects. The chemical composition of the investigated alloy, obtained by XRF analysis, is reported in Table 1.
Table 1. Chemical composition of the studied Ti–6Al–4V alloy (weight %).
| Elements | Ti | Al | V | N | H | Fe | O | C |
|---|
| Wt.% | Bal. | 6.38 | 4.17 | 0.01 | 0.001 | 0.15 | 0.16 | 0.01 |
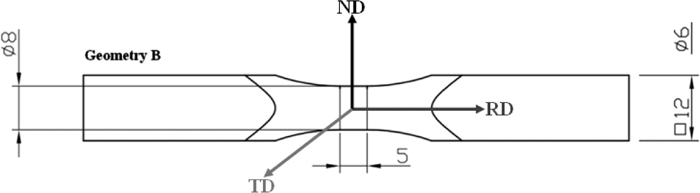
The complete calibration procedure, detailed by Viganò et al.,3) is based on four kinds of specimen geometry in order to investigate the three failure regions involved in the so called fracture locus. Different load conditions have been achieved mainly using a multi-axial test machine. Basically, different stress triaxiality at failure (around null stress triaxiality state, pure torsion) is driven in a limited range by a combination of axial and torque load. Firstly a constant axial force has been applied, then the torsion load has been carried out in rotation control conditions in order to obtain the rotation angle at which failure happen. This approach permits the use, for the purpose of the present investigation, of one common geometry specimen (called B-type geometry,3) as shown in Fig. 1) thus focusing the attention only on the effects of the load modalities, neglecting the effects of the geometrical features. The complete tensile/torque curves versus displacement/rotation were obtained for each specimen and were used for the calibration process.3)
As previously underlined, the calibration of the constitutive law and the fracture locus curve for Ti–6Al–4V identifies a critical condition equivalent to a ductility reduction, associated to shear state caused by the torsion test, when η is approximately equal to zero. In Table 2 the rotation angle at which failure happen, for the tested B-type specimens under EBSD investigation, are reported. In particular three conditions have been analysed in detail:
• pure torsion;
• torsion + tensile (30 kN);
• torsion + compression (–24 kN).
Table 2. Failure torsion angles.
| Test load | Axial Loads
[N] | Failure Angle
[deg] | Average Triaxiality
ηav | Plastic Strain at failure
εf |
|---|
| Compression + Torsion | –24000 | 168.9 | –0.08 | 0.51 |
| Torsion | 0 | 141.5 | 0 | 0.48 |
| Tensile + Torsion | 30000 | 63.3 | 0.1 | 0.46 |
The selected load conditions represent the symmetric situation around the critical triaxiality value, η = 0, associated to pure torsion. Figure 2 shows the B-W calibration curve obtained by Viganò et al.3) for the whole set of data. Three distinct regions in the failure locus are identified: pure shear, mixed and void growth. The pure shear zone considers the cut-off triaxiality value (–1/3). The zone of mixed shear-void growth in which the failure strain increases is located from zero triaxiality to ηT (transition point at about 0.5). When the failure strain reaches the transition point, it decreases monotonically, the third zone. A complete set of equations is proposed by Bao and Wierzbicki11) and the result from the calibration performed3) is hereafter briefly reported (Eq. (6)):
|
ε
f
={
0.164
(
1+3⋅η
)
+0.292
–
1
/
3
<η≤0
1.376⋅
η
2
–0.052⋅η+0.461
0<η≤0.49
0.000+1.853⋅
e
(
–1.890⋅η
)
0.49≤η
| (6) |
This curve data is passed to ABAQUS in tabular form and a cumulative damage is associated to this curve. For each element the increment in plastic equivalent strain, dεpe Eq. (1), is weighed with the strain at failure, εf Eq. (6), and elements are removed when the accumulated plastic strain, ωD, reaches a critical value (equal to 1).
In this framework, damage evolution has not been considered. In this way, when an element reaches the damage critical value, it is immediately removed to simulate the failure crack initiation and propagation. Element removal technique is just a numerical expedient to realize material separation. Thus it is efficient where fracture region is controlled to a sufficient small size with no fragmentation.12) However the use of such criteria able to simulate cases where the stress triaxiality varies spatially and temporally in a narrow range is fundamental for realistic simulations of complex loading cases where 3D simulations are used to predict onset and path of failure.4,13)
B-W model follow a phenomenological approach thus reproduces the phenomena of failure with mathematical relations that link strain at failure with loading conditions. Main aim of this work is to investigate in the physical effect of different loading condition by means of SEM-EBSD investigations. Thus microstructural investigations was performed and presented in this paper on the more critical specimens, corresponding to the region featured by low stress triaxiality value.
Visual examination by means of scanning electron microscopy (SEM) was performed on the fracture surface of the tested and broken B-geometry specimens, in order to demonstrate the link between the microstructure modifications and the stress triaxiality associated to the loading conditions. According to ASM Metal Handbook,12) micrographic analysis was performed by etching specimens for 30 s in Kroll’s solution. Thus, SEM-EBSD analysis was carried out to reveal the crystallographic textures of α and β phases, exploring an area of 4 mm2 through a pixel resolution of 1 μm2, with an accelerating voltage of 20 kV and a Δφ2 = 10° step size chosen for each ODF map. All of the tests were performed on the fracture surface (ND-TD plane, Fig. 1) of tested and broken B-geometry specimens, perpendicular to the specimen axis, grinded and polished with silica suspension (0.2 μm), removing a material layer of about 0.1 mm. Traces of strong plastic deformation are present in the observed region and these traces are strictly related and representative of the plastic pattern interesting of the failed surface just before fracture occurred (Fig. 3). For each experimental condition, three trials were performed for each analysed surface in order to obtain a complete scenario of the evolution of textures. For each specimen, both the fracture surfaces were analysed and two EBSD were taken from the more external radius, while one was performed on the mean radius.
On the basis of textures revealed by the EBSD measurements for each investigated experimental condition and for the principal slip system present in a hcp crystal, Schmid factors maps were defined. To account for the triaxiality of the studied load modality and to define the direction of the load application, a resultant direction weighed on the basis of principle stresses was defined, starting from the FE simulations. The Schmid factor values obtained after calculation are representative of the activated slip systems at the specimens fracture.
3. Results and Discussion
3.1. Fracture Surface Analysis
The data presented and discussed by Viganò et al.,3) and here reported respectively in Fig. 2 and Table 2, point out an increase of the torsion failure angle (i.e. failure strain εf) associated to an increase of the compressive axial force applied during the test. On the contrary, in tensile-torsion conditions the trend shows an increase of the ultimate failure strain as the applied tensile force increases, as evident in Fig 2. However, the loading condition in proximity of the pure torsion state shows a local minimum of ductility (lower plastic strain undergone by specimens at failure); Eq. (6) and Bao-Wierzibicki model2) can describe the observed behaviour from a phenomenological point of view but a discussion of these results based on the microstructural evolution and the behavior of the different phases still needs more investigations.
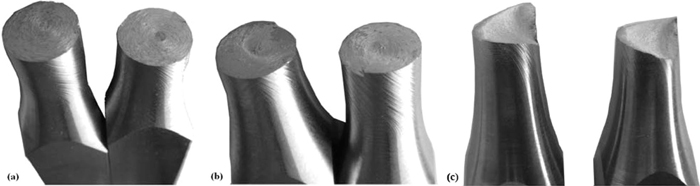
The failure surfaces obtained at the investigated load conditions exhibit different features as a function of the applied loading modalities, as evident in Fig. 3. The specimens tested under pure torsion and torsion-compression maintains a circular flat geometry of the failure surface after the tests. Specimens tested by torsion-tensile modality exhibit slightly necking, due to the effect of the constant axial load applied during the mechanical test.
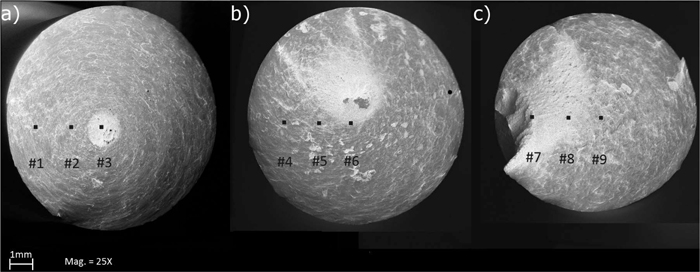
SEM analysis performed on the fracture surfaces, shown in Fig. 4, points out the typical mixed-shear morphology. Particularly, for pure torsion, Figs. 5(1) and 5(2), and torsion-compression cases, Figs. 5(4) and 5(5), the surface remains planar and the area deformed by shear stresses and stretched along the applied torque verse can be observed. The fracture seems to initiate on the external surface and then it extends to the center of the specimen, which is the last region to fail, as clearly visible in Figs. 5(3) and 5(6). The morphology in this last zone is characterized by the typical aspect of ductile material, featured by the presence of dimples. In the tensile-torsion load modality the surface is quite different from the previous two. In particular the last failed section shows pronounced axial deformation due to the constant axial force maintained during the test, as reported in Fig. 5(7). The transition point between pure shear fracture, Fig. 5(9), and mixed-shear one, Fig. 5(8), is evident.
Micrographic analysis performed in untested specimen (thus with undeformed pattern) pointed out the typical biphasic microstructure featuring the examined grade of titanium alloy,14) as demonstrated by Fig. 6(a). Through the use of a software image analyzer the α-phase/β-phase ratio has been determined. The ratio assumes an average value of 70.8% of α-phase on 29.2% β-phase. Microstructures were also captured observing the normal section of samples in the fracture region (in the ND-TD plane, perpendicular to the specimen axis) to identify a possible variation of the morphological features of the grains that could result from torque application. The grains in all the three different conditions examined do not show particular heterogeneity or clear variation of their morphological features. Respectively, Fig. 6(b) shows the microstructure of pure torsion tested samples, Fig. 6(c) is related to traction-torsion load modality and Fig. 6(d) is the compression-torsion sample.
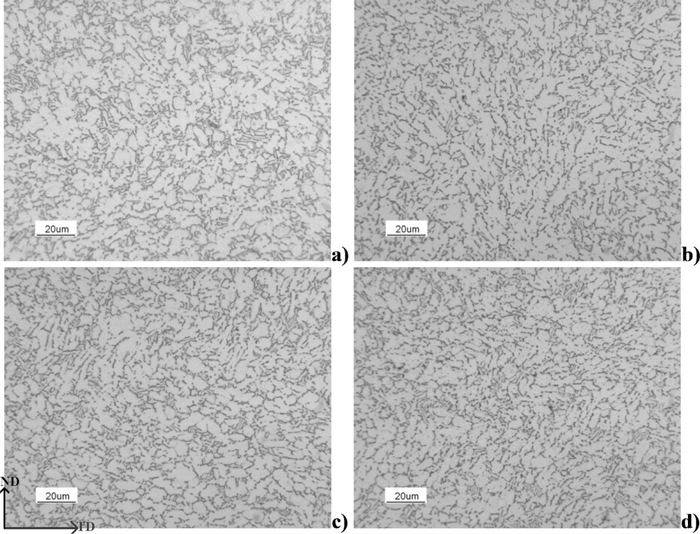
Thus a comparison between the gripping zone and the fracture regions shows no difference.
Moreover, the overall microstructure appears to be homogenous, without non-metallic inclusions or inner defects that can affect the material integrity and properties.
The microstructure analyzed along the RD directions (parallel to the specimen axis) shows homogeneous shape and size of the grains with only a slight elongation along the rolling direction, as visible in Fig. 7. Moreover, due to the annealing process, the recrystallized grains are featured by relatively random orientation in which only weak traces of residual textures induced by former plastic deformation processes remain present, as can observed in Fig. 8. Thus, the machined samples in different sections of the starting plate are featured by a similar microstructure and they are not affected by microstructural differences that can compromise the comparison among specimens tested by different loading modalities.

Due to the very homogeneous and similar metallographic microstructures of all the specimens that have undergone the different loading conditions, the main reasons ruling the material behaviour during the different stress triaxiality conditions have to be found in the transformations that take place at a crystal level. According to the plastic deformation theory crystal slip and crystal rotation represent the mechanisms that can dissipate the plastic energy introduced by the application of a mechanical load, increasing the attitude of a material to deform plastically before the fracture point is reached. EBSD analysis gives an indication of the activated slip system and could explain the deformation phenomena that occurred in the alloy.
3.3. EBSD Texture Analysis
The use of the observation of crystallographic textures for studying the plastic deformation process is based on the simple and always valid principle that rotation of crystal lattice has always to take place when a plastic strain occurs. Thus, the study of the variation of the crystal lattice allows to understand the phases interested by the plastic deformation and the sliding systems activated in those phases.
The most significant decrease of ductility has been pointed out in pure torsion3) and the reason of this behaviour has been investigated by means of crystallographic measurements. In the studied conditions, the bcc-phase (body cubic centered cell, known also as β-phase) of the investigated titanium alloy has been always interested by significant plastic deformation in all the three analyzed load modalities (torsion, tensile-torsion and compression-torsion). This has been demonstrated by the change of textures involving this phase: the orientation measurements point out a significant intensification of β-fibers (including the development of a sharp S-component) and a clear induction of Goss component, as clearly represented by Fig. 8. These textures were not present in the undeformed specimen taken as reference,15) so they are produced by the imposed plastic deformation.
The intensity of the textures induced by plastic deformation is less pronounced for the specimen that underwent the torsion load, but the intensification of the texture components associated to β-fiber and Goss component are also present and this is a cue that even under pure torsional load the bcc-phase has taken part to the plastic deformation. The load modality featured by compression-torsion shows the most intense development of texture components induced in the bcc-phase and even traces of α-fiber can be recognized and this is not present for the other load modalities. Thus, in all the load conditions the bcc-phase is involved significantly in the plastic deformation and so that phase takes part certainly to the dissipation of the applied mechanical work.
The textures evolution on β-phase, pointed out by EBSD analysis, follows the typical sequence described in literature16) for bcc structures: the load modalities causing low plastic deformation (pure torsion) are mainly featured by very intense Goss, whereas the load modalities causing important plastic deformation intensify the α-fiber and induce a very evident β-fiber, especially around the S-texture component, as confirmed by the material behavior during tensile-torsion as well as during compression-torsion. The β-fiber is not present in phenomenon characterized by low plastic deformation.
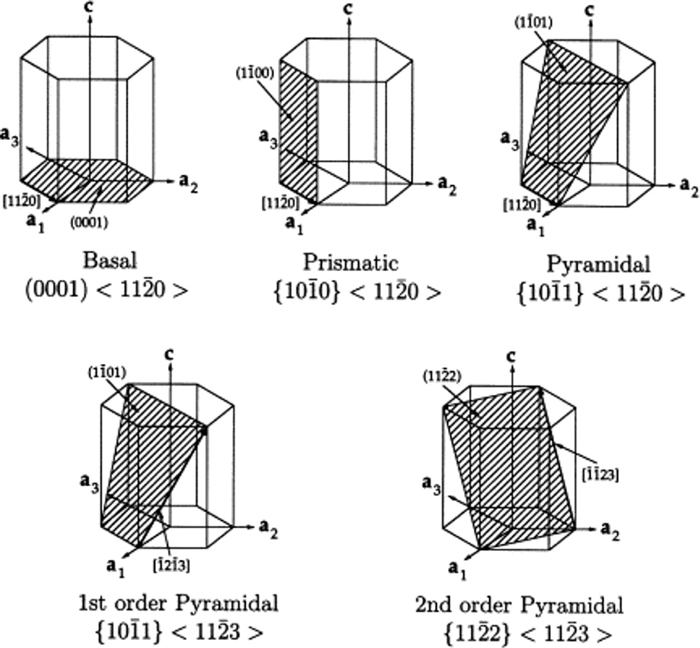
Instead, the situation of the textures induced by in the hcp-phase (hexagonal compact cell, known also as α-phase) of the studied titanium alloy seems to point out a texture situation featured by more significant differences as a function of the applied load modalities. The inverse polar diagrams reported in Fig. 8 for the α-phase show a rotation of its hexagonal compact cells during the plastic deformation in all of the tested load modalities. On the other hand, the revealed textures intensity in tensile-torsion modality point out a significant involvement of basal and pyramidal systems of the hexagonal compact cell during the process of plastic deformation. Figure 9 outline the principals slip systems in a hcp crystal cell. This is confirmed by the sharpest peaks of texture around the [1010] direction in the inverse polar figure, reported in Fig. 8. An analogous situation is revealed after the application of compression-torsion load modality, while in the pure torsion case the hcp-phase seems to be not involved in the plastic deformation process as proved by the absence of evolution in the revealed texture components.
More precisely, during torsion-axial loading the hexagonal cells tend to align in the <0001> and <1010> directions of the cells along the direction of application of the axial load. The polar figure points out that the {1010} plane tends to concentrate at 90° and 45° from the axial loading axis. This phenomenon indicates clearly that in this loading condition the hexagonal compact cells rotate and participate in the deformation process and so the α-phase contribution to the dissipation of the applied work is more pronounced than in the pure torsion condition.
3.4. Schmid Factor Calculation
In order to understand the reliability of the thesis stressed about the activations of particular deformation system in hcp-phase the Schmid factor calculation17) has been performed following the observation of the obtained EBSD maps on a population of 300 α-phase nodules and the corresponding resultant directions of the applied stress field. The textures revealed by EBSD allows to identify which phenomena has occurred at the crystal level of the alloy. A quantitative analysis through the Schmid factor calculation is needed to confirm and validate the EBSD results. In this analysis only the Schmid factors associated to α-phase are taken into account because the plastic strain of β-phase has been always activated. Thus, the discriminant aspect on the ductility can be strongly associated to the phenomenon interesting the plastic deformation of α-phase. For this phase the analysis of Schmid factor has to be carefully studied in order to associate the texture evolution induced in this phase and the undergone strains.
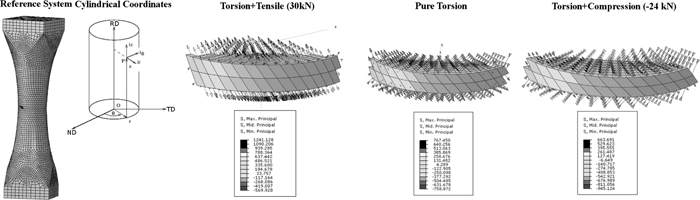
To reveal the load application direction, exploiting the FE models adopted to calibrate the material constitutive laws,3) stress data from the most deformed elements has been obtained and the direction of the principal stresses and modules have been reported in Fig. 10. To extend the analysis from an FE model to real samples, a cylindrical coordinate reference system has been selected; thereby, due to symmetrical conditions of the numerical analysis, every finite element is featured by the identical directions of the principal stresses. The reference system used in the FE model corresponds locally to the one selected for the metallurgical and crystallographic investigation and indicated in Fig. 1. The direction cosines have been extrapolated on the basis of the positions assumed by the most deformed element and used to identify the angles of rotation among the principal stresses and the rolling direction. The resultant force and its direction have been used to calculate the Schmid factors in each condition and for the different crystal orientations.18) On the basis of the orientation of each crystal grain aligned along the rolling direction (from EBSD analysis), it is possible to quantify the slip systems that are activated by the applied force at the failure.
The Schmid factor distribution maps have been calculated for the different load modalities and for the principal slip system of an hcp-cell: basal, prismatic and second order pyramidal. The comparison between the Schmid factor and the inverse polar figures, reported in Fig. 11, allows the identification of the activated slip systems at the failure (Schmid factor higher value) on the basis of the alignment along the RD direction.18)
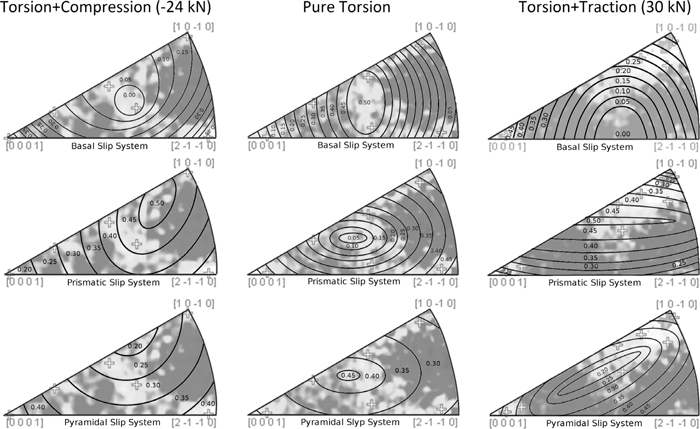
The analysis performed by the computation of the Schmid factor confirms the former statement obtained from EBSD tests and it shows that in tensile-torsion load modality the directions aligned along RD correspond to the activation of the basal and pyramidal slip system (Schmid factor value 0.45). On the contrary, in pure torsion load modality the basal and prismatic slip systems are more activated than the pyramidal ones. Thus, the performed analysis shows the axial load (both for compression and tensile condition) is the cause of the pyramidal slip system activation: in presence of tensile and compression load component this relation is quite evident.
4. Conclusion
Starting from the fracture locus determined in a previous work3) on the calibration of phenomenological ductile failure criterion of a Ti–6Al–4V alloy, the effect of the loading condition (stress triaxiality) on failure has been investigated and the effect of the loading condition on the textures induced in the lattice of the α-phase and β-phase, (a direct consequence of the rotations associated with the dissipative plastic strains) has been evaluated:
(1) the plastic dissipation efficiency associated with the activation of different slip systems is the mechanism ruling the deformation and fracture process, and the possibility to activate a higher number of different types of slip planes gives the material more degrees of freedom, thanks to which the ductile plastic deformation can occur without generating brittle fracture mechanisms;
(2) the EBSD measurements have proven that the state featured by positive stress triaxiality can also allow the activation of α-phase slip systems that cooperate with the body cubic centered ones (typical of β-phase) in the dissipative process. On the contrary, in the case of plane stress modality the activation of the systems belonging to α-phase are not activated;
(3) the definition of the ductile fracture locus states points out that the torsion loading (not combined with other loading components) represents a very critical modality, while the combined tested loading modalities, especially tensile-torsion, are not so detrimental for the material integrity. This situation is explained by the crystallographic analysis results which indicate that the tensile-torsion loading promotes plastic deformation and the associated rotation of hcp elementary cells (belonging to α-phase) by an intense activation of the pyramidal slip systems, while in the other loading cases only basal and prismatic slip systems are activated;
(4) the textures induced within the β-phase (bcc elementary cells) do not point out particular differences as a function of the applied loading modalities and this represents a clear indication that analogous slip systems have been activated in the β-phase in all the applied loading modalities;
(5) Schimd factors calculations contribute to confirm the EBSD analysis results and their definition provides a quantitative comparison parameter. The methodology followed to represent the weighted equivalent direction (an efficient way to simplify the analysis and to take the multiaxial stress state into account) is in good agreement with reality.
The proposed approach could be successfully applied also to analyze steel alloys.
References
- 1) AA. VV.: Materials Properties Handbook, Titanium Alloys, ed. by R. Boyer, G. Welsch, E. W. Colligs, 4th ed., ASM International, Materials Park, OH, (2007).
- 2) Y. Bao and T. Wierzbicki: Int. J. Mech. Sci., 46 (2004), 81.
- 3) F. Viganò, A. Manes and M. Giglio: Int. J. Mech. Sci., 54 (2012), 121.
- 4) F. Viganò, A. Manes and M. Giglio: Fatigue Fract. Eng. M., 35 (2012), No. 4, 317.
- 5) Y. Bao and T. Wierzbicki: Eng. Fract. Mech., 72 (2005), 1049.
- 6) Z. G. Wang: Mechanical Properties of Crystalline Materials, Material Science and Engneering, Vol. 1, UNESCO-EOLSS, Paris, (2002).
- 7) E. Schmid: Plasticity of Crystals, John Wiley and Sons, Hoboken, NJ, (1973).
- 8) W. Gambin: Plasticity and Textures, Springer, Berlin, (2001).
- 9) Y. Bao and T. Wierzbicki: Int. J. Plasticity, 24 (2008), 1071.
- 10) Y. Bao and T. Wierzbicki: Int. J. Fract., 161 (2010), 1.
- 11) T. Wierzbicki, Y. Bao, Y. W. Lee and Y. Bai: Int. J. Mech. Sci., 47 (2005), 719.
- 12) X. Xiao, W. Zhang, G. Wei, Z. Mu and Z. Guo: Mater. Design, 32 (2011), 2663.
- 13) Z. Wu, S. Li, W. Zhang and W. Wang: Mater. Design, 31 (2010), 3661.
- 14) AA. VV.: ASM Metal Handbook, Vol. 9, Metallurgy and Microstructure, ASM International, Materials Park, OH, (2004).
- 15) W. J. Evans, J. P. Jones and M. T. Whittaker: Int. J. Fatigue, 27 (2005), 1244.
- 16) U. F. Kocks, C. N. Tomè and H. R. Wenk: Texture and Anisotropy: Preferred Orientations in Polycrystals and Their Effect on Materials Properties, Cambridge University Press, Cambridge (1998).
- 17) X. L. Nan, H. Y. Wang, L. Zhang, J. B. Li and Q. C. Jiang: Scr. Mater., 67 (2012), 443.
- 18) F. Bridier, P. Villechaise and J. Mendez: Acta Mater., 53 (2005), 555.


