Note
Delaminating Crack Paths in Ultrafine, Elongated Ferritic Steel
キーワード:
ferritic steel,
ultrafine-grained microstructure,
crack path,
electron backscatter diffraction
2013 年 53 巻 12 号 p. 2272-2274
詳細
2013 年 53 巻 12 号 p. 2272-2274
Strong and tough materials are always in demand to reduce weight in transportation and make machinery reliable and safe.1) However, toughness generally decreases with an increase in strength.2,3) Fortunately, grain refinement not only effectively increases strength and toughness simultaneously,4) but also strongly affects the fracture mode.5) Therefore, ultrafine-grained (UFG) materials are increasingly attractive.6,7,8,9,10,11,12) Recently, we have developed stronger and tougher steel by combining grain refinement and delamination to arrest cracks.1,12) The steel has an ultrafine, elongated grain structure, and can arrest the propagation of a crack.
As temperature decreases, conventional ferritic steel gradually becomes brittle and accordingly toughness reduces. On the contrary, the newly developed steel exhibits extraordinary characteristics. Within a certain low temperature range, toughness is extremely high beyond anticipation,12) which should be associated with its specific fracture mode. In the ductile fracture regime (high temperature), a main crack propagates forward without delamination, the same as it does in conventional ferritic steel, while at low temperatures the crack deviates from its original propagation direction by delaminating along the rolling direction. Apparently, the type of crack path is strongly related to the extraordinary toughness feature. However, microscopic understanding of the process is not sufficient; therefore, observing crack paths in detail is necessary and is the purpose of this study.
Three sorts of steel bars (denoted as As-received, AR, and WR), each with a square cross section of 12.9 mm × 12.9 mm and a chemical composition of 0.15C–0.3Si–1.5Mn–Fe balance (in mass%), which has been shown to be useful to avoid the effect of chemical impurities, such as phosphorus or sulfur, on delamination,13,14) were used in this study. The As-received, AR, and WR steel bars consist of equiaxed ferrite/pearlite, elongated ferrite (greater than 1 μm along the short axis)/cementite, and elongated ferrite (less than 1 μm)/cementite, respectively. They were produced from the identical original steel but with different rolling conditions. Briefly, the rolling processes were as follows: ① the As-received steel bar: original steel (austenitizing at 1173 K)→rolling at 1173 K→air cooling; ② the AR steel bar: original steel→air cooling to room temperature→rolling at 773 K→water quenching; ③ the WR steel bar: original steel→water quenching→rolling at 773 K→water quenching. The rolling processes were described in detail elsewhere.13)
The defined principle axes of the rolled bars and the dimensions of the three-point bend specimen are illustrated in Fig. 1(a). The axis corresponding to the rolling direction is defined as the RD, the one corresponding to the main working force direction at the final pass is defined as the ND, and the one that is normal to the RD and ND is defined as the TD. Three-point bend specimens of 10 mm × 10 mm × 55 mm with a notch (depth 5 mm and root radius 0.13 mm) were machined from the As-received, AR, and WR steel bars. Their longitudinal direction is parallel to the RD. Three-point-bending tests with a span of 40 mm were performed on those specimens at 77 K (in liquid nitrogen) and at a crosshead speed of 0.01 mm/s. The loading direction (LD) has an angle of 45° symmetrical to the ND and TD, as illustrated in Fig. 1(a). The displacement between the A and B point shown in Fig. 1(a), δ, was measured with a clip gage. To achieve sharp microcracks, the bending tests were interrupted at the onset of pop-in (i.e., microcrack initiation). After sectioning (the plane is perpendicular to the notch tip line) and polishing, the microcracks and the microstructure inside the interrupted specimens were examined by the electron backscatter diffraction (EBSD).
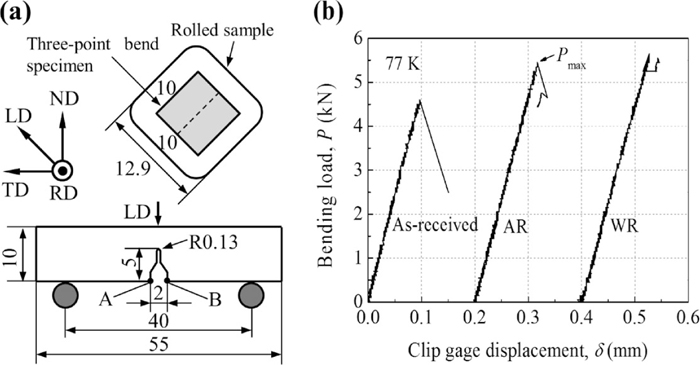
(a) Schematic drawing of the defined principle axes of rolled bars and dimensions of three-point bend specimen and (b) load P versus clip gage displacement δ ranging from the beginning of the test to the onset of pop-in at 77 K.
The load P against the clip gage displacement δ ranging from the beginning of the test to the onset of pop-in for the three types of specimens is shown in Fig. 1(b). The maximum load Pmax corresponds to the crack initiation. The Pmax values of the three samples are notably different. The Pmax of the As-received sample is only 4.5 kN, which is the smallest among the three specimens. Furthermore, the load decreases sharply after the crack initiates, showing unstable crack propagation. A crack in the As-received sample propagates parallel to the LD, as shown in Fig. 2(a). At the same load level (4.5 kN), no crack formed in the AR and WR samples. When the load is increased up to 5.5 kN for the AR sample and 5.7 kN for the WR sample, cracks begin to occur along the RD under the notches (Figs. 2(b) and 2(c)), i.e., delamination takes place. This indicates that the AR and WR steels are less sensitive to the notch than the As-received steel and have superior resistance to cracking.
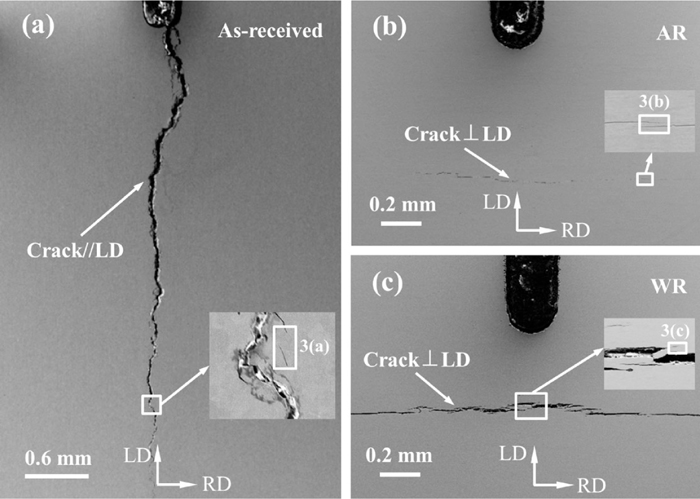
SEM images showing cracks in (a) the As-received specimen, (b) the AR specimen, and (c) the WR specimen after three-point-bending test at 77 K. The insets display enlarged views of the cracks used for EBSD observation in Fig. 3.
The orientation on the RD-LD plane around the cracks was measured by the EBSD, and the orientation maps of the locations marked in Fig. 2 along the RD are shown in Fig. 3. As shown in Fig. 3, the As-received sample consists of large equiaxed grains, but the AR and WR samples are composed of ultrafine, elongated grains. The AR sample has a mixed microstructure of large elongated ferrite grains and small elongated ferrite grains, and the WR sample has a relatively uniform microstructure. Both the grain boundary and microcracks have low image quality (IQ) and appear as grey lines in Fig. 3. It is sometimes difficult to distinguish a microcrack from the grain boundary, especially when the microcrack is extremely sharp. By matching SEM images with the orientation maps, microcracks have been identified and marked in Fig. 3. It can be seen that the microcracks are thicker than the grain boundary.
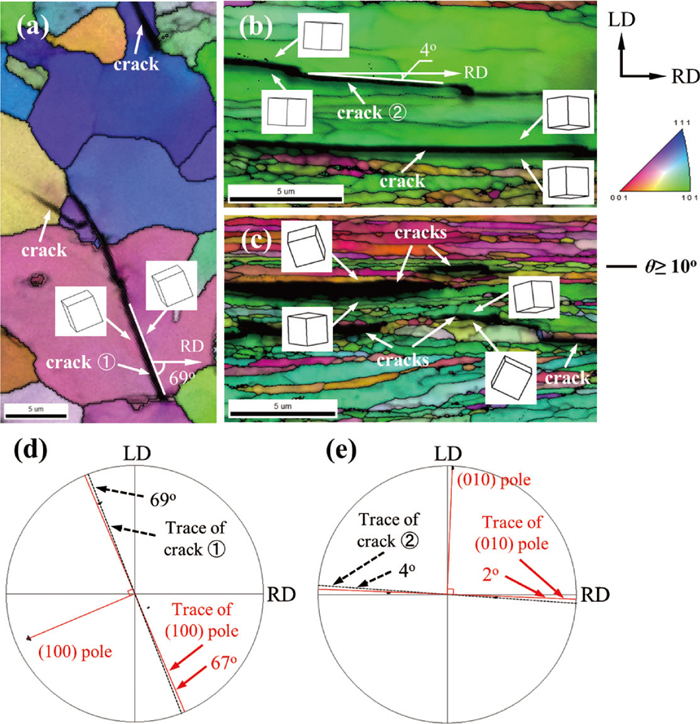
Orientation maps along the RD on the RD-LD plane around the cracks marked in Fig. 2 of (a) the As-received sample, (b) the AR sample, and (c) the WR sample after three-pointbending test. Pole figures of the grains adjacent to (d) crack ① and (e) crack ②.
In an ideal state, a grain’s lattice and orientation remain constant. But when severe plastic deformation imposes on the grain, its orientation will change inside it.15) In the present study, the three-point-bending tests were performed at cryogenic temperature (77 K) and the plastic deformation was extremely small. For this reason, the effect of plastic deformation can be neglected and the samples used are regarded as being in an ideal state. Then, if two adjacent regions have the identical lattice and orientation, the two regions are within the same grain. Based on this assumption, a judgment must be made concerning whether the cracks are on the grain boundary or inside the grain. If the two sides of a crack have different orientations, they must be in different grains; therefore, the crack is definitely on the grain boundary. On the other hand, if the lattice and orientation of both sides of a crack are the same, they are within the same grain, and the crack is transgranular. To intuitively illustrate the lattice and orientation on both sides of the cracks, a 3D lattice is given in Fig. 3. Apparently, the microstructure on both sides of the cracks in the As-received (Fig. 3(a)) and AR samples (Fig. 3(b)) has the identical lattice and orientation, whereas the microstructure in the WR sample (Fig. 3(c)) has a different orientation. Therefore, the cracks in the As-received and AR samples are transgranular, while those in the WR samples are intergranular. A tendency has been shown that the cracks prefer to propagate along a cleavage plane of large ferrite grains as was seen in the As-received and AR samples, whereas the cracks propagate along grain boundaries when the grain size is uniformly small as was observed in the WR sample. It should be noted that more than ten locations were observed besides those marked in Fig. 2, and similar results have been obtained. Further, the deviations of grain orientation on both sides of the cracks in the WR sample have been measured at more than 50 positions, and only two of them have an orientation angle less than 10°, i.e., its fracture is almost always along the high-angle boundaries with an orientation angle equal to or greater than 10°.
Information about the cleavage planes cannot be directly obtained from Figs. 3(a)–3(c), but it can be achieved by the following approach. The pole figures of individual grains adjacent to crack ① (Fig. 3(a)) and crack ② (Fig. 3(b)) are shown in Figs. 3(d) and 3(e), respectively. The angle between trace crack ① and the RD is measured from Fig. 3(a), which is 69°. The trace of (100) plane and crack ① are plotted in Fig. 3(d), and the angle between the trace of (100) plane and the RD is determined to be 67°. Similarly, the angle between trace crack ② and the RD and the angle between the trace of (010) plane and the RD are also determined, which are 4° and 2° in the same direction, respectively. The error between the measured and predicted angles is only 2° for the two cracks, which indicates that the fracture plane of cracks ① and ② should be (100) plane and (010) plane, respectively, and belongs to {001} planes. This result agrees with the previous studies on conventional ferritic steels.16)
The fracture modes in the three samples are schematically illustrated in Fig. 4. The As-received sample, in which the cleavage cracks propagate parallel to the LD (Fig. 4(b)), differs from the AR sample, which shows an inclination for cleavage cracks that propagate almost along the RD (Fig. 4(c)). Cracking along the RD rather than the LD is probably related to the grain shape. Previous research shows that critical fracture stress increases with reducing grain size, and when stress exceeds the critical fracture stress, cleavage fracture begins to occur.17) The ferrite grains in the AR sample are elongated along the RD; therefore, they have a much larger size along the RD than they do along the transverse, resulting in much greater critical fracture stress for the transverse direction. This difference in critical fracture stress probably is the main cause for the aforementioned inclination in the AR sample.
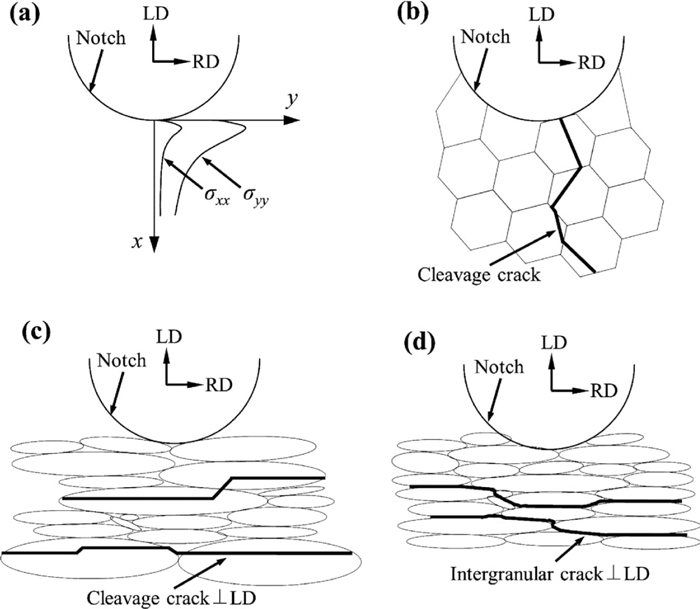
Schematic illustration of (a) the tensile stress distribution ahead of the notch root and the fracture mode in (b) the As-received sample, (c) the AR sample, and (d) the WR sample.
In the present study, observation was performed on the fractured specimen. Because it is not an in situ observation, the observation performed cannot detect the location of crack initiation, but it can indicate crack propagation direction―along the notch direction in the As-received steel (cf. Fig. 2(a)) and vertical to the notch direction in the AR and WR steels (cf. Figs. 2(b) and 2(c)). Although we do not know the exact location of crack initiation, the crack location in the AR and WR steels shows that the crack initiates ahead of the notch root instead of at the notch root.
When a three-point-bending specimen with a notch is being bent, stress concentration occurs around the notch. Figure 4(a) schematically shows the tensile stress distribution along the X-axis ahead of the notch root.18,19,20) The σyy and σxx are the tensile stress vertical and parallel to the X-axis (i.e., the notch direction), respectively. The σyy and σxx are the largest and lowest tensile stresses among all the directions in the X-Y plane. The maximum σyy or σxx is ahead of the notch root, not just at the notch root. A cleavage crack generally initiates at the location corresponding to the maximum stress point, and thus crack initiation is ahead of the notch root, not just at the notch root. This has been confirmed in the conventional alloys by the previous research.21) After initiation, the crack propagates in all directions. A part of the crack propagates towards to the notch root, and finally connects with it, forming a macrocrack. The crack initiation in the As-received steel should be this case.
Once a crack initiates, the crack will propagate along a certain direction. The As-received steel is essentially isotropic material. The resistance to fracture along the X- and Y-axis should be the same. Therefore, the crack naturally prefers to propagate along the X-axis rather than parallel to the Y-axis because the imposed stress σyy is the largest. The steel with elongated ferrite grains, such as AR and WR steels, is anisotropic material.20) This type of steel has the largest and the smallest resistance to fracture along the short- and long-axis of the elongated ferrite grains, respectively,20) i.e., parallel to the LD and RD in Figs. 4(c) and 4(d), respectively. In the AR and WR steels (cf. Figs. 4(c) and 4(d)), the largest resistance along the X-axis is against the largest σyy, whereas the smallest resistance parallel to the Y-axis is versus the smallest σxx. If the AR and WR steels are weak enough parallel to the Y-axis, the critical condition for crack propagation parallel to the Y-axis is first satisfied, and the crack propagates along this direction, as shown in Figs. 4(c) and 4(d).
Although the ferrite grains in the AR and WR steels have similar morphology, i.e., elongated grains, their fracture modes are completely different: mainly transgranular (cleavage) fracture in the AR sample (Fig. 4(c)) but intergranular fracture in the WR sample (Fig. 4(d)). The reason for this is not clearly understood yet. As described above, before rolling, the WR sample was water quenched after austenitizing at 1173 K, but the AR sample was air cooled. Water quenching probably produces higher residual stress in the WR sample than air cooling does in the AR sample. The difference in residual stress is likely the reason for the difference in the fracture modes in the two types of samples. However, this assumption needs to be verified.
In conclusion, microstructure and preparation process have important effects on the crack paths of ferritic steel. The cracks in the As-received sample consisting of large equiaxed grains propagate parallel to the LD in cleavage fracture mode. The AR sample with elongated grains of more than 1 μm fractures in cleavage fracture mode, but the cracks are ahead of the notch root and along the RD. The cleavage fractures in the As-received and AR samples have been demonstrated to occur along the {001} planes. Cleavage fractures prefer to occur in large grains rather than in small grains. The cracks in the WR sample with elongated grains less than 1 μm intergranularly propagate along the high-angle boundaries with an orientation angle equal to or greater than 10° under the notch along the RD.
We thank T. Hibaru, S. Kuroda, and Y. Taniuchi for materials processing. This study was supported in part by grants from the KAKENHI B (No. 23360312) and the Grant-in-Aid for Scientific Research on Innovative Area, “Bulk Nanostructured Metals,” through MEXT, Japan (No. 22102005).