3. Results
3.1. Distribution of Nd between Cu-rich and Fe-rich Phases in Fe–Cu–C System
The compositions of the Cu-rich and Fe-rich phases as mass percentages and mole fractions are shown in Table 1. The Nd content in the Cu-rich phase is higher than that in the Fe-rich phase, regardless of the temperature and the amount of Nd. We found that Nd is distributed in the Curich phase more than in the Fe-rich phase. Figure 1 shows the relationship between the mass percentage of Nd in the Cu-rich phase and that of Nd in the Fe-rich phase. The plots for different amounts of Nd at 1523 K and at 1623 K give straight lines. This means that the distribution ratio of Nd between the Cu-rich and Fe-rich phases does not change in the Nd concentration range used in the present experiments. The distribution ratio of Nd, defined as [mass%Nd]in Cu-rich/ [mass%Nd]in Fe-rich, is determined by the slope of the fitted line through the origin for the plots. The distribution ratios are 18.8 at 1523 K, 10.4 at 1623 K, and 6.2 at 1723 K. The distribution ratio of Nd between the Cu-rich and Fe-rich phases increases with decreasing temperature; i.e., Nd is more concentrated at low temperatures than at high temperatures. Sano et al.12) reported that the distribution of Ni between the two immiscible liquids in an Fe–Cu–C system has the similar tendency as that of Nd in the present work. They found that Ni is more concentrated in the Fe-rich phase at low temperatures than at high temperatures.

Table 1.
Compositions of Fe-rich and Cu-rich phases as (a) mass percentages and (b) mole fractions.

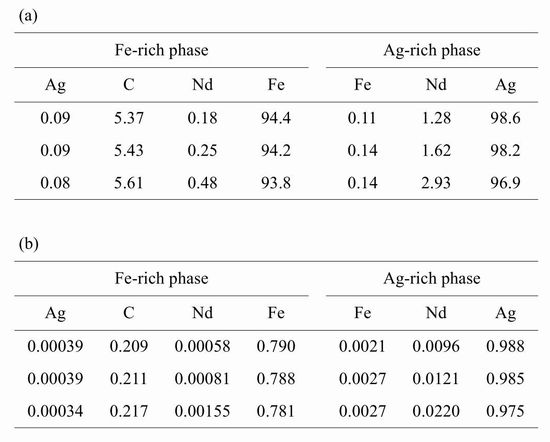
The compositions of the Ag-rich and Fe-rich phases as mass percentages and mole fractions are shown in Table 2. The content of Nd in the Ag-rich phase is higher than that in the Fe-rich phase, regardless of the amount of Nd, which means that Nd is distributed in the Ag-rich phase more than in the Fe-rich phase. The mass percentage of Nd in the Agrich phase is plotted against the mass percentage of Nd in the Fe-rich phase in Fig. 2. The plot shows a linear relationship. This suggests that the distribution ratio of Nd between the Ag-rich and Cu-rich phases is constant under our experimental conditions. The distribution ratio of Nd, defined as [mass%Nd]in Ag-rich/[mass%Nd]in Fe-rich, is 6.3 at 1623 K, so Nd is concentrated in the Ag-rich phase in the two immiscible liquids in the Fe–Ag–C system.
Table 2.
Compositions of Fe-rich and Ag-rich phases as (a) mass percentages and (b) mole fractions at 1623 K.
The reaction between Nd in the Cu-rich phase and Nd in the Fe-rich phase is expressed by Eq. (1).
|
Nd
(
Cu
)
=
Nd
(
Fe-C
)
| (1) |
The Cu-rich and Fe-rich phases are denoted by the subscripts (Cu) and (Fe–C), respectively. Both phases have the same Nd chemical potentials at equilibrium. The activity of Nd in the Cu-rich phase, aNd(Cu), is equal to the that in the Fe-rich phase, aNd(Fe–C), when the standard chemical potential of Nd is the same in both phases:
|
a
Nd
(
Cu
)
=
a
Nd
(
Fe-C
)
| (2) |
Using the relationship ai = γiXi, where ai is the activity of i, γi is the activity coefficient of i and Xi is mole fraction of i, Eq. (2) is rewritten as Eq. (3).
|
γ
Nd
(
Cu
)
X
Nd
(
Cu
)
=
γ
Nd
(
Fe-C
)
X
Nd
(
Fe-C
)
| (3) |
γNd(Cu) is the activity coefficient of Nd in the Cu-rich phase, based on Raoult's law, XNd(Cu) is the mole fraction of Nd in the Cu-rich phase, γNd(Fe–C) is the activity coefficient of Nd in the Fe-rich phase, based on Raoult's law, and XNd(Fe–C) is the mole fraction of Nd in the Fe-rich phase. γNd(Fe–C) and γNd(Cu) are given as Eqs. (4) and (5), based on Taylor expansions.14)
|
ln
γ
Nd
(
Fe-C
)
=ln
γ
Nd
(
Fe-C
)
o
+
ε
Nd
(
Fe-C
)
Nd
X
Nd
(
Fe-C
)
+
ε
Nd
(
Fe-C
)
Cu
X
Cu
(
Fe-C
)
| (4) |
|
ln
γ
Nd
(
Cu
)
=ln
γ
Nd
(
Cu
)
o
+
ε
Nd
Nd
X
Nd
(
Cu
)
+
ε
Nd
Fe
X
Fe
(
Cu
)
| (5) |
where
γ
Nd
(
Fe-C
)
o
is the activity coefficient of Nd in an infinitely dilute solution of the Fe-rich phase, based on Raoult's law,
ε
Nd
(
Fe-C
)
Nd
is the interaction coefficient of Nd with Nd itself in the Fe-rich phase,
XNd(Fe–C) is the mole fraction of Nd in the Fe-rich phase,
ε
Nd
(
Fe-C
)
Cu
is the interaction coefficient of Cu with Nd in the Fe-rich phase,
XCu(Fe–C) is the mole fraction of Cu in the Fe-rich phase.
γ
Nd
(
Cu
)
o
is the activity coefficient of Nd in an infinitely dilute solution of Cu, based on Raoult's law,
ε
Nd
(
Cu
)
Nd
is the interaction coefficient of Nd with Nd itself in Cu, and
XNd(Cu) is the mole fraction of Nd in the Cu-rich phase,
ε
Nd
(
Cu
)
Fe
is the interaction coefficient of Fe with Nd in Cu, and
XFe(Cu) is the mole fraction of Fe in the Cu-rich phase. In this thermodynamic assessment, the Fe-rich phase is treated as a C-saturated Fe alloy; in other words,
γNd(Fe–C) is the activity coefficient of Nd in C-saturated Fe,
γ
Nd
(
Fe-C
)
o
is the activity coefficient of Nd in an infinitely dilute solution (
XNd(Fe–C) → 0) of C-saturated Fe, and
ε
Nd
(
Fe-C
)
Cu
is the interaction coefficient of Cu with Nd in C-saturated Fe. In this treatment, the interaction of C with Nd in the Fe-rich phase is taken into account in the first term of the right-hand side of
Eq. (4),
i.e.,
γ
Nd
(
Fe-C
)
o
. In addition, it is defined that
γ
Nd
(
Fe-C
)
o
is not dependent on the content of C of the alloy in the vicinity of the carbon content of C-saturated Fe binary alloy although the existences of Cu
15,16) and Nd
17) can change the C content in C-saturated Fe alloy to some extent. The content of C in the Cu-rich phase was not analyzed in this work and the interaction of C on the activity coefficient of Nd in the Cu-rich phase was ignored because the content of C in the Cu-rich phase was considered to be negligibly small as described below. Nishi
18) and Horiguchi
et al.
19) reported that the C solubilities in Cu–C system and Cu– Nd–C system, where C and NdC2 are equilibrated, are expressed as log (C/mass ppm) = 4.97 − 7.04×10
3/
T and log (C/mass ppm) = 7.86 − 9.73×10
3/
T, respectively. From these relations, the C solubility in the Cu-rich phase is estimated to be small like around 0.001 mass% although the effect of Fe on the C content in the Cu-rich phase is not taken into consideration.
By combining Eqs. (3), (4), and (5) and using a relation
L
Nd
=
X
Nd
(
Cu
)
/
X
Nd
(
Fe-C
)
= const., the natural logarithm of the distribution ratio in mole fraction, ln
X
Nd
(
Cu
)
/
X
Nd
(
Fe-C
)
, is expressed as a next equation:
|
ln(
X
Nd
(
Cu
)
/
X
Nd
(
Fe-C
)
)
= ln(
γ
Nd
(
Fe-C
)
o
/
γ
Nd
(
Cu
)
o
)
+(
ε
Nd
(
Fe-C
)
Nd
/
L
Nd
-
ε
Nd
(
Cu
)
Nd
)
X
Nd
(
Cu
)
+
ε
Nd
(
Fe-C
)
Cu
X
Cu
(
Fe-C
)
-
ε
Nd
(
Cu
)
Fe
X
Fe
(
Cu
)
| (6) |
Here, we considered that the influence of
(
ε
Nd
(
Fe-C
)
Nd
/
L
Nd
-
ε
Nd
(
Cu
)
Nd
)
X
Nd
(
Cu
)
on Eq. (6) can be neglected because the influence of Nd on its distribution is negligibly small, at least under the conditions of the present experiments, as the distribution ratio of Nd shows a constant in spite of considerably larger change in XNd(Cu) than those in XCu(Fe–C) and XFe(Cu). The distribution ratio of Nd should increase or decrease monotonously if the influence of
(
ε
Nd
(
Fe-C
)
Nd
/
L
Nd
-
ε
Nd
(
Cu
)
Nd
)
X
Nd
(
Cu
)
is large. Remove of
(
ε
Nd
(
Fe-C
)
Nd
/
L
Nd
-
ε
Nd
(
Cu
)
Nd
)
X
Nd
(
Cu
)
in Eq. (6) and deformation of Eq. (6) give
|
ln(
γ
Nd
(
Cu
)
o
X
Nd
(
Cu
)
/
γ
Nd
(
Fe-C
)
o
X
Nd
(
Fe-C
)
)
/
X
Fe
(
Cu
)
=
ε
Nd
(
Fe-C
)
Cu
X
Cu
(
Fe-C
)
/
X
Fe
(
Cu
)
-
ε
Nd
(
Cu
)
Fe
| (7) |
Equation (7) shows that
ε
Nd
(
Fe-C
)
Cu
and
ε
Nd
(
Cu
)
Fe
can be calculated from the relationship between the left-hand side in Eq. (7) and
X
Cu
(
Fe-C
)
/
X
Fe
(
Cu
)
when
γ
Nd
(
Cu
)
o
and
γ
Nd
(
Fe-C
)
o
are known. That is to say,
ε
Nd
(
Fe-C
)
Cu
and
ε
Nd
(
Cu
)
Fe
correspond to the slope and the negative value of the intercept in the linear relationship between the left-hand side and
X
Cu
(
Fe-C
)
/
X
Fe
(
Cu
)
, respectively.
|
log(
γ
Nd
(
Cu
)
o
)
=0.638-3.15×
10
-4
T-4.98×
10
3
/T
(1523-1775 K)
| (8) |
was derived by Horiguchi
et al.
19) However,
γ
Nd
(
Fe-C
)
o
has not yet been derived. In this study, therefore,
γ
Nd
(
Fe-C
)
o
was obtained based on data on the distribution of Nd in the two immiscible liquids in an Fe–Ag–C system. By analogy with
Eq. (6), in an Fe–Cu–C system, the natural logarithm of the ratio of the mole fraction of Nd in the Ag-rich phase,
XNd(Ag), to the mole fraction of Nd in the Fe-rich phase,
XNd(Fe–C), is expressed by
Eq. (9).
|
ln(
X
Nd
(
Ag
)
/
X
Nd
(
Fe-C
)
)
= ln(
γ
Nd
(
Fe-C
)
o
/
γ
Nd
(
Ag
)
o
)
+
ε
Nd
(
Fe-C
)
Ag
X
Ag
(
Fe-C
)
-
ε
Nd
(
Ag
)
Fe
X
Fe
(
Ag
)
| (9) |
where
γ
Nd
(
Ag
)
o
is the activity coefficient of Nd in an infinitely dilute solution of Ag, based on Raoult's law,
ε
Nd
(
Fe-C
)
Ag
is the interaction coefficient of Ag with Nd in C-saturated Fe,
XAg(Fe–C) is the mole fraction of Ag in the Fe-rich phase,
ε
Nd
(
Ag
)
Fe
is the interaction coefficient of Fe with Nd in Ag,
XFe(Ag) and is the mole fraction of Fe in the Ag-rich phase. Here, the Ferich phase is treated as a C-saturated Fe alloy, as in the Fe– Cu–C system. In
Eq. (9), the terms of interactions between Nd elements were neglected because Nd does not affect the distribution of Nd in the Fe–Ag–C system, as mentioned above. In addition, the interaction of C on the activity coefficient of Nd in the Ag-rich phase was ignored because the content of C in the Ag-rich phase was considered to be negligibly small as well as in the Cu-rich phase in Fe–Cu–C system. Although there are no investigations on the solubility of C in Ag–Nd–C system, it is estimated that the content of C in the Ag-rich phase is quite small since the C solubility in Ag–C system, which is expected to be around 0.0001 masss% from Ag–C phase diagram,
20) is smaller than that in Cu–C system. Moreover, the terms
ε
Nd
(
Fe-C
)
Ag
·
XAg(Fe–C) and
ε
Nd
(
Ag
)
Fe
·
XFe(Ag) were not taken into account in the calculation because the values of
XAg(Fe–C) and
XFe(Ag) are very low, as shown in
Table 2. Thus,
γ
Nd
(
Fe-C
)
o
is calculated from
γ
Nd
(
Ag
)
o
,
XNd(Ag), and
XNd(Fe–C). Ivanov and Lukashenko
21) has reported that
γ
Nd
(
Ag
)
o
= 0.00265 at 1363 K. Using the relationship ln
γo·
T = const.,
22)
γ
Nd
(
Ag
)
o
at 1623 K is 0.00687.
γ
Nd
(
Fe-C
)
o
= 0.104 at 1623 K is calculated from
γ
Nd
(
Ag
)
o
, and
XNd(Ag) and
XNd(Fe–C) in
Table 2. With the values of
γ
Nd
(
Cu
)
o
, which is 0.00114 at 1623 K from
Eq. (8), and
γ
Nd
(
Fe-C
)
o
, and the compositional data for the Cu-rich and Fe-rich phases listed in
Table 1, the relationship in
Eq. (7);
i.e., the relationship between the left-hand side and
X
Cu
(
Fe-C
)
/
X
Fe
(
Cu
)
in
Eq. (7) is plotted in
Fig. 3.
Figure 3 shows a reasonable linear relationship between the left-hand side and
X
Cu
(
Fe-C
)
/
X
Fe
(
Cu
)
. From the slope and intercept of the linear equation,
ε
Nd
(
Fe-C
)
Cu
= −57.6 and
ε
Nd
(
Cu
)
Fe
= −11.8, respectively, are obtained. There is no data for
ε
Nd
(
Fe-C
)
Cu
and
ε
Nd
(
Cu
)
Fe
to our knowledge. The large negative value of
ε
Nd
(
Fe-C
)
Cu
like minus several dozen means that the elements Nd and Cu have a stronger affinity for each other than for Fe–C. This can be qualitatively inferred from the following equation with the properties of the binary limiting system in the regular solution model:
14)
|
ε
Nd
(
Fe-C
)
Cu
=ln
γ
Nd
(
Cu
)
o
-ln
γ
Cu
(
Fe-C
)
o
-ln
γ
Nd
(
Fe-C
)
o
| (10) |
where
γ
Cu
(
Fe-C
)
o
is the activity coefficient of Cu in an infinitely dilute solution of C-saturated Fe. The values of
γ
Nd
(
Cu
)
o
,
γ
Cu
(
Fe-C
)
o
and
γ
Nd
(
Fe-C
)
o
at 1623 K are 0.00114, 39.6 which is estimated by
γ
Cu
(
Fe-C
)
o
= 35.5 at 1673 K
23) and ln
γo·
T = const. and 0.104, respectively. The smaller
γ
i
(
j
)
o
in case of
γ
i
(
j
)
o
< 1 represents a stronger affinity of interaction between
i and
j, the larger
γ
i
(
j
)
o
in case of
γ
i
(
j
)
o
> 1 represents a stronger repulsive force between
i and
j, and
γ
i
(
j
)
o
= 1 represents no interaction between
i and
j. The order of
γ
Nd
(
Cu
)
o
<
γ
Nd
(
Fe-C
)
o
<
γ
Cu
(
Fe-C
)
o
corresponds to the negative value of
ε
Nd
(
Fe-C
)
Cu
although its absolute value cannot be evaluated.
The dependence of distribution of Nd between Cu-rich and Fe-rich phases in Fe–Cu–C system on temperature was evaluated by using the thermodynamic parameters obtained in the present work. Here, we assumed that the temperature dependence of
γ
Nd
(
Fe-C
)
o
is calculated by lnγo·T = const., and those of
ε
Nd
(
Fe-C
)
Cu
and
ε
Nd
(
Cu
)
Fe
are by ε·T = const.
γ
Nd
(
Cu
)
o
is a function of temperature as shown in Eq. (8). The calculated
(
X
Nd
(
Cu
)
/
X
Nd
(
Fe-C
)
)
are plotted with an inverse of temperature in Fig. 4. The experimental values are also shown in the figure. As well as the calculated results at 1623 K, where the thermodynamic parameters were determined, those at 1523 K are in relatively-good agreement with the experimental results. On the other hand, the calculated value at 1723 K is much lower than the experimental one. This difference is considered to be attributable to the temperature dependence of thermodynamic parameters and the lack of higher order interaction parameters. In this work, we conducted the calculation under assumption of lnγo·T = const. and ε·T = const. However, the real temperature dependence of thermodynamic parameters can be different from this assumption. In addition, XCu(Fe–C) and XFe(Cu) at 1723 K are as high as 0.08 in comparisons with those at 1623 and 1523 K. In such cases, the activity coefficient cannot be expressed by the interaction parameter of first order and the term on the interaction parameter for higher order should be included in the expression for activity coefficient.

In our experiment, several % of Nd is contained in the Cu-rich phase in Fe–Cu–C system and in the Ag-rich phase in Fe–Ag–C system. The maximum Nd contents in the Curich phase and the Ag-rich phase were as high as 5.89 and 2.93 mass%. This magnitude of Nd content reminds us of the possibility of NdC2 formation. Therefore, we discussed the formation of NdC2 under our experimental conditions. Here, the binary M–Nd alloy (M=Cu or Ag) is treated for simplicity. The reaction of Nd in M–Nd alloy (M=Cu or Ag) and C to form NdC2 is expressed as below:
|
Δ
G
NdC
2
O
=-95 240-23.57T (J/mol)
| 19,24) (12) |
Equation (12) is changed into Eq. (13).
|
Δ
G
NdC
2
O
=-RTln{
a
NdC
2
/
(
a
Nd
(M)
⋅
a
C
2
)
}
| (13) |
Here, both aC and aNdC2 are defined as 1. By using aNd(M) = γNd(M) · XNd(M), Eq. (14) was obtained.
|
Δ
G
NdC
2
O
=RTln(
γ
Nd
(M)
⋅
X
Nd
(M)
)
| (14) |
This equation means the solubility of Nd in M–Nd alloy (M=Cu or Ag) is calculated when the activity coefficient of Nd in M–Nd alloy (M=Cu or Ag) is known. When Eq. (8) is used as the activity coefficient of Nd in Cu–Nd system, the Nd solubility in Cu–Nd system in the presence of C and NdC2 at 1523, 1623 and 1723 K are estimated to be 8.9, 9.5 and 10.2 mass% from Eqs.11, 13 and 14, respectively. It is expected that NdC2 does not appear in the Cu-rich phase in Fe–Cu–C system in our experiment even if the effect of Fe on the solubility of Nd is considered. This is because γNd(Cu) decreases with the content of Fe in Cu–Nd system due to the negative value of
ε
Nd
(
Cu
)
Fe
.
On the other hand, there is no data on the activity coefficient of Nd in Ag–Nd–C system with the presence of C and NdC2. Thus, the formation of NdC2 in the Ag-rich phase in Fe–Ag–C system was discussed based on the activity coefficient of Nd in Ag–Nd system. The activity coefficient of Nd in an infinitely dilute solution of Ag,
γ
Nd
(
Ag
)
o
, is 0.00687 at 1623 K as described above. This value leads to 0.98 mass% of Nd solubility in the presence of C and NdC2 in Ag–Nd system. The contents of Nd in the Ag-rich phase in the present work are higher than 0.98 mass%, which suggests the possibility of the formation of NdC2. However, it is considered that the formation of NdC2 does not occur in the experiment by the following reason. If NdC2 is formed, the content of Nd in “Ag-rich phase” should show a constant value, i.e. solubility of Nd in the presence of C and NdC2. Here, “Ag-rich phase” means a liquid part, which does not contain any NdC2, in the Ag-rich phase. In addition, the content of Nd in the Fe-rich phase also shows a constant value determined by the distribution ratio of Nd between “Ag-rich phase” and Fe-rich phase in case of the existence of NdC2. From this viewpoint, the increase of Nd content in the Ferich phase in the present work is not in accordance with the phenomenon predicted by the existence of NdC2. Further work like the investigation on the solubility of Nd in Ag– Nd system with the presence of C and NdC2 needs to be conducted in order to elucidate this point.
;%0A%09%09%09newWindow.document.open();%0A%09%09%09newWindow.document.write('<img src=%22./Graphics/53_551_tbl_1.jpg%22>');%0A%09%09%09newWindow.document.close();%0A%09%09)

;%0A%09%09%09newWindow.document.open();%0A%09%09%09newWindow.document.write('<img src=%22./Graphics/53_551_tbl_2.jpg%22>');%0A%09%09%09newWindow.document.close();%0A%09%09)
