Regular Article
Influence of Physical Properties of Melt on Liquid Dripping in Packed Bed Analyzed by MPS Method
2013 年 53 巻 4 号 p. 590-597
詳細
2013 年 53 巻 4 号 p. 590-597
The liquid dripping under the cohesive zone influences gas flow and permeability in the lower part of the blast furnace, and it is closely related to blast furnace productivity and operational stability. Especially, liquid distribution and hold-up in the coke packed bed can be mentioned as important phenomena regarding the liquid dripping. Although these phenomena are influenced by the structure of the packed bed and the physical properties of the melt, numerical analysis of blast furnace based on melt properties is difficult. Therefore, in this research, the influence of the physical properties of the melt on liquid flow distribution and hold-up phenomena was studied by modeling the liquid flow in a packed bed and performing numerical analysis based on Moving Particle Semi-implicit (MPS) method, which is one of the particle methods. The results of the analysis clarified the fact that the viscosity of the liquid is the controlling factor for dynamic hold-up, and solid-liquid wettability is the controlling factor for static hold-up.
In blast furnace operation, the behavior of liquid dripping of pig iron and slag in the lower part is closely related to blast furnace productivity and operational stability. To improve these factors, it is necessary to understand the details and inner conditions of blast furnace. With this backgrounds, liquid flow behaviors in the coke packed bed under the cohesive zone were actively investigated by cold model experiments from the viewpoint of prediction of hold-up, formulation of flooding phenomena and modeling of liquid flows.1,2,3,4,5,6,7,8,9,10) Such dripping phenomena are influenced by the physical properties of the liquid, interfacial phenomena and other basic physical properties. Ohgusu et al. measured the hot static hold-up of slag in a coke packed bed and analyzed the relationship between hold-up and temperature, composition, and the packed bed structure.1) Kawabata et al. observed the liquid flow behavior in a packed bed and clarified that wettability influences the amount of hold-up on the basis of the cold model experiment.2) Hold-up of the liquid phase in a packed bed can be divided into dynamic holdup, in which the remaining liquid is gradually discharged after the liquid supply is exhausted, and static hold-up, in which the held-up liquid is retained in the packed bed. Fukutake et al. delivered on the basis of experiments the liquid hold-up as a function of the capillary number.3,4) As these examples show, the influence of the physical properties of the melt, wetting, etc. have been analyzed previously. Nevertheless, the existing measured data on the wettability of melt to coke remain still insufficient for understanding the actual phenomena in the blast furnace, and the relationship between liquid flows in a packed bed and physical properties has not been arranged systematically. Moreover, modeling of the liquid flows in the lower part had been performed by expression as a continuum5) or methods that grasped the liquid distribution stochastically and quantified the liquid flow considering the liquid flow as motion of solid particles.6,7) Using a force-balance approach, the flows of molten iron and slag were characterized and had been integrated into the blast furnace numerical simulation by S. J. Chew et al.8,9) However, the influence of the packed bed structure and physical properties of the melt had not been examined sufficiently.
In conventional cold experiments, it was difficult to simulate the actual conditions in the blast furnace accurately because the physical properties of the liquids depended on composition and temperature conditions. The authors previously showed the fundamental mathematical formulation on the liquid flows in a packed bed by introducing wettability model of liquid droplets with solids using the Moving Particle Semi-implicit (MPS) method.10,11) In the present research, the behaviors of liquids in the packed bed were analyzed by using the MPS method, with the aim of developing a systematic explanation of the influence of solid-liquid wettability and viscosity on liquid flow in a packed bed.
Figure 1 shows the concept of the MPS method.12) One droplet is spatially divided into a finite number of particles. The motion of each particle is described using the continuity equation and Navier-Stokes equations. Particle method is fundamentally free from spatial constraints. The concept of a fixed space grid is not used here. The gradient model and Laplacian model shown in the figure were used as expressions of the interactions between individual particles.
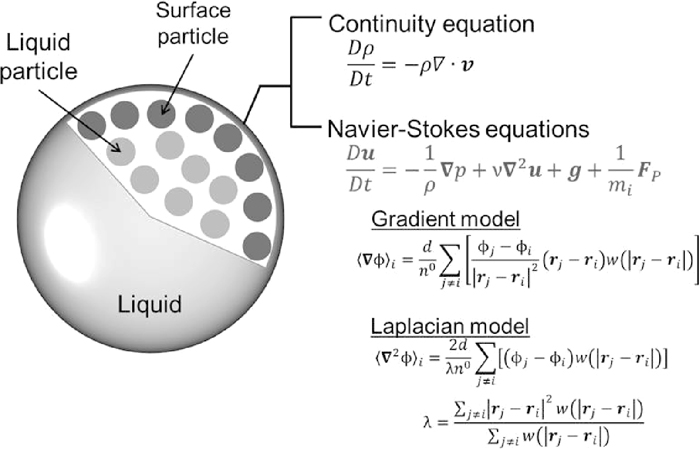
Concept of MPS method and fundamental equations.
The governing equations for liquid flows are the continuity equation and Navier-Stokes equations in an isothermal incompressible flow.
| (1) |
| (2) |
| (3) |
| (4) |
In an incompressible flow, the standard particle number density in the initial condition n0 is obtained as the incompressible state, assuming a constant particle number density. Discretization of the gradient and Laplacian of velocity v is performed as follows using the respective differential operators.
The equation of motion of the particles is solved explicitly from the governing equation by substituting the differential operator in the governing equation in the above discrete model.
Pressure is solved implicitly by introducing Poisson's equation so as to satisfy the incompressibility condition. The following two problems arise with the standard MPS method: First, momentum is not conserved in the calculation of the pressure gradient term, and second, because an oscillatory pressure solution is obtained, the local particle motion such as surface particles, etc. is not stable. Therefore, in the present research, a method following Tanaka et al.,13) in which weak compressibility is introduced in Poisson's equation for pressure, was adopted in order to keep a smooth pressure distribution, and the equation for the pressure gradient term proposed by Toyota et al.14) was used for conservation of momentum.
| (5) |
| (6) |
Furthermore, in the pressure calculations, the pressure of the surface particles was assumed to be 0 as a boundary condition, and the internal pressure in the liquid droplet was calculated using this as a standard. In conventional judgment of the particle number density, particles inside a fluid may be judged to be a free surface. Here, therefore, surface judgment was performed using the neighboring particle number Ni.
| (7) |
The surface tension model is based on the interparticle potential method proposed by Kondo et al.,15) which eliminates the need for complex curvature calculations, with modification for calculation of the wetting angle at a 3 phase interface. Interparticle potential is defined as follows.
| (8) |
| (9) |
| (10) |
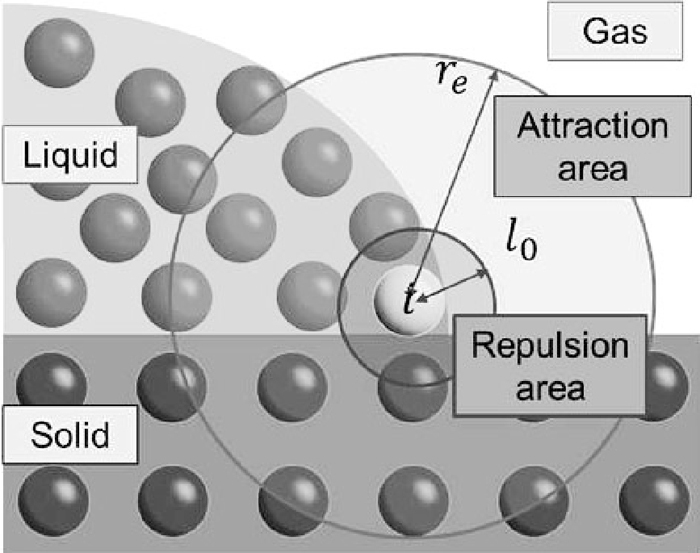
Surface tension model using interparticle potential.
| (11) |
| (12) |
The conditions for calculation of a liquid flow in a packed bed are shown in Table 1. Both the droplet and the packed material consist of particles with diameters of 0.8 mm. The packed material assumes coke. The total number of particles comprising the droplet is 33398, and the total number of solid particles for the packed material is 428345. The packed material is spherical in shape with a diameter of 20 mm, and is made up of particles having a diameter of 0.8 mm. The packed bed structure and initial shape of the droplet are shown in Fig. 3. The packed structure was determined by Discrete Element Method (DEM). In this research, calculations were performed by placing an initial droplet with a spherical shape, as shown in black, on top of the packed bed in Fig. 3, and beginning dripping under the force of gravity simultaneously with the start of the calculation.
| Liquid | Solid | ||
|---|---|---|---|
| Particle number | 33398 | 428345 | [–] |
| Particle diameter | 0.8 | 0.8 | [mm] |
| Droplet diameter | 32 | – | [mm] |
| Filler diameter | – | 20 | [mm] |
| Height of packed bed | – | 60 | [mm] |
| Surface tension coefficient | 7.28 × 10⁻² | – | [N/m] |
| 1.39 × 10⁻⁶ | |||
| Kinematic viscosity coefficient | 1.39 × 10⁻⁵ | – | [m2/s] |
| 1.39 × 10⁻⁴ | |||
| Wetting angle | 30°, 60°, 90°, 120°, 150°, 180° | ||
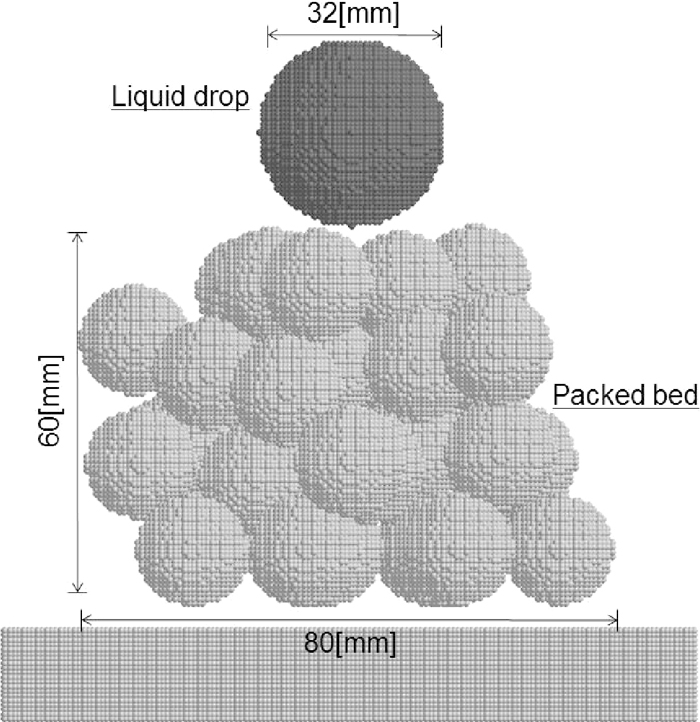
Packed bed structure simulated in MPS method.
In a blast furnace, the values of the physical properties of molten iron and slag change greatly due to the influence of temperature, composition, and other factors. From previous research, the kinematic viscosity coefficient of molten iron is considered to be in the range from 10–6 to 10–5 [m2/s], and that of slag, in the range from 10–5 to 10–4[m2/s].16) Considering this range, in the present research, the kinematic viscosity coefficient was set to values of 1.39 × 10⁻⁶[m2/s] (condition (a)) as the base condition, 10 times the base value (condition (b)), and 100 times the base value (condition (c)). Wettability varies greatly depending on the interfacial reactions and composition of the melt.17) As conditions in the blast furnace, Fukutake et al. estimated wettability with respect to the surface of coke as 105° – 160° for slag and 125° for metal.3,4) Based on this, the wetting angle for each viscosity was set from 30° to 180° in steps of 30°. For surface tension, 7.28 × 10⁻²[N/m], which is the physical value for water, was used in this analysis.
3.2. Simulation of Liquid Flow in Packed BedFigures 4 and 5 show the results of simulations of the liquid flows with wetting angles of 60° and 150°. The gray particles in the figure show the liquid, and the white particles show the solid. The plate at the bottom is a receptacle.
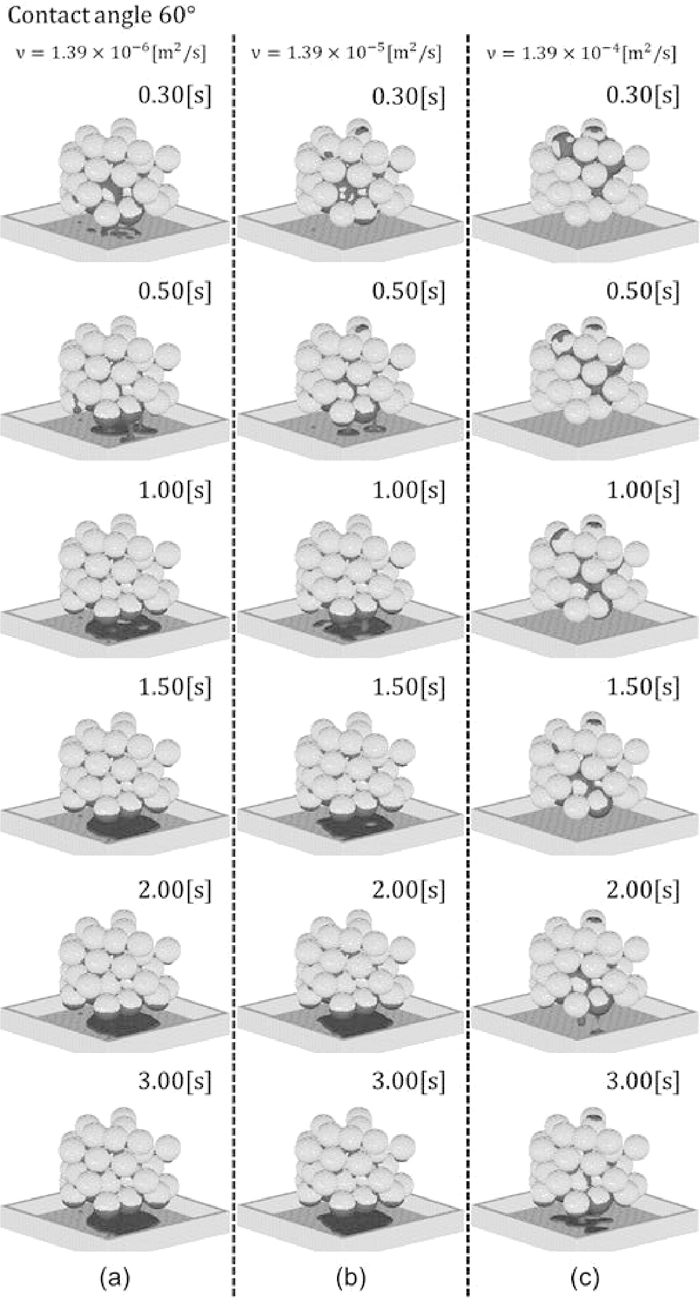
Liquid flow in packed bed (contact angle60°).
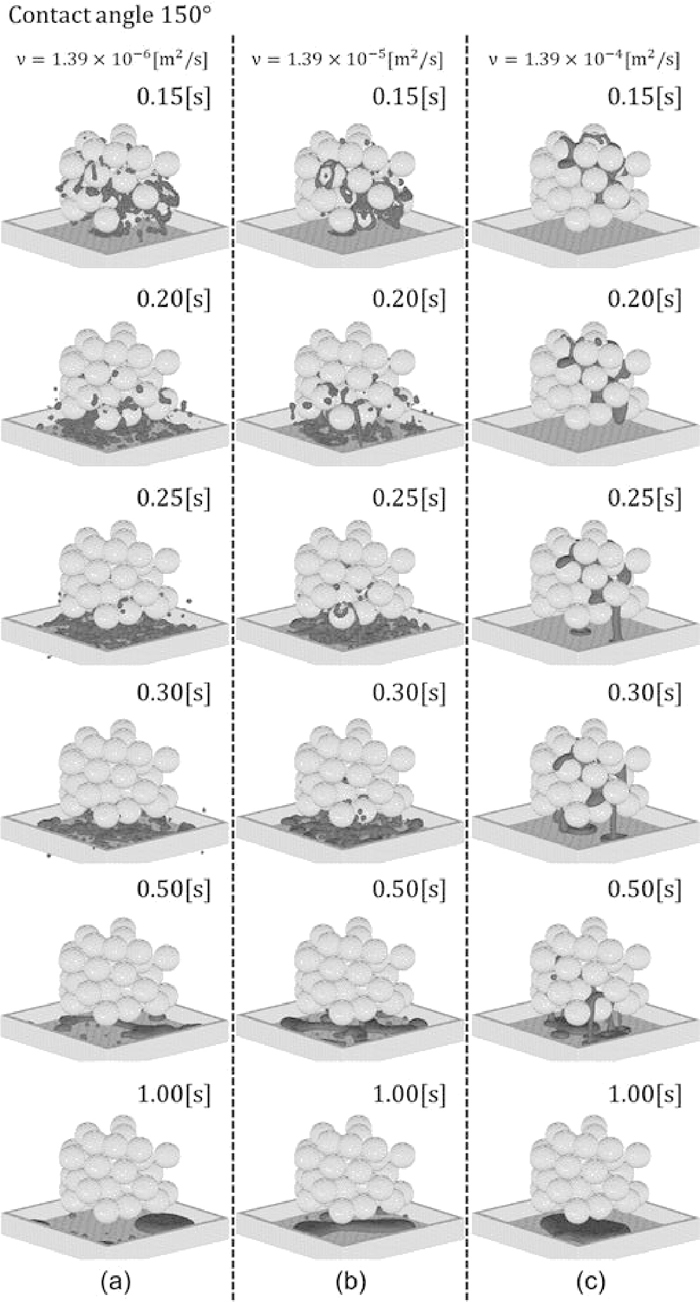
Liquid flow in packed bed (contact angle150°).
Figure 4 shows the dripping condition at 0.3, 0.5, 1.0, 2.0, and 3.0 seconds after the start of dripping. In order from the left, this figure shows the influence on dripping behavior when the viscosity is changed to 1.39 × 10⁻⁶, 1.39 × 10⁻⁵, 1.39 × 10⁻⁴[m2/s], respectively. Under condition (a), which is the case of the lowest kinematic viscosity coefficient, the droplet has passed through the packed bed at t = 0.3[s]. Likewise, under condition (b), part of the droplet has also reached the receptacle, but some liquid remains in the packed bed. In contrast to this, under condition (c), which is the case of the highest kinematic viscosity coefficient, most of the liquid is still held up at the top part of the bed. At t = 0.5[s], under conditions (a) and (b), it can be confirmed that the liquid from the bottom of the packed bed has formed a icicle shape and is separating from the packed bed, while under condition (c), it can be understood that the droplet particles still have not reached the bottommost layer, and in comparison with (a) and (b), a large amount of liquid still remains in the top part. At t = 1.0[s], dripping of the liquid has finished under condition (a), and static hold-up can be observed in the top part. In (b), the dripping of the liquid is continuing, but static hold-up has occurred in the top part. The locations where the liquid has adhered are concentrated at the bottom of the packed materials, as in (a), and at locations where the packed materials are in mutual contact. In (c), the liquid has reached the bottom layer of the packed bed, but all the liquid remain in the packed bed. At 1.5[s], dripping of the liquid has been completed under condition (a), and at t = 2.0[s], dripping has been completed and an equilibrium state has been achieved under both conditions (a) and (b). In (c), dripping is continuing, and the shape of the liquid that separates at this time is a droplet shape. Moreover, due to the high viscosity of the liquid in (c), the motion of the liquid had been continued even at t = 3.0[s].
Figure 5 shows the condition at 0.15, 0.20, 0.25, 0.30, 0.50, and 1.00 seconds after dripping for the wetting angle of 150°. At t = 0.15[s], under conditions (a) and (b), it can be confirmed that the liquid has assumed a droplet shape in the packed bed and is widely dispersed, but under condition (c), virtually no dispersion can be seen, and the liquid flow is delayed in comparison with (a) and (b). Under conditions (a) and (b), most of the liquid particles have passed through the packed bed at t = 0.20[s], and at this time, hold-up in the packed bed cannot be observed. There is little tendency to descend in a icicle shape, as was observed under the condition of good wettability, and the liquid assumes a droplet shape and dripping occurs from the entire packed bed. Under condition (c), dispersion of the liquid is slight, and the liquid converges as it descends through the packed bed. At t = 0.25[s], under condition (a), some of the liquid droplets have fallen outside the receptacle, and under condition (c), the liquid is dripping from the packed bed in a icicle shape. Unlike the case of good wettability, at this time, dripping occurs from the outer side of the packed materials. No large changes can be seen at 0.3[s], and dripping of the liquid is continuing. At t = 0.5[s], all of the liquid has passed through the packed bed under conditions (a) and (b), and dripping is continuing only under condition (c). At t = 1.0[s], dripping has been completed under all 3 conditions, and static hold-up cannot be observed under any of the conditions.
From the above, comparing the cases of good wettability (Fig. 4) and poor wettability (Fig. 5), the time required for the liquid droplet to pass through a packed bed is easily influenced by the kinematic viscosity coefficient when wettability is good. On the other hand, when wettability is poor, there is little difference depending on the kinematic viscosity coefficient. Regarding the condition of dripping, when wettability is good, the liquid migration can be seen across the solid surface and drips in a specific region, whereas, when wettability is poor, the liquid droplet is dispersed and the flow tends to spread in the horizontal direction.
3.3. Liquid Flow DistributionIn order to clarify the dispersion and flow modes of liquids in packed beds, orthogonal grids which were fixed in the center cross section of a packed bed was generated, and the flow of liquid particles flowing through that grids were analyzed. Grid size is 1.0 mm × 1.0 mm. Figure 6 shows the time integration of particles passing at the central cross section of the packed bed under various conditions using the following Eq. (13).
| (13) |
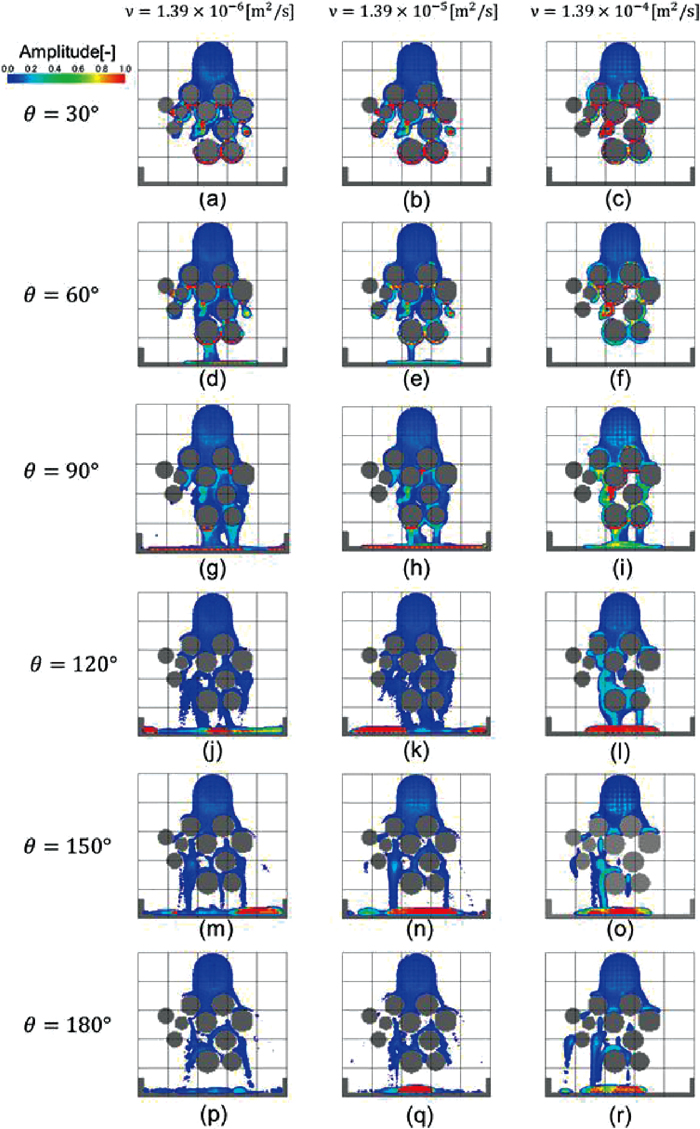
Effect of viscosity on variation of flow path.
Here, I is the integrated value of the liquid particle existence time at respective coordinates, T is the total analysis time, and N is the particle number at each grid. The parts in gray show the packed material and receptacle, and parts shown from blue to red are parts where liquid particles exist. Parts where liquid particles exist during a larger calculation time are shown in red. This means that either a larger liquid flow or static hold-up occurred at the parts shown in red. The total calculation time T was defined as the time until particle motion stabilized after the start of dripping, or the upper limit of calculation time (3.0 sec).
In the case of a wetting angle of 30°, under all conditions, virtually all liquid particles are held up in the packed bed. With the wetting angle of 60°, under conditions (d) and (e), that is, when the kinematic viscosity coefficient is low, some of the liquid particles passed through the packed bed and reached the receptacle at the bottom. At this time, the liquid was migrated across the surface of the packed material, and the droplet dripped from the center of the bottom of the packed bed. This tendency was remarkable under analysis condition (e), i.e., a high kinematic viscosity coefficient. A similar tendency was also observed in the case of the wetting angle of 90°. With the wetting angle of 90°, the liquid particles passed through the packed bed and reached the receptacle at the bottom under all analysis conditions. Under condition (i), with a high kinematic viscosity coefficient, existence of a space in the packed bed where the liquid does not pass can be confirmed. Because this type of space does not form under conditions (g) and (h), that is, when the kinematic viscosity coefficient is low, it is considered that the flow is easily influenced by the packed material's surface when viscosity exceeds a certain value. Furthermore, under conditions of good wettability, it is thought that the tendency of the liquid to flow in the packed bed by cover over the packed material surface is strong, and the flow path is easily influenced by the structure of the packed bed.
The wetting angle of 120° is regarded as a condition of poor wettability, but under condition (1), where kinematic viscosity coefficient is high, behavior like that in which the liquid flows around the packed material surface can be observed. This is similar to the flow under conditions of good wettability. However, this type of behavior cannot be seen under conditions (j) and (k), where kinematic viscosity coefficient is low. Dispersion of the liquid in the horizontal direction is rarely seen in cases of good wettability, but in contrast, with the wetting angle of 120°, dispersion increases as the kinematic viscosity coefficient decreases. In the case of the wetting angle of 150°, no motion in which the liquid flows around the packed material can be observed under any of the conditions, and the liquid separates from the side surface of the packed material and flows in the packed bed. Similar behavior can also be observed with the wetting angle of 180°. However, with the lowest kinematic viscosity coefficient, that is, condition (p), dripping in which the liquid spreads in the horizontal direction when it comes into contact with the packed material can be observed. Based on this, it is considered that the liquid takes a flow path distribution that spreads in the horizontal direction as wettability decreases. Focusing on static hold-up, when the wetting angle is 150° or larger, irrespective of the kinematic viscosity coefficient, remaining liquid is not observed under any of the conditions, and all liquid particles pass through the packed bed and reach the receptacle.
From the analysis results presented above, in a packed bed with spheres of one size, the amount of static hold-up becomes larger and the flow path distribution become narrower as the wetting angle decreases. On the other hand, the kinematic viscosity coefficient is thought to have a large influence on the dripping speed and local flow rate when a liquid drips in a packed bed. Specifically, when the kinematic viscosity coefficient increases to a certain level, the local flow rate in the packed bed decreases, and under conditions of good wettability, the proportion of liquid that comes into contact with the packed material increases. For this reason, the influence of wettability on static hold-up is considered to increase as the kinematic viscosity coefficient increases.
In order to quantify the dynamic behavior of the liquid flow in a packed bed, the change over time in the number of particles existing in a packed bed was examined. Figure 7 shows the change in the particle number in a packed bed over time. The particle number reaches its peak in the time range of t = 0.1 – 0.2[s], and then shows a decreasing curve that varies depending on the influence of kinematic viscosity and the wetting angle. Figure 8 is a schematic diagram of the hold-up phenomenon in Fig. 7. In virtually all cases, the particle number in the packed bed becomes constant after a certain time. The ratio of change from the peak is considered to correspond to the dripping velocity from the layer. Accordingly, the average dripping velocity passing through the layer was calculated from the relationship of the layer height and the decrease curve from the peak particle number, as shown in the schematic diagram in Fig. 8. This corresponds to the flow in the dynamic hold-up region. The amount of dynamic hold-up changes with a rate of liquid supply. In this study, average dripping rate is defined as an index of dynamic hold-up with specific calculation conditions mentioned in 3.1. Therefore, effect of physical properties of melts on average dripping rate is treated as effect of physical properties of melts on dynamic hold-up. After completion of dripping from the layer, the particle number takes a constant value, and this value corresponds to static hold-up. However, because the upper limit of the calculation time in this analysis was 3.0 seconds, and the dripping velocity was extremely retarded under the analytical conditions of a wetting angle of 60° and kinematic viscosity coefficient ν = 1.39 × 10⁻⁴[m2/s], and wetting angle of 90° and kinematic viscosity coefficient ν = 1.39 × 10⁻⁴[m2/s], the particle number did not reach a constant value under these conditions. Static hold-up was converted to the volume ratio in the packed bed and evaluated. The volume ratio is the ratio of the volume that liquid particles occupy in a packed bed with a height of 60 mm and radius of 40 mm, as calculated from the number of particles displaying static hold-up.
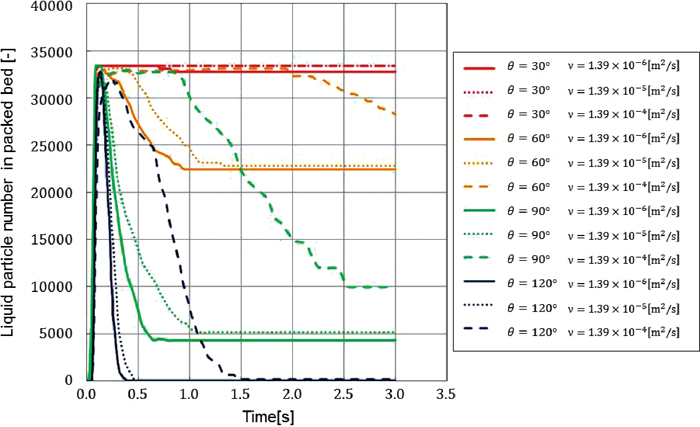
Change of liquid particle number in packed bed with time.
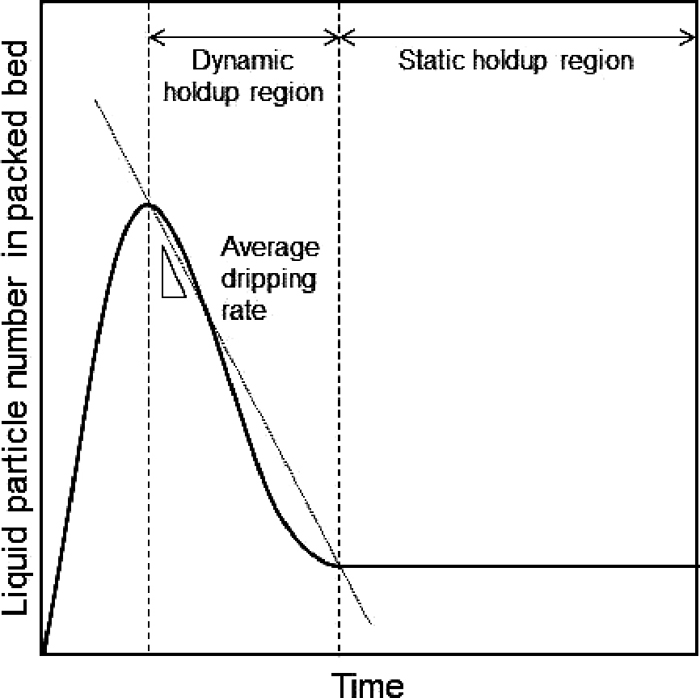
Schematic diagram of hold-up phenomena.
Figure 9 shows the relationship between the wetting angle and static hold-up obtained from the liquid particles in the packed bed in Fig. 7. The results are plotted for the cases of kinematic viscosity coefficients of 1.39 × 10⁻⁵ and 1.39 × 10⁻⁶[m2/s], as static hold-up could be confirmed with these values. Compared with the wetting angle, the influence of the value of the kinematic viscosity coefficient on static hold-up is low. With both kinematic viscosity coefficients, a tendency in which the volume ratio increased as wettability improved could be seen. This shows that the amount of static hold-up in the packed bed increases as wettability improves. From experiments, Fukutake et al. obtained analytical results in which the amount of static hold-up increases as the value of the wetting angle cos θ increases.3) The calculated results in the present research agree with the tendency of the experimental results obtained by Fukutake et al.

Effect of contact angle on static hold-up based on liquid particle volume ratio.
Figure 10 shows the relationship between the kinematic viscosity coefficients and the average dripping rate obtained by the method described above. From this figure, at the same wetting angle, the average dripping rate decreases as the value of the kinematic viscosity coefficient increases, and in particular, a large decrease in the average dripping rate occurs between 1.39 × 10⁻⁵[m2/s] and 1.39 × 10⁻⁴[m2/s]. This shows that higher viscosity increases dynamic hold-up. Increased hold-up reduces the void ratio in a packed bed, and thus becomes a cause of increased pressure loss. When the condition in a blast furnace is assumed, a decrease in the temperature of the molten slag causes increased viscosity, and it has been suggested that this leads to the instable operation of blast furnace.5) Since this shows the same tendency as in the analytical results in the present research, improvement of the fluidity of molten slag is considered to be a necessary factor for improvement of operational efficiency.
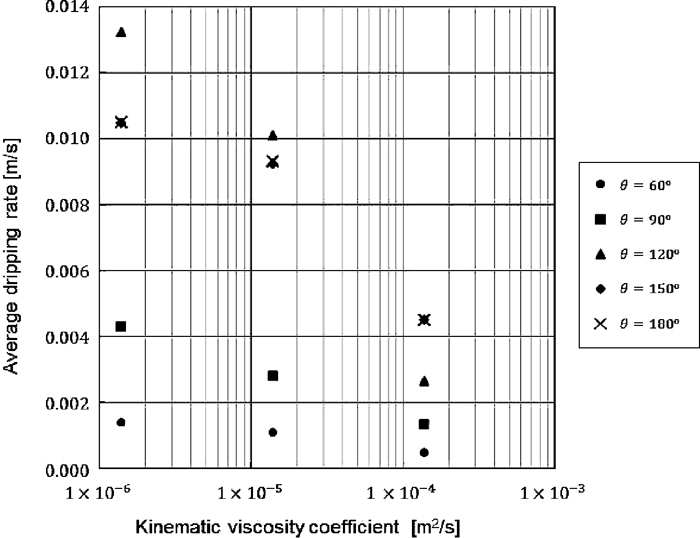
Effect of kinematic viscosity coefficient on average dripping rate.
Figure 11 shows the relationship between the wetting angle and the average dripping rate. As a general tendency, it can be understood that the average dripping rate increases as wettability decreases. As the wetting angle becomes larger, it is estimated that dripping occurs as though the liquid is repelled by the packed bed particle surface, and as a result, the dripping rate increases. However, under conditions of kinematic viscosity coefficients of 1.39 × 10⁻⁵ and 1.39 × 10⁻⁶[m2/s], the largest increase in the average dripping rate occurs when the wetting angles is 120° (cos θ = –0.5). Under conditions of kinematic viscosity coefficients of 1.39 × 10⁻⁵ and 1.39 × 10⁻⁶[m2/s] and wetting angles of 150° and 180°, liquid droplets are repelled by the packed bed particles, and are expelled from the composed packed bed , deviating to outside the calculation region. Because the average dripping rate is calculated using only the liquid particles that drip in the calculation region, it is possible that the average dripping rate is underestimated under conditions of large wetting angles. However, these results suggest the possibility that the average dripping rate changes depending on a combination of conditions, including not only wettability and the kinematic viscosity coefficient, but also the structure of the packed bed, the initial velocity of the liquid phase, the density of the liquid phase, surface tension, and others.
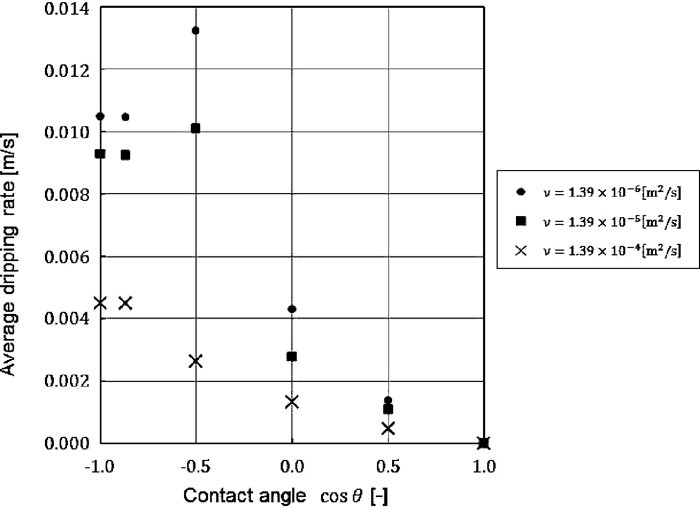
Effect of contact angle on average dripping rate.
In conventional research using cold experiments, the quantitative understanding of dripping behavior in a packed bed was inadequate, as it is difficult to measure the dripping rate in a certain region. However, using the model in the present research, the relationship between the dripping rate and the physical properties of the liquid was clarified. Based on these results, it is considered that slag displays sluggish dripping in comparison with molten iron, and in cases where wettability with the coke comprising the packed bed is good, the dripping rate is greatly reduced, the flow stagnates, and a rapid increase in static hold-up occurs. The results clarified the fact that the viscosity of the liquid and solid-liquid wettability has a large influence on dynamic and static holdup respectively. Permeability of gas and stability of blast furnace operation decreases with an increasing hold-up. From analysis, increasing viscosity of molten slag particularly will cause increasing hold-up in blast furnace. Controls of slag composition and temperature are important to suppress increasing hold-up.5,15) Fixed packed bed is employed in the present calculation. However packed bed structure descends with burden charging, tapping of molten pig iron, and combustion of cokes in the actual blast furnace. Influence of packed bed motion on liquid flow would increase with an increasing viscosity and wettability of liquid.
An analysis of the influence of the physical properties of a melt on liquid flow was carried out for a packed bed consisted of spheres using a model of a 3-dimensional liquid flow by the MPS method, which considered the physical properties of the melt such as wettability with the packed bed material. The following results were obtained from a model analysis under various kinematic viscosity coefficients and wettability conditions.
(1) In case of good wettability, the liquid flows across the surface of the solid, drips through a specific region, and passes through the packed bed. Under conditions of poor wettability, a tendency was observed in which the liquid descends in a dispersed manner, as though repelled by the packed bed particle surface, and the flow spreads in the horizontal direction. In the case of good wettability, the kinematic viscosity coefficient has a large influence on the time required for the liquid droplet to pass through the packed bed. On the other hand, when wettability is poor, the difference due the kinematic viscosity coefficient is small.
(2) Static hold-up and the dripping rate in the packed bed were calculated from the analysis results. The amount of static hold-up is remarkably affected by wettability, whereas, changes due to differences in the value of the kinematic viscosity coefficient are small. The average dripping rate, which is related to dynamic hold-up, varies greatly depending on the value of the kinematic viscosity coefficient, and the influence of wettability is comparatively slight. From these results, it can be concluded that the viscosity of the liquid is controlling for dynamic hold-up, while solid-liquid wettability is controlling for static hold-up.
A portion of this research was carried out with a research grant from the Steel Foundation for Environmental Protection Technology. The author wishes to acknowledge this support and express his sincere thanks to those concerned.