Abstract
In order to investigate the compactness degree of longitudinal section of the outer columnar grain zone in continuous casting billet, a Cellular Automaton-Finite Element coupling model was first developed. After validation, the solidification structures of billet under different conditions were simulated. The compactness degree of longitudinal section of billet is evaluated by the grain number in the same area. Because the widths of the columnar grain zone of billet under different conditions are different, the same zone was chosen for comparison and the zone was named as outer columnar grain zone. Thereafter, the compactness degree of longitudinal section of the outer columnar grain zone is found to be decreased with the increase of superheat, and increased slightly with the increase of casting speed, and decreased slightly with the increase of mould cooling intensity. Meanwhile, the corresponding compactness degree is increased with the increase of maximum nucleation density, and decreased with the increase of mean nucleation undercooling, and also decreased with the increase of dendrite growth velocity. Moreover, it is shown that the compactness degree of longitudinal section of the outer columnar grain zone in continuous casting billet is closely related to the average temperature gradient of the solidification process of the outer columnar grain zone, i.e., the former will be decreased when increasing the latter. This phenomenon can be probably attributed to two features that the established model has considered the preferential growth direction and new nucleation cores in the solidification front of the columnar grains.
1. Introduction
Solidification structure in continuous casting billet not only plays an important role in the formation of some defects (e.g., crack and macrosegregation), but also has a direct effect on the whole quality of the final steel products. 1,2,3,4,5) Experiment method and simulation method are two very important ways to investigate the solidification structure. Although many experimental works have been carried out in order to obtain the optimum solidification process of continuous casting, it is also very desirable to establish mathematical models to simulate the evolution of the solidification structure. The simulation methods can be divided into deterministic models and stochastic models, which have been developed rapidly over the last couple of decades.6) Cellular Automaton method is one of the stochastic models. Rappaz and Gandin,7,8) Nastac and Stefanescu9,10) are the earliest researchers engaged in the this field.6) Moreover, Rappaz and Gandin simulated the solidification structure and CET (columnar grain to equiaxed grain transition) of metals using the CAFE method (cellular automaton-finite element method) for the first time.7,8) Recently, the CA (cellular automaton) model has considered the effects of fluid flow on the solidification process.6) At present, there are a few models3,5,7,8) using the CA method for simulating the solidification structure of continuous casting steel, but there are few examples11) about investigating some special mechanisms of the solidification process of billet based on this method.
In Ref. 11), the compactness degree of central equiaxed grain zone in continuous casting billet has been specially investigated using the CAFE method, and the grain number was used to evaluate the compactness degree. That is to say, for the same area, high compactness degree means that the grain number is large. The compactness degree of central equiaxed grain zone has a significant effect on the quality of the central zone of billet.11) The compactness degree of longitudinal section in columnar grain zone of billet in the present work means that the longitudinal section perpendicular to the main growth direction of the columnar grain zone was chosen first, and the grain number in the same area of the longitudinal section was used to evaluate the compactness degree. The reasons why this way was used are that the ratio of the longest axis to the shortest axis of the columnar grain is too long to evaluate the compactness degree of transverse section of columnar grain zone easily. It should be noted that the 2-dimensional longitudinal sections were all obtained from the 3-dimensional calculation results by sectioning and the ratio of the longest axis to the shortest axis of the grain morphology in the longitudinal section is very close to 1. So the compactness degree of longitudinal section can be indirectly indicative of the primary dendrite arm spacing of the columnar grain zone in the 3-dimensional continuous casting billet. When the compactness degree of longitudinal section in columnar grain zone is greater, its primary dendrite arm spacing is larger. Therefore, the compactness degree of longitudinal section in columnar grain zone not only affects the formation process of some defects (e.g., crack) in billet surface and outer columnar grain zone,1,2,4) but also has indirect effects on the formation process of macrosegregation (interdendritic liquid flow)12,13) and the whole uniformity of billet. Based on the above analysis, it is very valuable to specially investigate the compactness degree of longitudinal section in columnar grain zone.
In this work, the solidification structure of continuous casting billet of high-carbon steel was first simulated. Then, the validated model was used to investigate the relevant mechanisms about the compactness degree of longitudinal section of the outer columnar grain zone under different conditions.
2. Model Descriptions and Validation
In the present work, the developed model and the validation are the same as those in Ref. 11). So the model includes nucleation model, dendrite tip growth kinetics and heat transfer calculation. Table 1 presents the composition of the high-carbon steel, which was produced by a curved caster (the radius is 9 m) with a billet size of 170 mm×170 mm.
Table 1.
Chemical compositions of high-carbon steel and relevant parameters.
| Composition |
C |
Si |
Mn |
P |
S |
| Mass fraction, % |
0.7 |
0.2 |
0.65 |
0.011 |
0.0023 |
| Partition coefficient, k019) |
0.35 |
0.52 |
0.75 |
0.06 |
0.025 |
| Liquidus slope, m19) |
–60 |
–8 |
–5 |
–34 |
–40 |
| Diffusivity in liquid, D,19) m2/s |
2.0×10⁻⁸ |
2.4×10⁻⁹ |
2.0×10⁻⁸ |
4.7×10⁻⁹ |
4.5×10⁻⁹ |
| Gibbs-Thomson, Γ,19) m·K |
1.9×10⁻⁷ |
1.9×10⁻⁷ |
1.9×10⁻⁷ |
1.9×10⁻⁷ |
1.9×10⁻⁷ |
Nucleation in the solidification process is generally divided into homogeneous nucleation and heterogeneous nucleation. In Ref. 14), the nucleation can be described by instantaneous model and continuous model. In the present work, continuous nucleation model was adopted.7,15) The continuous nucleation distribution function, dn / d(ΔT), is used to describe the change of nucleation density, dn, which is caused by the increase of the undercooling, d(ΔT). And this distribution function is expressed by Eq. (1).
|
dn
d(ΔT)
=
n
max
2π
⋅Δ
T
σ
exp[
-
1
2
(
ΔT-
ΔT
¯
Δ
T
σ
)
2
]
| (1) |
where
nmax is the maximum nucleation density which integrates from 0 to ∞ according to normal distribution when all the nucleation sites are activated;
ΔT
¯
is the mean undercooling, K; Δ
Tσ is the standard deviation, K. When
nmax,
ΔT
¯
, Δ
Tσ are given, the relationship between the nucleation density and undercooling can be determined.
2.2. Dendrite Tip Growth Kinetics
In casting, the growth kinetics of both columnar and equiaxed morphologies can be calculated by the dendrite tip growth kinetics, i.e., the KGT model.16,17) Based on the marginal stability criterion, Eq. (2) is obtained.
where
A=
π
2
Γ
P
2
D
2
B=
m
C
0
(1-
k
0
)
ξ
c
D[1-(1-
k
0
)Iv(P)]
,
C =
G,
V is the growth velocity of a dendrite tip. Γ is the Gibbs-Thomoson coefficient,
P is the Peclet number for solute diffusion,
D is the diffusion coefficient in the liquid.
m is the liquidus slope,
C0 is the initial concentration,
k0 is the partition coefficient,
Iv(
P) is the Ivantsov function,
ξ
c
=
π
2
k
0
P
and it close to unity at low growth velocity.
G is the temperature gradient. For the dendrite growth regime, the imposed temperature gradient,
G, has little effect on the growth velocity of a dendrite tip,
V, and can be regarded as zero.
Moreover, the undercooling at a dendrite tip, ΔT, is expressed by Eq. (3). The relationship between the undercooling, ΔT, and the growth velocity, V, can be calculated by substituting an arbitral value of the Peclet number into Eqs. (2) and (3).
|
ΔT=m
C
0
[
1-
1
1-(1-
k
0
)Iv(P)
]+
2Γ
r
| (3) |
where
r is the dendrite tip radius,
r = (2
D ·
P) /
V.
To accelerate the computation speed, the set of values for the undercooling and the growth velocity of the dendrite tip were calculated first by Eqs. (2) and (3), and then presented as the form of Eq. (4) using the least-square method.
|
V=
a
2
Δ
T
2
+
a
3
Δ
T
3
| (4) |
where
V is the growth velocity of the dendrite tip, m/s.
a2 and
a3 are the fitting coefficients.
In order to calculate the coefficients for the investigated steel which is composed of various different elements (as shown in Table 1), the Bobadilla, Lacaze and Lesoult approach18) was adopted. Therefore, a2 and a3 were determined as 0 and 1.356×10⁻⁵ m/(s·K3) using the ProCAST software, respectively, and the relevant parameters are listed in Table 1.
2.3. Heat Transfer Calculation during Continuous Casting
2.3.1. Governing Equations
Heat transfer calculation is based on the finite element method. Equation (5) shows the governing equation for twodimensional heat transfer calculation. Axial heat conduction in the casting direction was ignored.
|
∂T
∂t
=
λ
ρ
C
p
(
∂
2
T
∂
x
2
+
∂
2
T
∂
y
2
)
| (5) |
where
λ is the thermal conductivity,
ρ is the density,
Cp is the specific heat. The evolution of the latent heat during the solidification was incorporated into the calculation by using the effective specific heat method, as shown in
Eq. (6).
|
C
p
'
=
C
p
-L(
d
f
s
dT
)
| (6) |
where
C
p
'
is the effective specific heat,
L is the latent heat and
fs is the solid fraction.
2.3.2. Boundary Conditions
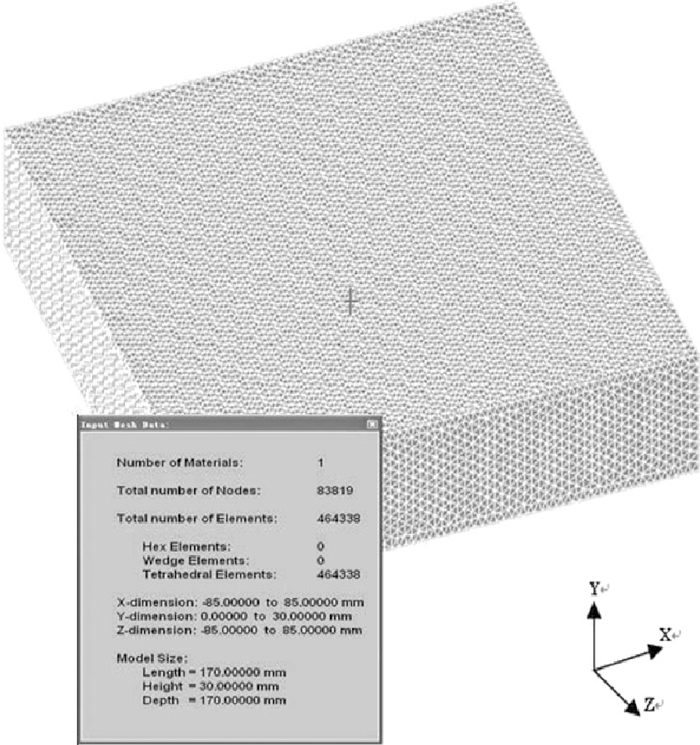
An unsteady heat transfer model based on the “slice moving method” was established to simulate the solidification of the billet, in which it was assumed that the slice moved down from the mould to the foot roller section, to the secondary cooling zone and finally to the air cooling zone. The section size of the slice was set as the same as the billet, i.e., 170 mm×170 mm and the thickness is 30 mm. By comprehensive consideration of calculation precision and calculation time, the computation domain was divided into 83819 nodes and 464338 elements, as shown in Fig. 1. The two surfaces perpendicular to the casting direction, i.e., Y direction (as shown in Fig. 1), were assumed to be adiabatic, and the solidification process of the continuous casting billet was simulated by changing the heat transfer conditions of other four surfaces of the slice with lapse of the time.
The lengths, the boundary conditions and the relevant formulas of mould, foot roller section, secondary cooling zone and air cooling zone are shown in Table 2. And when the superheat is 25°C, the casting speed is 1.8 m/min and the specific water ratio is 0.63 L/kg, the water amounts at different sections are shown in Table 2. However, the water amount will change in the case of changing the casting speed or intensive cooling. qm, qf, qk and qa are the heat flux of mould, foot roller section, secondary cooling zone and air cooling zone, respectively, kW/m2; t is the holding time in the mould, s; β is a coefficient about the shape of the mould and the parameter of casting, kW/(m2·s1/2); hf and hk are the heat transfer coefficient of foot roller section and secondary cooling zone, W/(m2·K); w is the water flow rate, L/(m2·min); ε is the radiation coefficient; σ is Stefan-Boltzmann constant, 5.67×10⁻⁸ W/(m2·K4); T, Tf, Tw, Ta are the temperature of the billet surface, the water of foot roller section, the water of secondary cooling zone, the environment of air cooling zone, respectively, K.
Table 2.
Parameters and relevant computational formulas at different sections.
| Section |
Length,
m |
Water
Amount,
m3/h |
Boundary
Condition |
Computational Formula |
| Mould |
0.9 |
135.00 |
qm |
q
m
=(2.68-β
t
)×
10
3
20,21)
|
Foot roller
section |
0.37 |
5.65 |
qf = hf (T – Tf) |
h
f
=480⋅
(
w
60
)
0.351
22) |
First section
of secondary
cooling zone |
2.6 |
4.20 |
qk = hk (T – Tw) |
hk = 200 + 10.44·w0.851 23) |
Second section
of secondary
cooling zone |
4.2 |
3.70 |
qk = hk (T – Tw) |
hk = 200 + 10.44·w0.851 23) |
Third section
of secondary
cooling zone |
2.2 |
1.15 |
qk = hk (T – Tw) |
hk = 200 + 10.44·w0.851 23) |
Air cooling
zone |
10 |
– |
qa = εσ (T4 – Ta4) |
ε = 0.8 21) |
The initial condition is given by Eq. (7):
|
T(x,y,z)
|
t=0
=
T
cast
| (7) |
where
Tcast is the casting temperature in the tundish, K.
2.4. Calculation Procedure
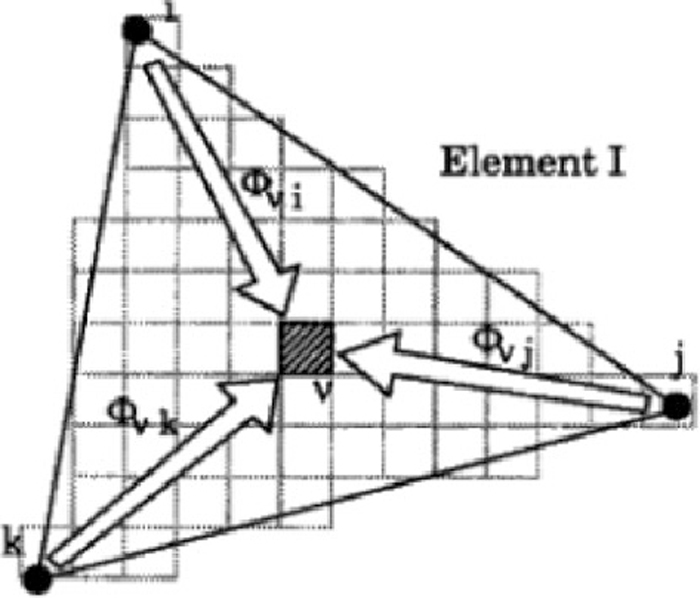
The flowchart of the simulation process is shown in Fig. 2. The three-dimensional grid model was first established by using PRO/E software, then the thermal field was calculated by ProCAST, and finally the solidification structure was simulated by the CAFE calculation. The CAFE model is one module of the ProCAST software. The FE mesh was used to calculate the heat transfer process and the CA cell (much smaller grid) was used to calculate the grain growth process. To predict simultaneously the microstructure development as a function of the thermal field and the influence of the latent heat release of the grains on the calculated thermal history, interpolation coefficients were defined between nodal points of FE mesh and CA cells in order to combine the FE and CA calculation in a single model, as shown in Fig. 3.8)
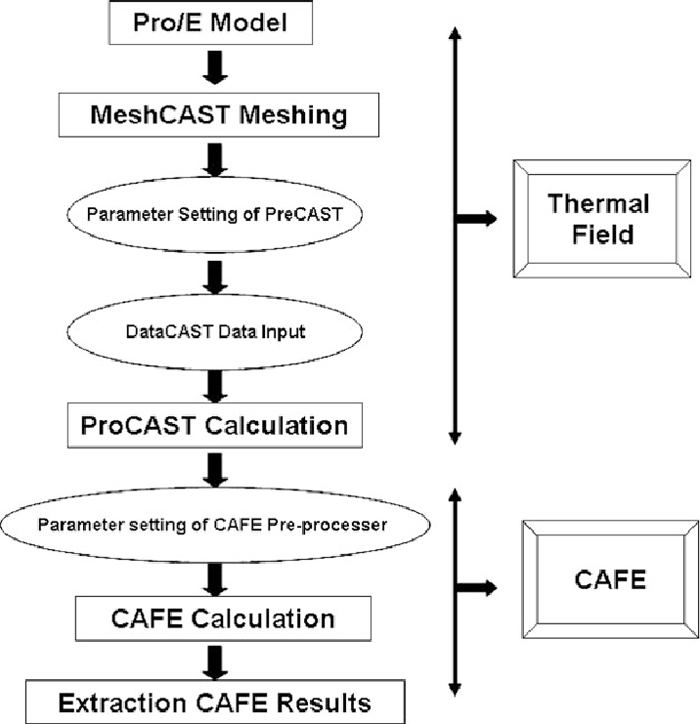
In Fig. 3, the CA cell, V, with its centre in finite element I, has non-zero interpolation coefficients ΦV, i, ΦV, j and ΦV, k with FE nodes i, j and k, respectively. New nucleation is formed in the bulk volume when the local temperature of nucleating cell is below the critical temperature in the given time step. Then nucleation model and dendrite tip growth kinetics are used for simulating the solidification structure based on the cellular automaton platform.7,8) Crystallographic orientation of crystal growth is randomly chosen from predefined orientation classes, and the crystallographic orientation <100> is selected preferentially.7)
2.5. Model Validation
The validation consists of two parts. The first one is a comparison of the calculated surface temperature and that measured by infrared radiation thermometer at five different locations of billet. The other part was performed by a comparison of the simulated solidification structures and the actual solidification structures under three different conditions, i.e., without MEMS (mould electromagnetic stirring), with MEMS and with MEMS plus intensive cooling. The width of equiaxed grain zone of billet was chosen for this comparison. Because the model validation in the present work is the same as that in author’s another paper,11) the relevant details aren’t described here again. By the comparison, the developed model here is proved to be effective for simulating the formation of solidification structure in the actual continuous casting billet.
3. Results
On the basis of the above validation, the compactness degrees of longitudinal section from the surface to the center of billet under different conditions were first compared, and then the outer columnar grain zone was presented specially. In order to get some more general conclusions, the solidification structure without MEMS was used as the benchmark for research. Figure 4(a) shows the simulated solidification structure of transverse section of billet. The relevant parameters are as follows: the superheat is 25°C, the casting speed is 1.8 m/min, the mould water amount is 135 m3/h, the maximum nucleation density is 2.0×10⁹ m–3, the mean undercooling is 2.5°C, the parameters in the dendrite growth model, a2 and a3, were determined as 0 and 1.356×10⁻⁵ m/(s·K3). For comparing and calculating easily, the studied region was selected as shown in Fig. 4(b). The position of the solidification structure in Fig. 4(a) can be found in Fig. 4(b) by the labels ABCD. The selected region in Fig. 4(b) was amplified in Fig. 4(c). As shown in Fig. 4(c), the longitudinal section is along the casting direction, and there are 86 sections obtained in the space of 1 mm for each selected region. The 2-dimensional longitudinal sections were all obtained from the 3-dimensional calculation results of the selected region by sectioning. The longitudinal sections labeled by (1), (2), (3), (4) and (5) are the sections from which to the surface of billet the distances are 0 mm, 10 mm, 30 mm, 50 mm and 80 mm, respectively. In order to reduce the calculating time, the size of longitudinal section was determined as 20 mm×5 mm (5 mm is the width of the longitudinal section along the casting direction). Figure 5 shows that the corresponding simulated solidification structures of these longitudinal sections. All the grains which are fully or partially within the section are taken in account. Because the difference of solidification condition between inner curve side and outer curve side, and the difference of solidification process along the casting direction were not only ignored in this model, but also the columnar grains in the selected region are well developed, the selected region and the relevant method are very effective for studying the compactness degree of columnar grain zone in continuous casting billet.
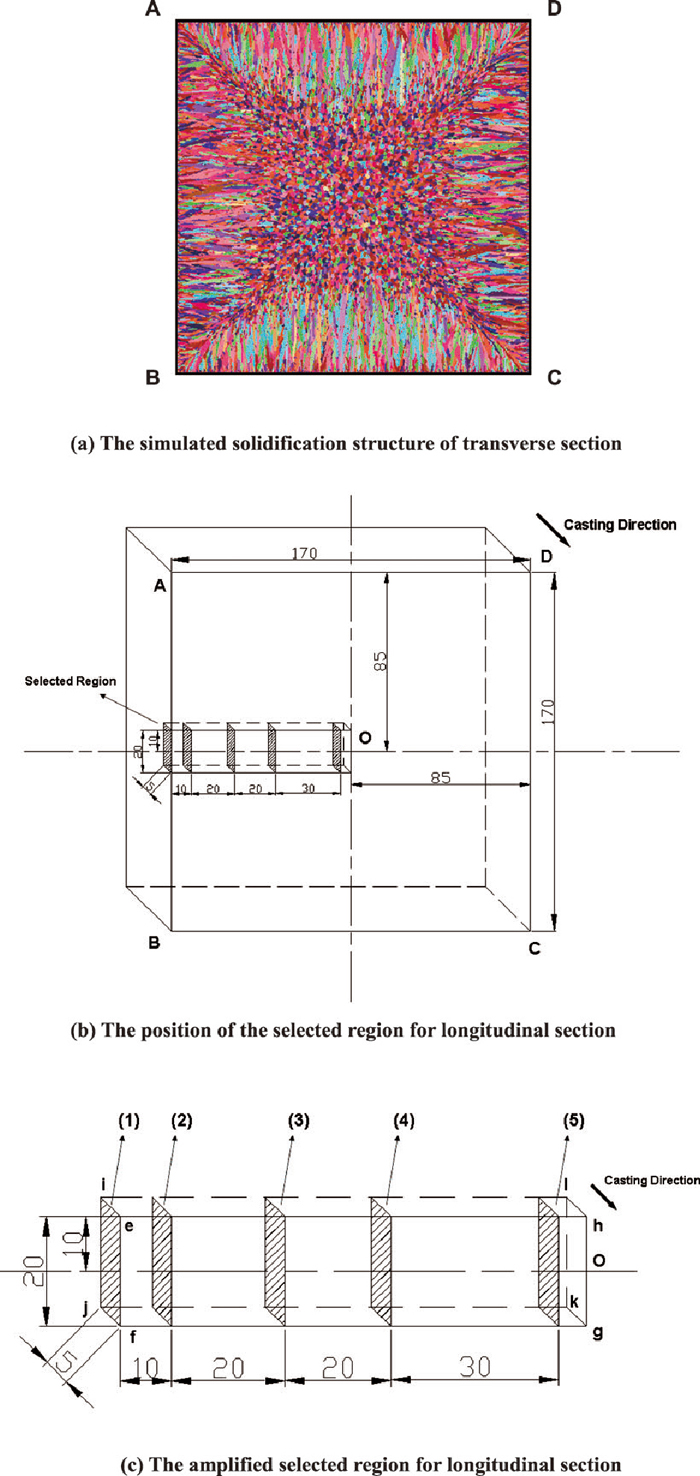
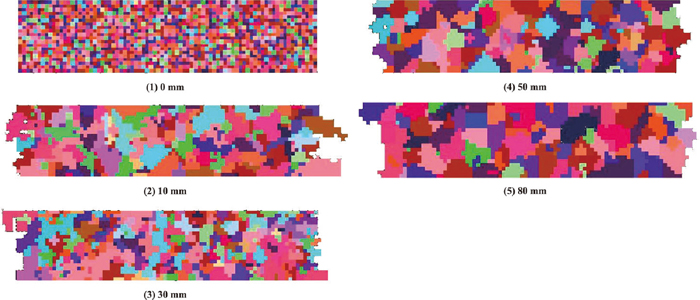
Figure 6(a) shows the grain numbers of longitudinal section at different locations of the selected region (the grain number was calculated by the ProCAST software), and Fig. 6(b) shows the corresponding simulated solidification structure of transverse section. From Fig. 6(a), the grain number in the chill zone is the greatest, then is decreased obviously with the process of solidifying, and begins to increase gradually after the number reaches a minimum, and the grain number begins to decrease again at the location from which to the surface of billet the distance is 35 mm. In addition, the grain numbers at different locations of central equiaxed grain zone of billet are nearly the same. Because the grains may have been nucleating and growing in the undercooling central zone of billet when the columnar grains are growing, the grain numbers in the central equiaxed grain zone are smaller. Figure 6(c) shows the greatest grain areas of longitudinal section at different locations of the selected region (the area was also calculated by the ProCAST software). From the figure, the greatest grain area in the chill zone of billet is the smallest, then is increased obviously with the process of solidifying, and begins to fluctuate gradually after the area reaches a maximum, and the grain number begins to decrease obviously until increase again. In the central equiaxed grain zone, the greatest grain areas are nearly the same. The trend of change has a corresponding relationship with that of the grain number. Although the number and the area always fluctuate from the surface to the centre of billet for the reason that the Cellular Automaton method is a stochastic method, the trends of change are presented obviously and clearly. The reason which induced the trends is that normal distribution continuous nucleation model was used in this model. If the temperature gradient in the solidification front of the columnar grain is low enough, new nucleation cores will be formed, and the growth of the columnar grain will be restricted by the growth of the new nucleation core. So, the greatest grain area begins to decrease after it reaches a maximum and the grain number begins to increase gradually after the number reaches a minimum in the columnar grain zone. In order to investigate easily, the location where the grain number begins to decrease obviously is considered as the boundary between the columnar gain and the equiaxed grain (the chill zone of billet is not taken into account). As to the solidification structure shown in Fig. 6(b), the distance from this boundary to the surface of billet is determined to be 35 mm based on Fig. 6(a). And this boundary is shown in Fig. 6(b) by the dotted line. That is to say, the widths of columnar grain zone and equiaxed grain zone are 35 and 50, respectively. For the reason that the surface nucleation parameters are the same and the cooling intensities in the chill zone are very large under different conditions, the grain numbers in the chill zone are almost the same under different conditions. Therefore, the compactness degree in the chill zone wasn’t investigated specially in the present work and the chill zone is considered to be part of the columnar grain zone of the billet.
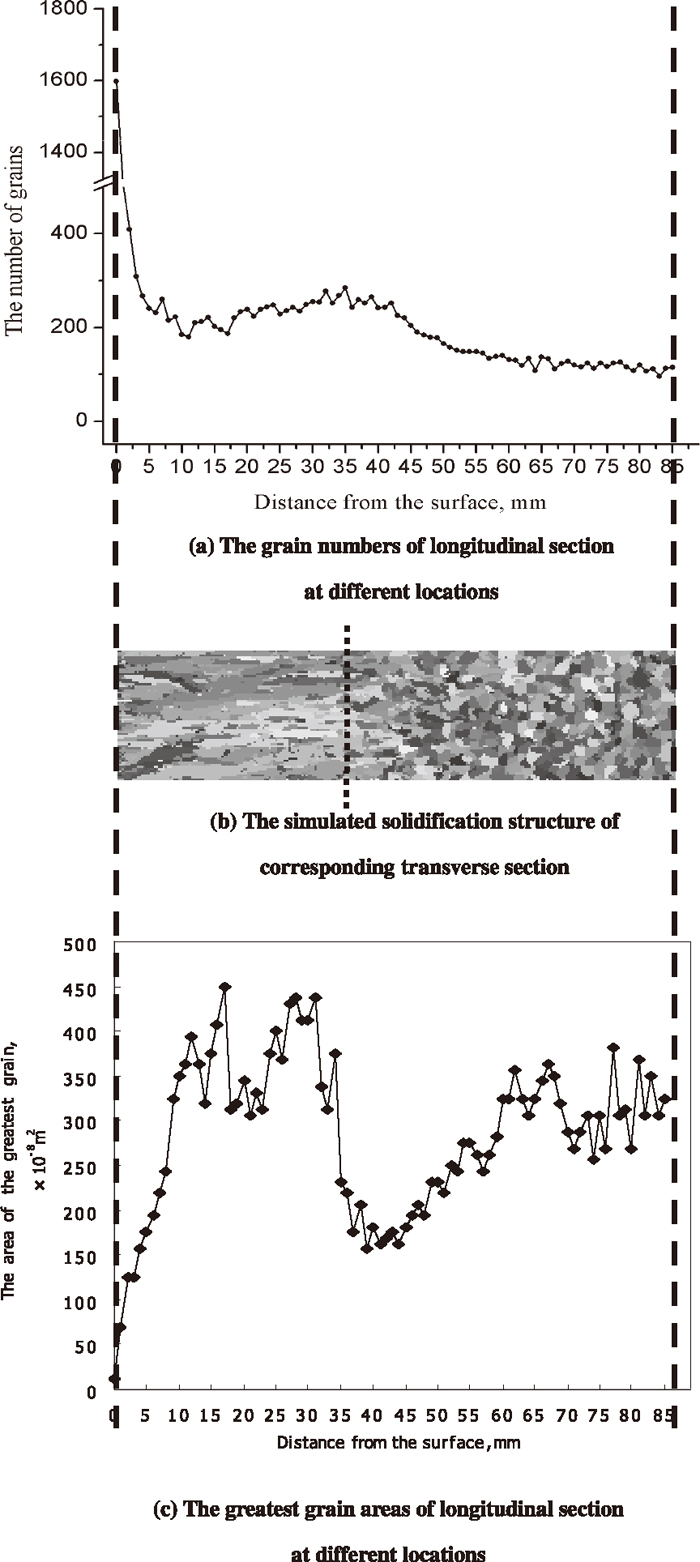
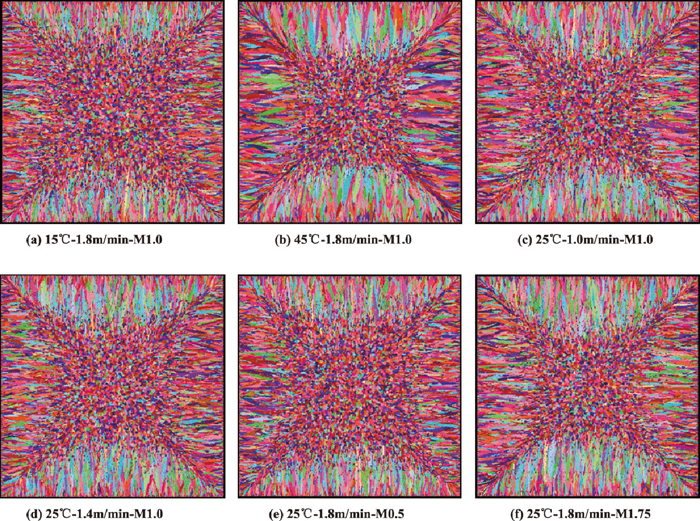
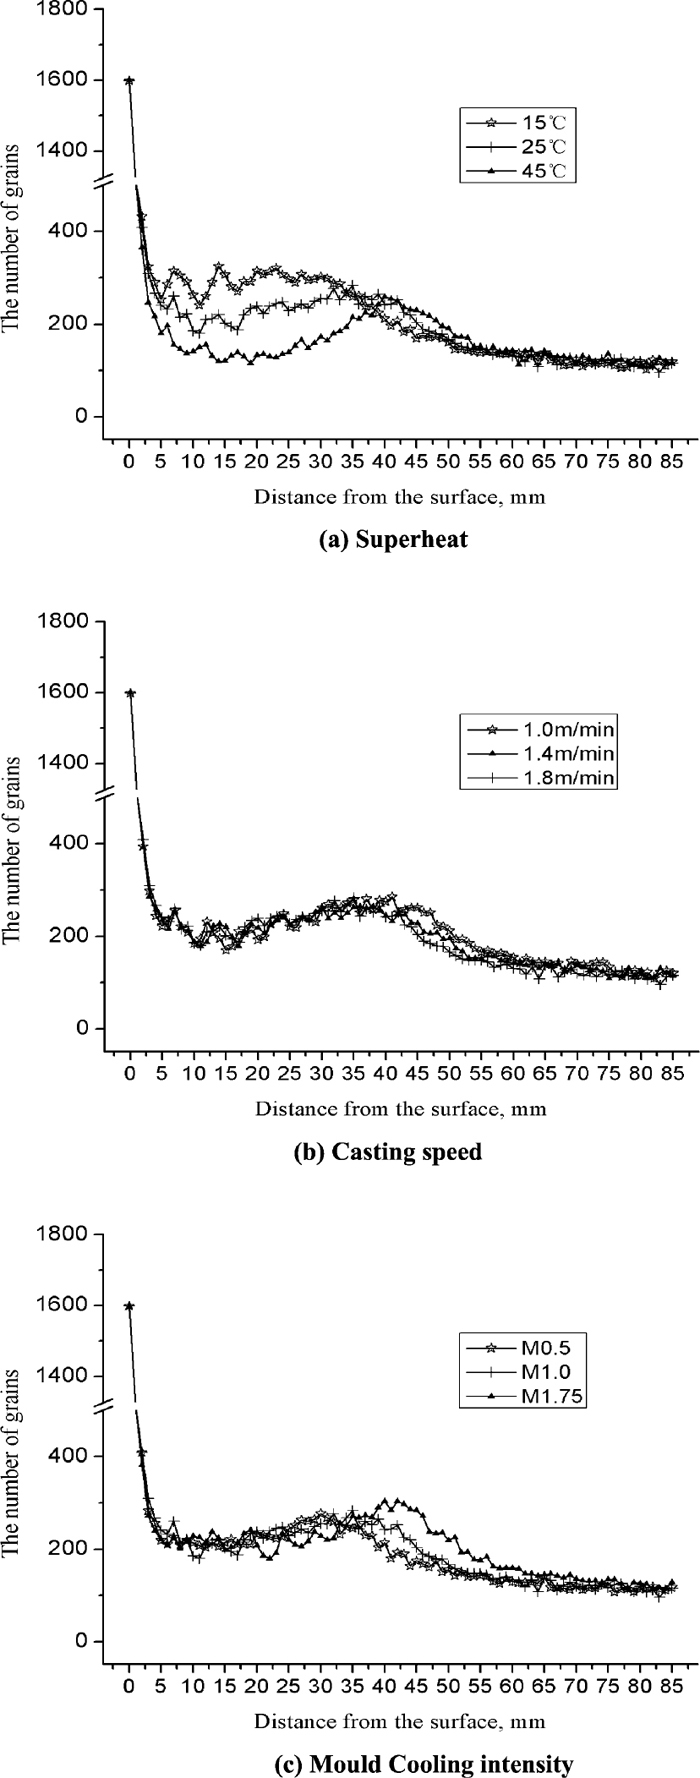
Figure 7 shows the grain numbers of longitudinal section at different locations under different superheats, different casting speeds and mould cooling intensities. Then, the compactness degrees under different conditions can be obtained from it. Under different casting speeds, the proportions of water mount at different sections in the secondary cooling zone and the specific water ratio are the same although the total water amounts were different. Different mould cooling intensities means that the mould water amounts were changed to 0.5 times and 1.75 times as large as the original amount (i.e., M0.5 and M1.75 means that the mould water amounts were changed to 67.5 m3/h and 236.25 m3/h, respectively). Meanwhile, the simulated solidification structure of transverse section under different superheats, different casting speeds and mould cooling intensities are shown in Fig. 8. The simulated solidification structure under 25°C (superheat), 1.8 m/min (casting speed) and the original mould water amount is shown in Fig. 4(a). From Figs. 4(a) and 8, it was found that the width of the columnar grain zone is increased with the increase of superheat, decreased with the increase of casting speed and increased with the increase of mould cooling intensity. This is only a qualitative conclusion. If the above criterion is used for determining the boundary between the columnar grain zone and the equiaxed grain zone, from Fig. 7, the widths of the columnar grain zone can be determined as 30 mm, 35 mm, 40 mm with the increase of superheat, also can be determined as 41 mm, 38 mm, 35 mm with the increase of casting speed and 30 mm, 35 mm, 42 mm with the increase of mould cooling intensity. Moreover, the compactness degree of longitudinal section in the columnar grain zone (i.e., the corresponding grain number) is decreased with the increase of superheat, but the differences of this compactness degree are not obvious under different casting speeds and mould cooling intensities. Maybe the average value should be taken for clear comparison.
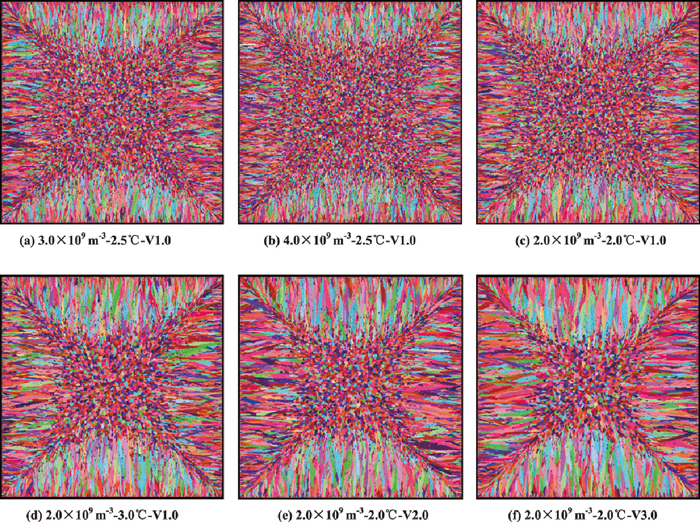
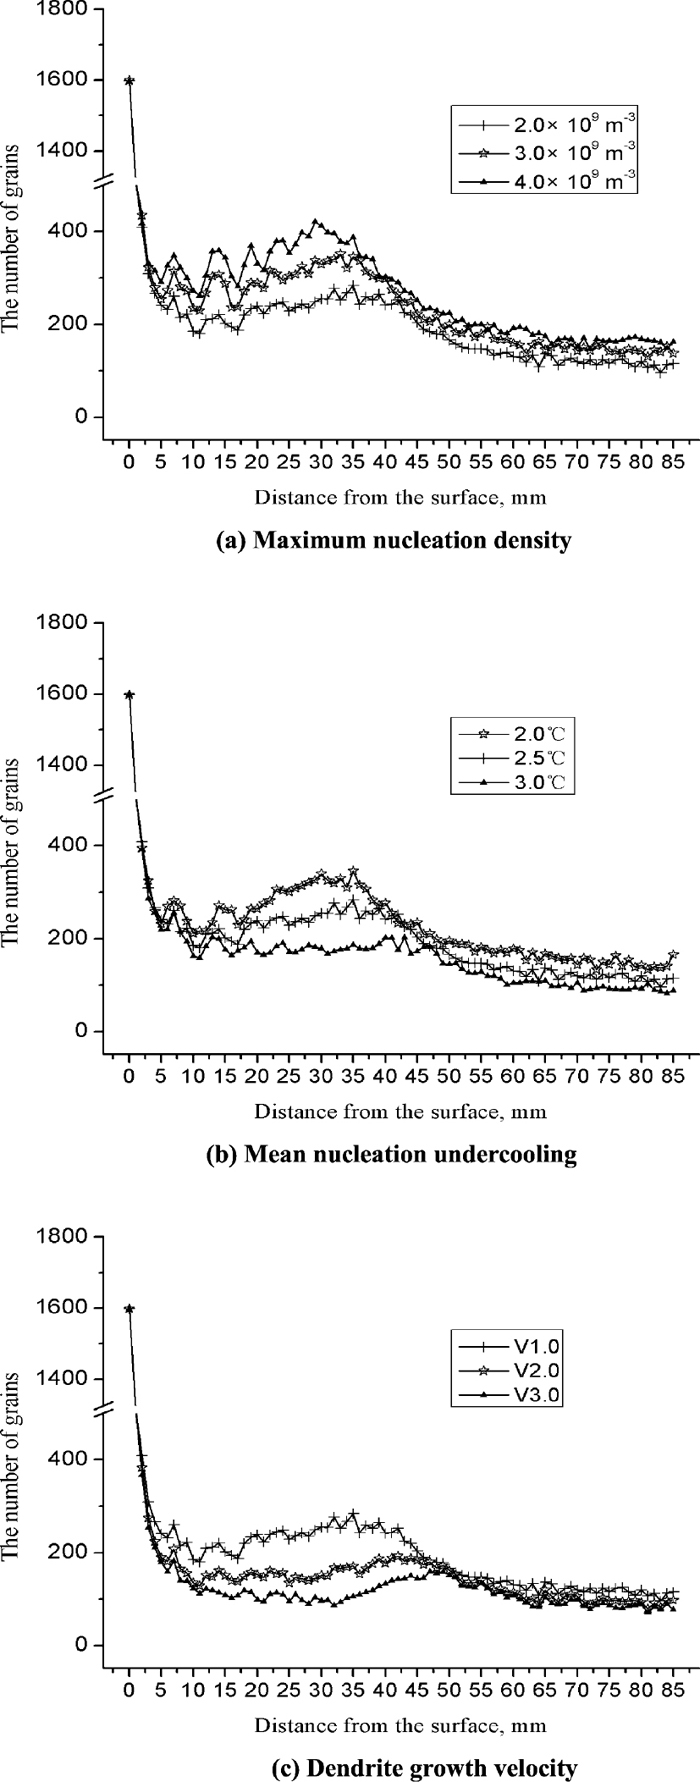
In order to investigate the compactness degree of longitudinal section comprehensively, the changes of compactness degree under different nucleation and growth conditions were calculated. Under different nucleation and growth conditions, the heat transfer conditions are the same. Figure 9 shows the grain numbers of longitudinal section at different locations under different maximum nucleation densities, different mean nucleation undercoolings and dendrite growth velocities. Meanwhile, the corresponding simulated solidification structures of transverse section under different conditions are shown in Fig. 10. It should be noted that V2.0 and V3.0 means that the dendrite growth velocity were changed to 2.0 times and 3.0 times as large as the original velocity (i.e., the values of a3 in Eq. (4) are determined as 2.712 and 4.068, respectively). The simulated solidification structure under 2.0×10⁹ m–3 (maximum nucleation density), 2.5°C (mean nucleation undercooling) and the original growth velocity is shown in Fig. 4(a). Using the same criterion above, from Fig. 9, it was found that the widths of the columnar grain zone can be determined as 35 mm, 33 mm, 29 mm with the increase of maximum nucleation density, also can be determined as 35 mm, 35 mm, 43 mm with the increase of mean nucleation undercooling and 35 mm, 42 mm, 51 mm with the increase of dendrite growth velocity. Moreover, the compactness degree of longitudinal section in the columnar grain zone is increased with the increase of maximum nucleation density, and is decreased with the increase of mean nucleation undercooling, and is decreased with the increase of dendrite growth velocity.
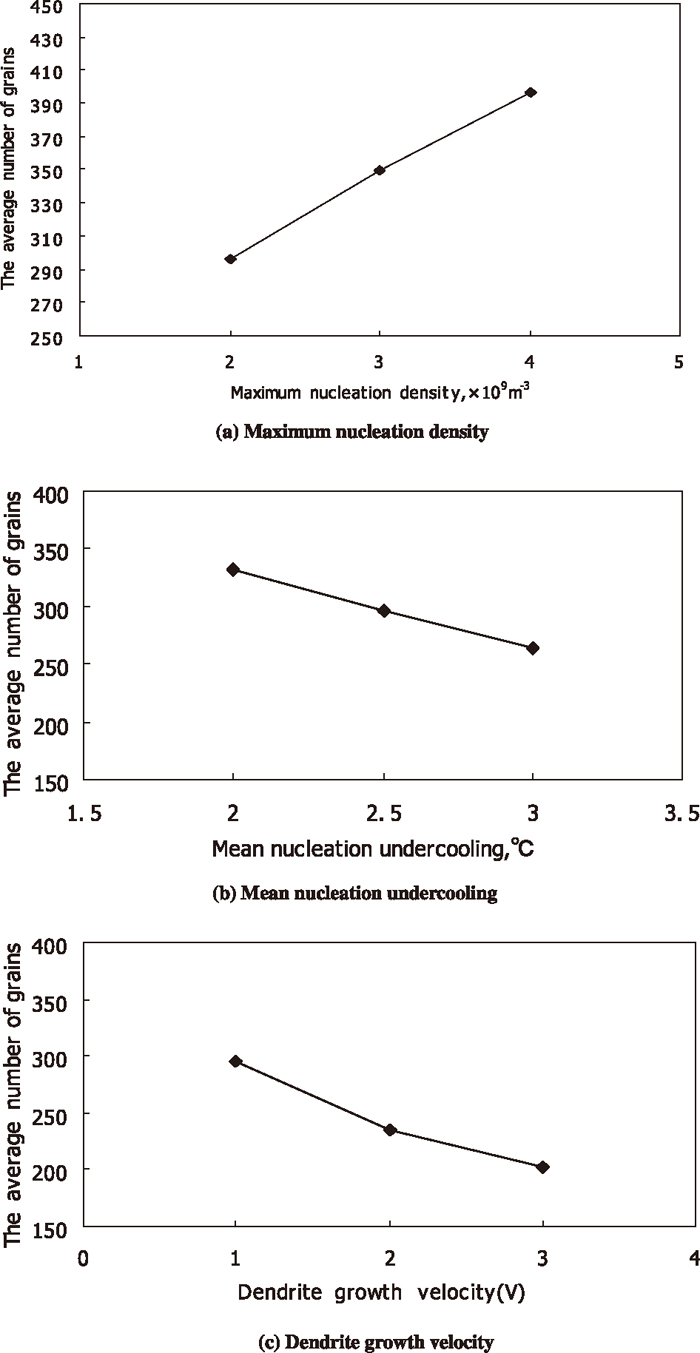
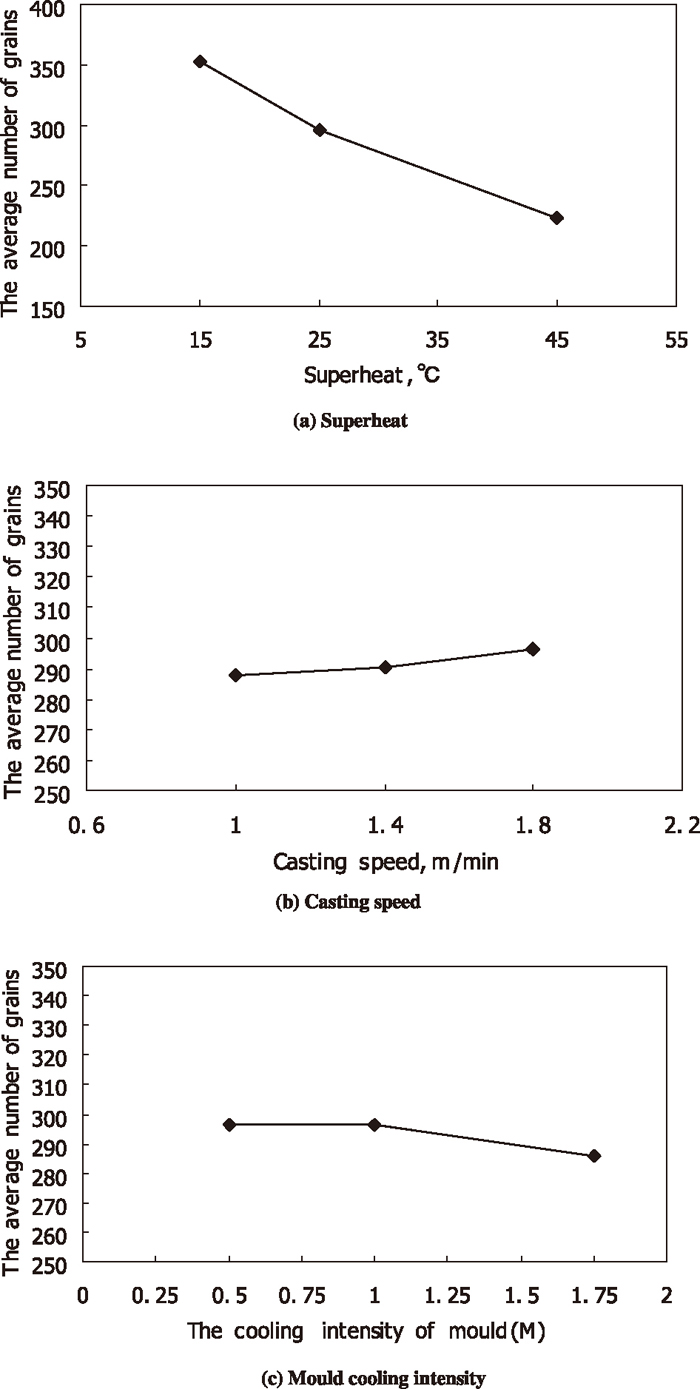
From the above comparison, the widths of columnar grain zone under different conditions are different and the minimum is 29 mm. Then the zone between the surface of billet and the locations, from which to the surface of billet the distance is 29 mm, was chosen as the same studied zone under different conditions in order to compare the compactness degree of longitudinal section in columnar grain zone effectively. And this zone was named as the outer columnar grain zone in the present work. Moreover, the average grain number of longitudinal section of the outer columnar grain zone was used to quantitatively compare the compactness degree of longitudinal section of the outer columnar grain zone. That is to say, larger the average grain number of longitudinal section of the outer columnar grain zone means greater the compactness degree of longitudinal section of the outer columnar grain zone. Figure 11 shows the average grain numbers of longitudinal section of the outer columnar grain zone under different superheats, different casting speeds and mould cooling intensities. And Fig. 12 shows the average grain numbers of longitudinal section of the outer columnar grain zone under different maximum nucleation densities, different mean nucleation undercoolings and dendrite growth velocities. By comparison, the compactness degree of longitudinal section of the outer columnar grain zone is decreased with the increase of superheat, and is increased slightly with the increase of casting speed, and is decreased slightly with the increase of mould cooling intensity. In addition, the compactness degree of longitudinal section of the outer columnar grain zone is increased with the increase of maximum nucleation density, and is decreased with the increase of mean nucleation undercooling, and is also decreased with the increase of dendrite growth velocity.
4. Discussion
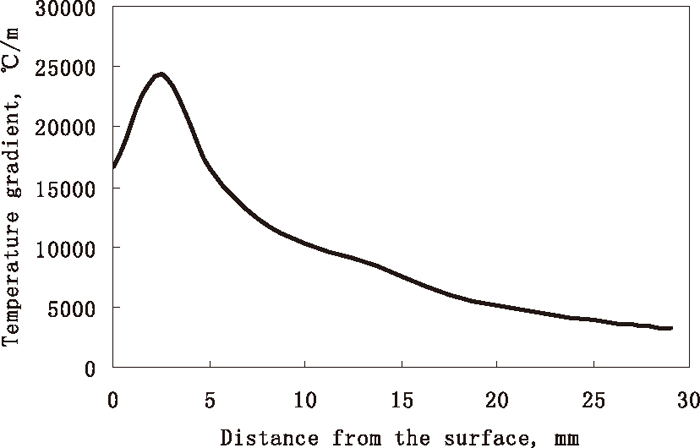
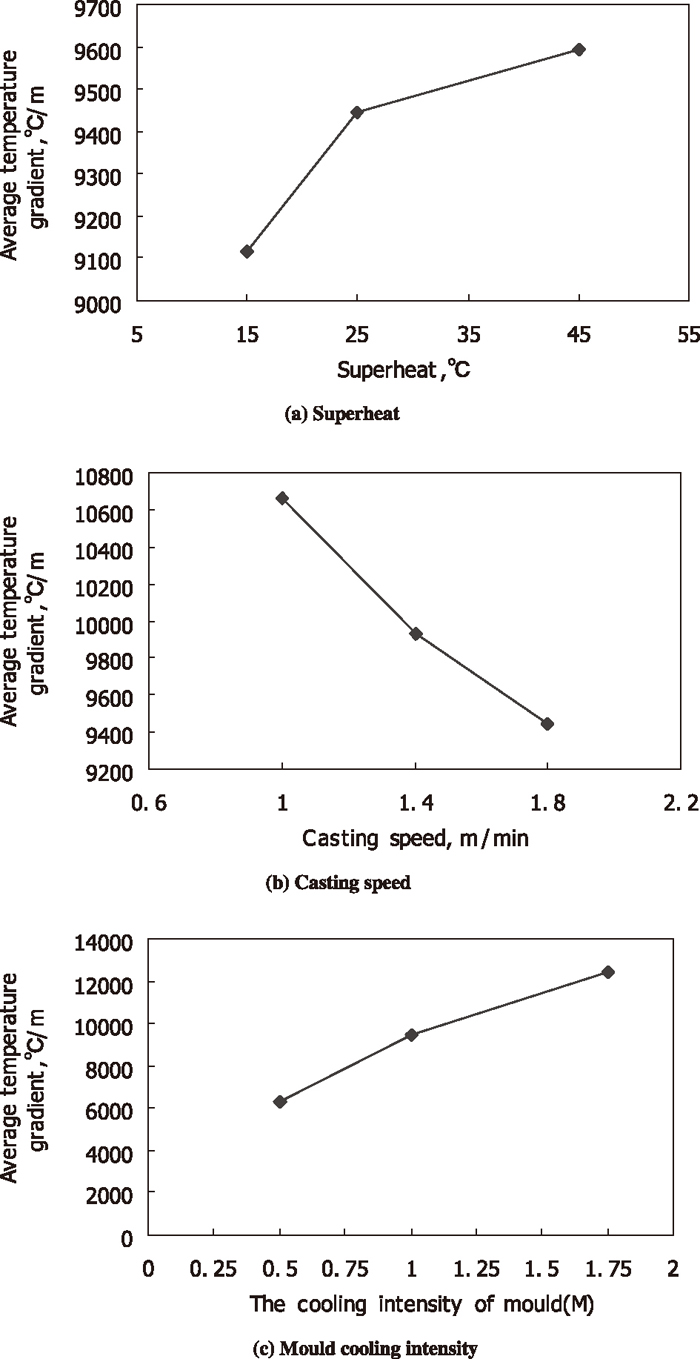
In order to know the mechanism behind the change of the longitudinal section compactness degree of the outer columnar grain zone under different superheats, different casting speeds and mould cooling intensities, the average temperature gradients during the solidification process (from the liquidus temperature to the solidus temperature) at different locations of the outer columnar grain zone were calculated. As to the solidification structure shown in Fig. 6(b), the corresponding average temperature gradients at different locations of the outer columnar grain zone were shown in Fig. 13. The value is increased first, and then decreased. In order to compare easily, the average temperature gradients at different locations under a certain condition were taken the average again, and the obtained value is named as the average temperature gradient of the solidification process of the outer columnar grain zone. Figure 14 shows the average temperature gradient of the solidification process of the outer columnar grain zone under different superheats, different casting speeds and mould cooling intensities. From it, this average value is increased with the increase of superheat, and is decreased with the increase of casting speed, and is increased with the increase of mould cooling intensity. These phenomena are because the average heat flux in the solidification front during the process from liquidus temperature to the solidus temperature is increased with the increase of superheat, and is decreased with the increase of casting speed, and is increased with the increase of mould cooling intensity. Moreover, there is some corresponding relationship between the average grain number of longitudinal section of the outer columnar grain zone and the average temperature gradient of the solidification process of the outer columnar grain zone. That is to say, when the latter is larger, the former is smaller. So, the latter may be the reason for the change of the former under different conditions. However, because the primary dendrite arm spacing can be considered to be greater if the average grain number is smaller (the corresponding compactness degree is smaller), the above conclusion is different from some findings by other researchers.24,25,26,27,28) According to these findings, there is an inverse relationship between temperature gradient and the primary dendrite arm spacing. A representative expression is shown in Eq. (8).25)
|
λ
1
=4.3
(
Δ
T
0
DΓ
k
)
1/4
V
-1/4
G
-1/2
| (8) |
where
λ1 is the primary dendrite arm spacing, Δ
T0 is the temperature difference between the liquidus temperature and the solidus temperature of initial composition,
D is the diffusion coefficient, Γ is the Gibbs-Thompson coefficient,
k is the partition coefficient,
V is the growth velocity,
G is the temperature gradient.
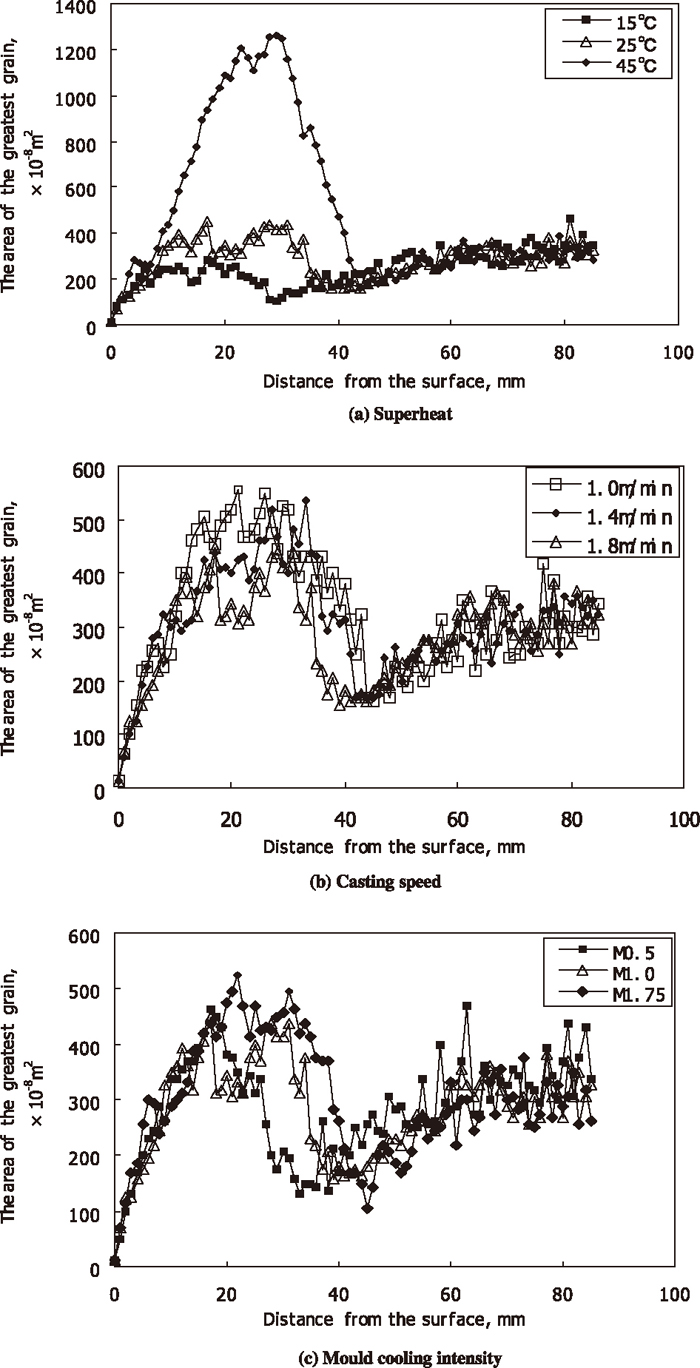
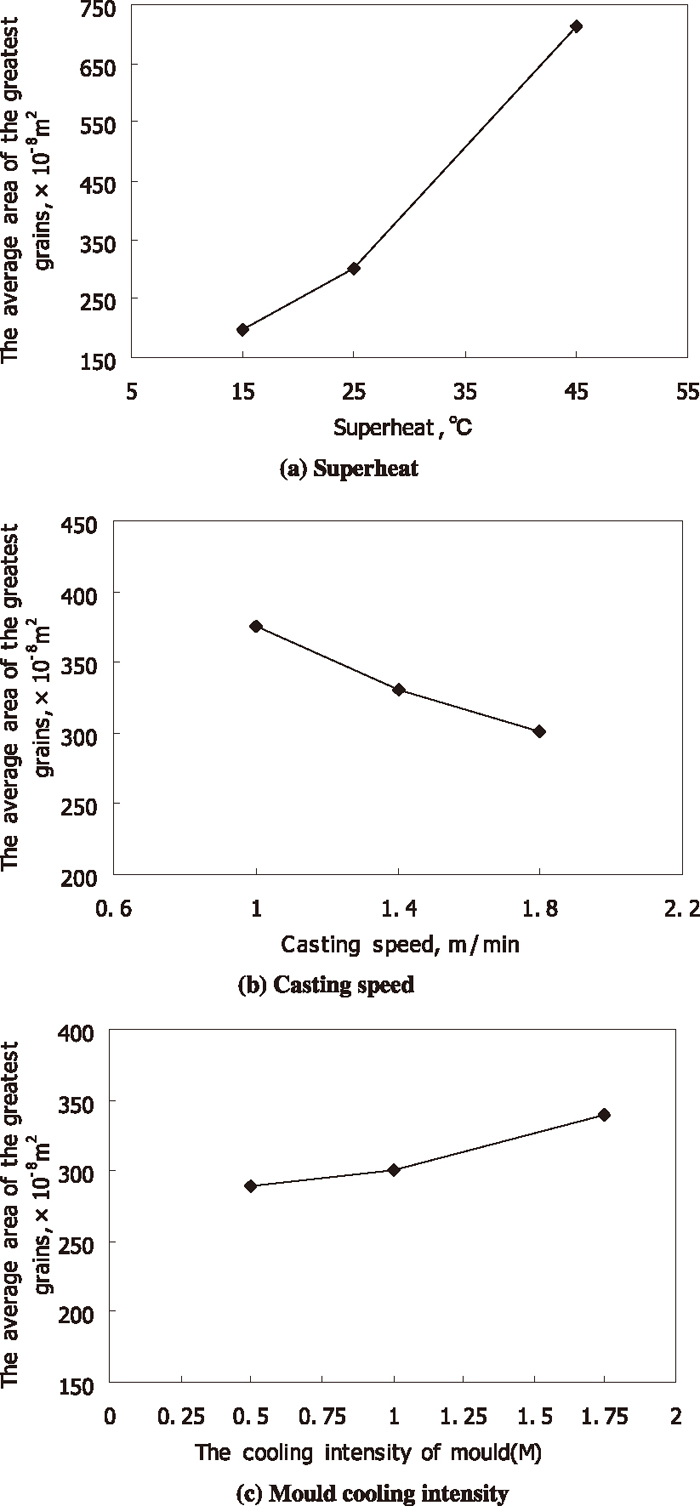
In order to verify and explain the above phenomenon, the greatest grain areas of longitudinal section at different locations under different conditions were first calculated (as shown in Fig. 15), and the average values of the greatest grain area of longitudinal section of the outer columnar grain zone were compared (as shown in Fig. 16). Although the difference of the area in Figs. 15(b) and 15(c) under different conditions isn’t very clear, the average value of the greatest grain area of longitudinal section of the outer columnar grain zone can reflect the trend of the change. From Fig. 16, the average value of the greatest grain area of the outer columnar grain zone is increased with the increase of superheat, and is decreased with the increase of casting speed, and is increased with the increase of mould cooling intensity. Because the greater the grain area, the smaller the grain number, this trend is in good agreement with the relationship between the relevant temperature gradient and the relevant grain number. That means this kind of relationship does exist.
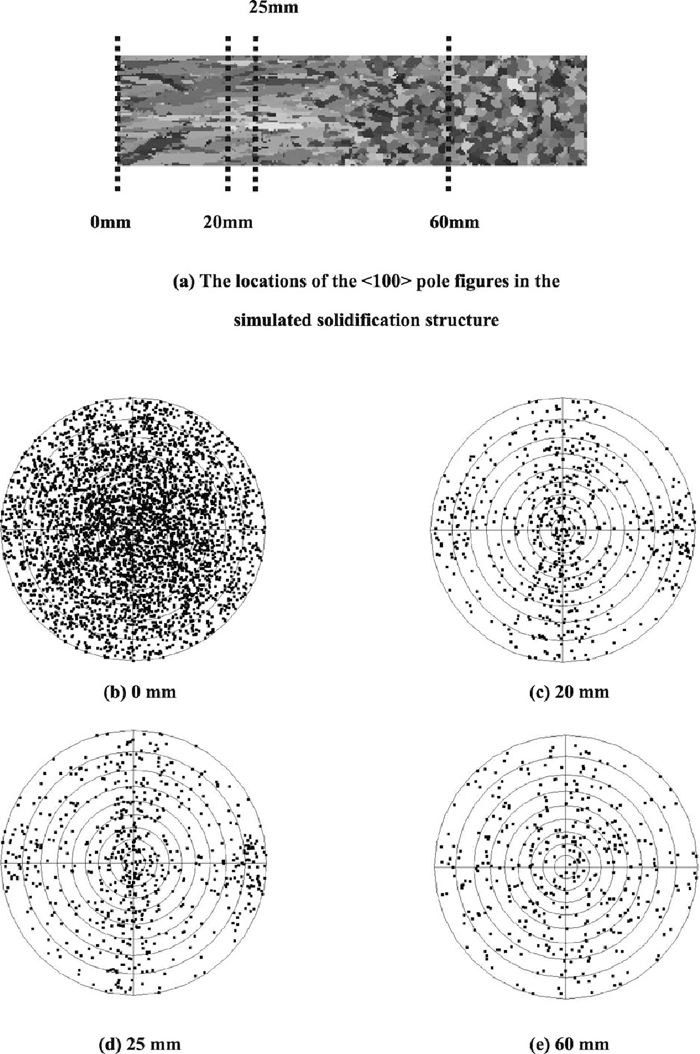
Moreover, the <100> pole figures at different locations of Fig. 6(b) were obtained by the ProCAST software, as shown in Fig. 17. As seen from the figure, the <100> points are almost randomly distributed in Fig. 17(b), which means that the crystallographic directions are random in the chill zone of billet.29,30) This feature was also found in the central equiaxed grain zone by analyzing Fig. 17(e). However, the pole figures in the columnar grain zone of billet are different from the previous pole figures. In Figs. 17(c) and 17(d), the <100> points are not randomly distributed, and these points are clustered in left, right, up, down and center parts (especially in the center part). So many of the grains at these locations have one of their <100> directions most closely aligned with the thermal gradient and it is the result of grain selection.29,30) In the present work, the preferential <100> growth directions of grains was accounted for simulating the solidification structure of continuous casting billet, and the assumption is reasonable for cubic metals.31) In addition, this assumption is the reason why the occurrence of the equiaxed-columnar transition between the chill zone and the columnar zone can be predicted by the CAFE method.7)
The grains having the preferential <100> growth directions of grains are easy to grow, but the poorly oriented grains can be eliminated easily. If the grain selection happens more frequently, there are more chances for grains having the preferential growth directions to grow. Figure 18 shows the <100> pole figures at different locations of the solidification structure under high dendrite growth velocity (V3.0), and the corresponding compactness degree is shown in Fig. 9(c).
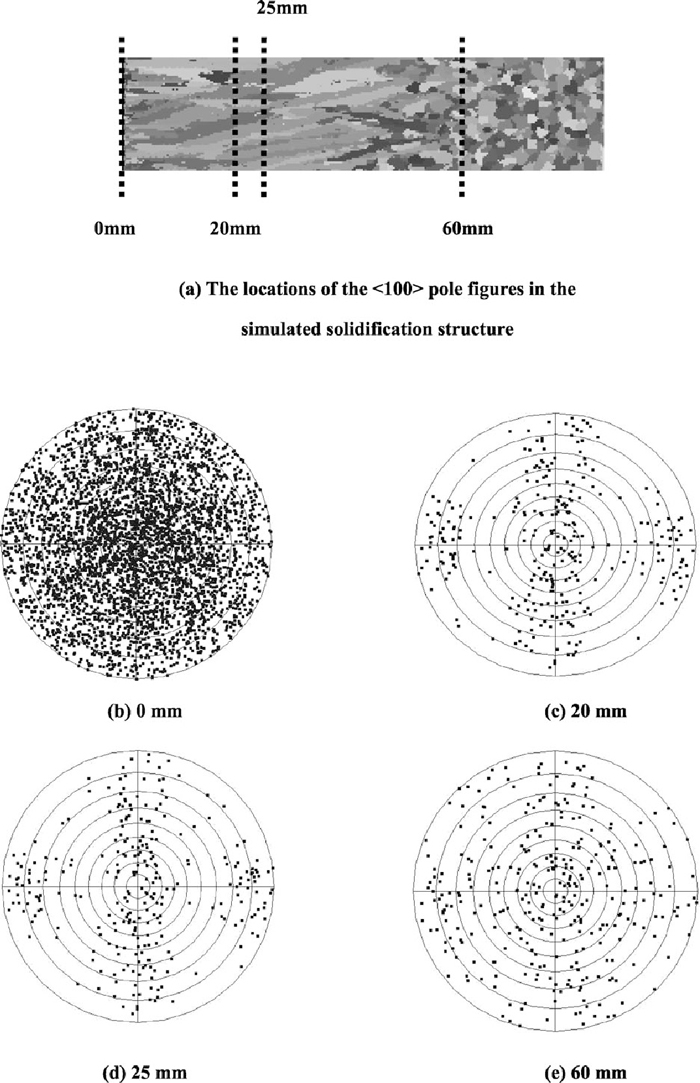
The <100> pole figures of the chill zone and the equiaxed grain zone in Fig. 18 are almost the same as those in Fig. 17. Nevertheless, the <100> points are clustered more obviously at different locations of the columnar grain zone by analyzing Figs. 18(c), 18(d), 17(c) and 17(d). That means the ratio of the grains having the preferential <100> growth directions in columnar grain zone at higher growth velocity is greater. Then, it can be derived that high dendrite growth velocity can make the grains having the preferential <100> growth directions get more chances to grow. Under different superheats, different casting speeds and mould cooling intensities, because the temperature gradient is increased with the increase of the heat flux in the solidification front during the process from liquidus temperature to solidus temperature, dendrite growth velocity during the solidification process can be probably increased when increasing the corresponding temperature gradient (especially when decreasing casting speed and increasing mould cooling intensity) according to Eq. (4). So, the existence of the preferential growth <100> directions may be one of the reasons that the average temperature gradient of the solidification process of the outer columnar grain zone can make the average grain number of longitudinal section of the outer columnar grain zone different.
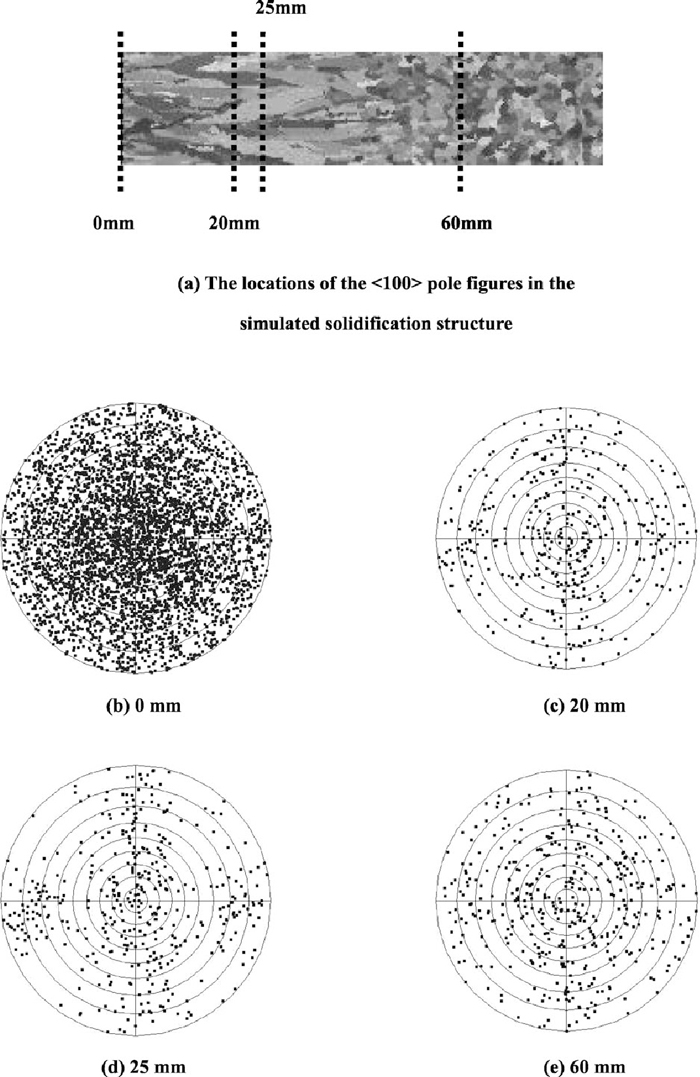
Figure 19 shows the <100> pole figures at different locations of the solidification structure under high superheat (45°C), and the corresponding compactness degree is shown in Fig. 7(a). There are some differences about the <100> points distribution of columnar grain zone between Figs. 17 and 19, especially between Figs. 17(d) and 19(d). That means high superheat can make the grains having the preferential <100> growth directions get more chances to grow. However, this difference is less than that between Figs. 17 and 18. Maybe there are some other more reasons for the differences of the compactness degree in Fig. 7(a) and the solidification structure morphology in Fig. 8 between high superheat and low superheat.
In addition, it has been found that the compactness degree of longitudinal section of the outer columnar grain zone is increased with the increase of maximum nucleation density, and is decreased with the increase of mean nucleation undercooling on the basis of Figs. 9(a) and 9(b). That is to say, the average grain number of longitudinal section of the outer columnar grain zone is increased when increasing the number of new nucleation cores in the solidification front of the grains during the solidification process. So the nucleation conditions can have an obvious effect on the compactness degree of longitudinal section of the outer columnar grain zone. Meanwhile, if the temperature gradient in the solidification front of outer columnar grain zone is increased, the undercooling volume in the solidification front will be decreased, and the number of new nucleation cores in the solidification front of the columnar grains during the solidification process will be decreased. Consequently, the change of the number of new nucleation cores in the solidification front of the grains may be another reason that the average temperature gradient of the solidification process of the outer columnar grain zone can make the average grain number of longitudinal section of the outer columnar grain zone different.
Based on the above discussion, the difference between the obtained results according to Eq. (8) and the findings of the present work can be probably attributed to two features that the established model has. The first one is the preferential growth <100> directions is accounted for simulating the solidification structure of continuous casting billet. During the solidification process of the outer columnar grain zone, especially the transition from equiaxed grain (in the chill zone) to columnar grain, the growth velocity is increased when increasing the relevant average temperature gradient, then the grains having the preferential <100> growth directions get more chances to grow for the reason that high dendrite growth velocity increases the extent of grain selection. The other one is that new nucleation cores can be formed in the solidification front of the columnar grains during the solidification process. The reason is that the normal distribution continuous nucleation model was used in the model. The number of new nucleation cores in the solidification front will be decreased when increasing the relevant average temperature gradient, then the average grain number of longitudinal section of the outer columnar grain zone will be decreased. So the change mechanism about the compactness degree of longitudinal section of the outer columnar grain zone in continuous casting billet may be different from that in net columnar grain zone where grains grow side by side and that of the central equiaxed grain zone in the billet.
5. Conclusions
(1) From the surface chill zone to the inside, the compactness degree of longitudinal section in continuous casting billet is obviously decreased first, and increased gradually after the grain number reaches a minimum, then decreased again until it don’t change any more basically.
(2) The compactness degree of longitudinal section of the outer columnar grain zone is decreased with the increase of superheat, and is increased slightly with the increase of casting speed, and is decreased slightly with the increase of mould cooling intensity.
(3) Meanwhile, the compactness degree of longitudinal section of the outer columnar grain zone is increased with the increase of maximum nucleation density, and is decreased with the increase of mean nucleation undercooling, and is also decreased with the increase of dendrite growth velocity.
(4) The compactness degree of longitudinal section of the outer columnar grain zone is closely related to the average temperature gradient of the solidification process of the outer columnar grain zone, i.e., the former will be decreased when increasing the latter. This mechanism can be probably attributed to two features that the established model has. The first one is the preferential growth <100> directions is accounted, and high dendrite growth velocity increases the extent of grain selection. The other one is that new nucleation cores can be formed in the solidification front of the columnar grains during the solidification process.
Acknowledgment
The authors would like to be grateful to the National Science Fund (No.50734008) and ESI group for providing the ProCAST software.
References
- 1) J. K. Brimacombe and K. Sorimachi: Metall. Trans. B, 8 (1977), 489.
- 2) E. Takeuchi and J. K. Brimacombe: Metall. Trans. B, 16 (1985), 605.
- 3) M. Yamazaki, Y. Natsume, H. Harada and K. Ohsasa: ISIJ Int., 46 (2006), 903.
- 4) C. Bernhard, J. Reiter and H. Presslinger: Metall. Mater. Trans. B, 39 (2008), 885.
- 5) G. Straffelini, L. Lutterotti, M. Tonolli and M. Lestani: ISIJ Int., 51 (2011), 1448.
- 6) J. A. Spittle: Int. Mater. Rev., 51 (2006), 247.
- 7) M. Rappaz and Ch. -A. Gandin: Acta Metall. Mater., 41 (1993), 345.
- 8) Ch.-A. Gandin and M. Rappaz: Acta Metall. Mater., 42 (1994), 2233.
- 9) L. Nastac and D. M. Stefanescu: Modell. Simul. Mater. Sci. Eng., 5 (1997), 391.
- 10) L. Nastac: Acta Mater., 47 (1999), 4253.
- 11) Z. Hou, F. Jiang and G. Cheng: ISIJ Int., 52 (2012), 1301.
- 12) M. C. Flemings: ISIJ Int., 40 (2000), 833.
- 13) G. Lesoult: Mater. Sci. Eng. A., 413-414 (2005), 19.
- 14) D. M. Stefanescu: ISIJ Int., 35 (1995), 637.
- 15) Ph. Thévoz, J. L. Desbiolles and M. Rappaz: Metall. Trans. A, 20 (1989), 311.
- 16) W. Kurz, B. Giovanola and R. Trivedi: Acta Metall., 34 (1986), 823.
- 17) W. Kurz and D. J. Fisher: Fundaments of solidification, 4th Rev. ed., Trans Tech Publishers, Aedermannsdorf, Switzerland, (1998), 77.
- 18) M. Bobadilla, J. Lacaze and G. Lesoult: J. Cryst. Growth, 89 (1988), 531.
- 19) C. Jing, X. Wang and M. Jiang: Steel Res. Int., 82 (2011), 1173.
- 20) I. V. Samarasekera and J.K. Brimacombe: Can. Metall. Q., 18 (1979), 251.
- 21) S. K. Choudhary and D. Mazumdar: Steel Res. Int., 66 (1995), 199.
- 22) K. Cai and J. Yang: J. Univ. Sci. Technol. Beijing, 6 (1989), 510.
- 23) K. J. Schwerdtfeger: The Making, Shaping and Treating of Steel, 11th ed., The AISE Steel Foundation, Pittsburgh, PA, (2003), 18.
- 24) J. D. Hunt: Solidification and Casting of Metals, The Met. Soc., London, (1979), 3.
- 25) W. Kurz and D. J. Fishe: Acta Metall., 29 (1981), 11.
- 26) R. Trivedi: Metall. Trans. A, 15 (1984), 977.
- 27) J. D. Hunt and S. -Z. Lu: Metall. Mater. Trans. A, 27 (1996), 611.
- 28) J. A. Dantzig and M. Rappaz: Solidification, EPFL Press, Lausanne, Switzerland, (2009), 323.
- 29) Ch. -A. Gandin, M. Rappaz, D. West and B.L. Asams: Metall. Mater. Trans. A, 26 (1995), 1543.
- 30) Ch. -A. Gandin, J. -L. Desbiolles, M. Rappaz and Ph. Thévoz: Metall. Mater. Trans. A, 30 (1996), 3153.
- 31) B. Chalmers: Principles of Solidification, John Wiley & Sons, New York, (1964), 117.