Regular Article
Hot Deformation and Dynamic Recrystallization of 17-4 PH Stainless Steel
2013 年 53 巻 4 号 p. 680-689
詳細
2013 年 53 巻 4 号 p. 680-689
The hot deformation behavior of a 17-4 PH stainless steel was investigated by compression tests. The typical single-peak dynamic recrystalization (DRX) behavior and also a transition state between single and multiple peak (cyclic) behaviors were seen in the resultant flow curves. The application of constitutive equations for determination of hot working constants was critically discussed. As a result, the deformation activation energy and the stress multiplier in the hyperbolic sine equation were determined as 337 kJ/mol and 0.011, respectively. The Zener-Hollomon parameter (Z) exponents for peak stress and peak strain based on the power relationships were determined as 0.18 and 0.11, respectively. The normalized critical stress and strain for initiation of DRX were respectively found to be 0.89 and 0.47. The prior austenite grain boundaries (PAGB) were revealed by electrolytic etching of the martensite in order to study the microstructure of hot deformed samples. Significant grain refinement occurred as a result of necklace DRX mechanism. The average dynamically recrystallized grain size was related to Z and peak stress by power equations with exponents of –0.25 and –1.24, respectively. A DRX map was developed to show the effect of deformation conditions on the occurrence of DRX and on the final grain size.
The properties of materials can be deduced from knowledge of their microstructure. The shape, size, distribution, and orientation of phases and imperfections are important microstructural features. Among them, imperfections such as grain boundaries, which determine the grain structure, are of special interest. Two independent studies on the factors influencing the mechanical properties of steels by Hall1) and on the brittle failure of steels by Petch2) resulted to development of the famous Hall-Petch relationship, which mathematically represents the grain size dependence of strength. It is well known that refining grain size is a method to increase the strength while maintaining the ductility properties.3)
Hot deformation processing of steels plays an important role in the industry for production of steels with required mechanical properties while maintaining the production costs as low as possible. The main idea is enhancing the properties of the material by processing not by alloying. Therefore, the parameters of the forming process must be carefully controlled to produce a fine microstructure with desired shape, size, distribution, and orientation of phases. Different strategies can be applied to refine the microstructure during and after hot deformation of steels, which are based on phenomena such as dynamic recrystallization (DRX), metadynamic recrystallization (MDRX), Static recrystallization (SRX), austenite pancaking, precipitation, and phase transformation.4)
During the course of hot deformation, grain refinement can be achieved by dynamic recrystallization.5,6) In some materials such as aluminum, the dynamic recovery (DRV) can balance work hardening, and a plateau is achieved. However, in many materials such as austenite phase in steels, the kinetics of DRV is low and the work hardening can not be balanced only by DRV. As a result, the dislocation density increases gradually by strain and eventually the recrystallization occurs during deformation. DRX is one of the most important softening mechanisms in hot deformation processing and has profound effects on the microstructure and grain size. Based on this importance, the present work is focused on the evolution of the microstructure of 17-4 PH stainless steel (AISI 630) during hot compression and its refinement by DRX.
17-4 PH is more common than any other type of precipitation hardening (PH) stainless steels. Its ability to develop high strength without the catastrophic loss of ductility and its superior corrosion resistance to other steels of similar strength, have made it very attractive to designers and engineers.7) Hot deformation processing such as forging for this steel is conducted in the temperature range of stability of austenite phase.8) Due to the low stacking fault energy of austenite in the 17-4 PH stainless steel, the major restoration process during hot deformation is dynamic recrystallization (DRX). In our literature survey, there was not found any information on DRX microstructures of this important engineering alloy. Also, it should be indicated that the reported works on grain refining of PH stainless steels are scant.9,10)
The chemical composition of the 17-4 PH stainless steel used in this study is shown in Table 1. Cylindrical samples with diameter of 5 mm and height of 10 mm were used as hot compression specimens, which had the Rastegaev design8) to hold glass powder as a lubricant material at the contact surface of anvils and specimen. A Baehr DIL-805 deformation dilatometer was used for hot compression test. Before this test, the specimen was austenitized at 1180°C for 10 min and cooled with the rate of 1.5°C/s to deformation temperature and held there for 5 min. The austenite grain size just after this step was D0 =105 µm (Fig. 1(a)). Afterwards, single-hit hot compression tests were carried out at temperatures of 950–1150°C with strain rates of 10–3–10 s–1 under true strain of about 0.9.
| C | Cr | Ni | Cu | Mn | Si | Nb | Mo | V | S | P |
|---|---|---|---|---|---|---|---|---|---|---|
| 0.03 | 15.14 | 4.53 | 3.4 | 0.6 | 0.54 | 0.25 | 0.19 | 0.05 | 0.02 | 0.02 |
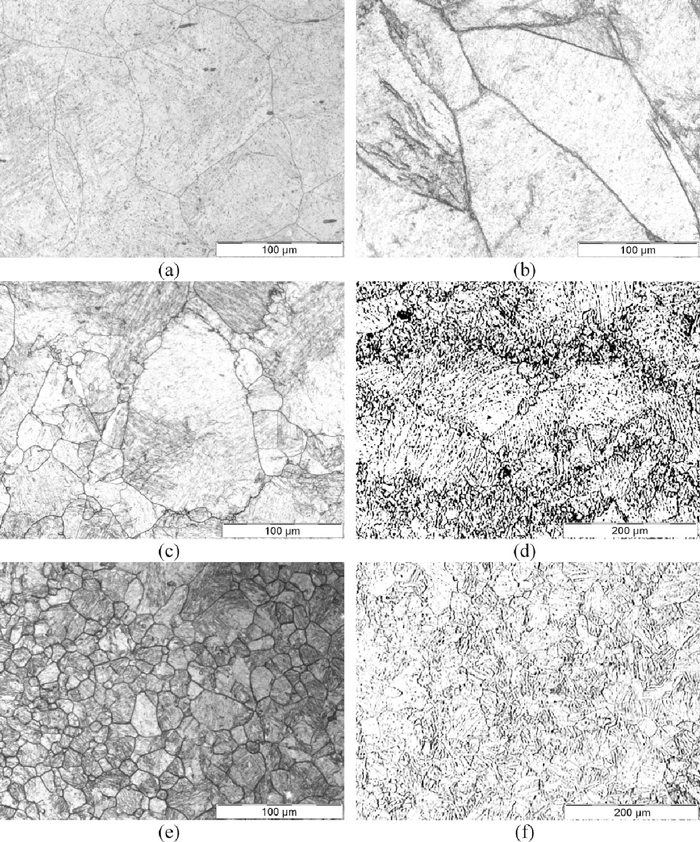
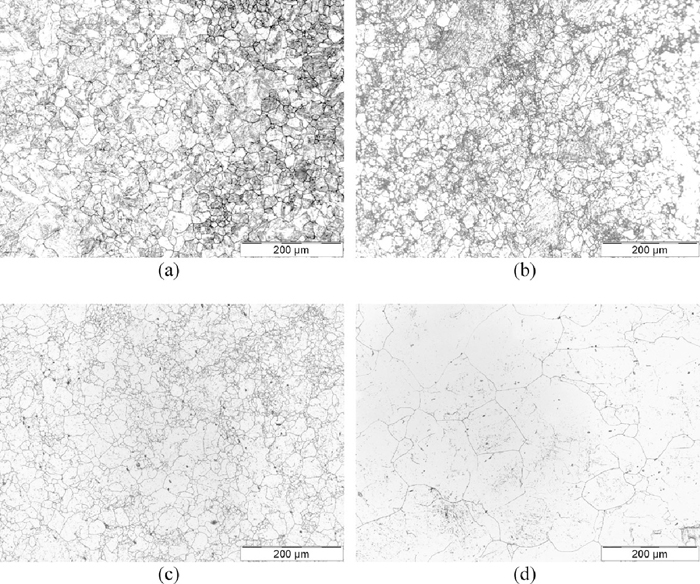
Optical micrographs of the 17-4 PH stainless steel: (a) initial microstructure, and deformed microstructures at (b) T=1000°C and
The microstructure of 17-4 PH stainless steel is essentially martensitic at room temperature.7,11,12) However, in order to characterize hot deformed samples, the prior austenite grain boundaries (PAGBs) should be revealed. The difficulty to reveal the PAGBs in steels is mainly due to the existence of martensite microstructure. The efficiency of techniques to reveal the PAGBs in steels depends significantly on the chemical composition, heat treatment, deformation condition, and other unknown factors.13,14,15,16) In the present work, two etching techniques were found to be able to reveal the PAGBs in 17-4 PH stainless steel. The first is the electrolytic etching in 60% HNO3,17) which has been originally developed for austenitic stainless steels, and the second is the hot supersaturated picric acid (superpicral),12,17) which is a general etchant for revealing the PAGBs. The details of the etching solutions and methods used are shown in Table 2. These etching techniques can be used to reveal the PAGBs in the annealed (Fig. 1(a)), work-hardened (Fig. 1(b)), partially-recrystallized (Figs. 1(c) and 1(d)), and completely recrystallized (Figs. 1(e) and 1(f)) samples. Since the results of the electrolytic etching are significantly better, this technique was used for subsequent microstructural analyses.
The microstructure of the 17-4 PH stainless steel used in this work is free of δ-ferrite stringers in the martensite matrix. This can be ascribed to the fact that the amounts of chromium and nickel are respectively near the minimum (15<wt% Cr<17.5) and maximum (3<wt% Ni<5) allowable values. The chemical composition of this alloy falls within that of the 15-5 PH stainless steel, which is a ferrite-free version of 17-4 PH stainless steel.
| Etchant | Composition | Details | Etch time (s) |
|---|---|---|---|
| Superpicral | 5–10 g picric acid + 100 ml ethanol + drops of HCl |
Temperature of the solution: 50–70°C |
5–20 |
| Electrolytic | 60% HNO3 solution | 1 volt, 316 SS electrode | 50–70 |
|
|
T | R0 | H0 | Rm | Hf | Rf | ΔHf | RT | ΔR | b | m |
|---|---|---|---|---|---|---|---|---|---|---|---|
| 0.001 | 1150 | 2.49 | 10.02 | 3.96 | 4.21 | 3.841423 | 5.81 | 3.592548 | 0.37 | 0.28 | 0.11 |
| 0.001 | 1000 | 2.48 | 10 | 3.98 | 4.15 | 3.849707 | 5.85 | 3.574902 | 0.41 | 0.30 | 0.13 |
| 0.1 | 1150 | 2.51 | 10.06 | 4 | 4.25 | 3.861697 | 5.81 | 3.569051 | 0.43 | 0.33 | 0.14 |
| 0.1 | 1100 | 2.49 | 10 | 3.98 | 4.24 | 3.823987 | 5.76 | 3.491108 | 0.49 | 0.38 | 0.16 |
| 1 | 1150 | 2.5 | 9.96 | 4.06 | 4.15 | 3.872983 | 5.81 | 3.468833 | 0.59 | 0.44 | 0.19 |
| 1 | 1100 | 2.51 | 10.04 | 4.1 | 4.15 | 3.90406 | 5.89 | 3.479233 | 0.62 | 0.45 | 0.20 |
| 0.1 | 1000 | 2.51 | 10.04 | 4.12 | 4.15 | 3.90406 | 5.89 | 3.431656 | 0.69 | 0.50 | 0.22 |
| 10 | 1150 | 2.49 | 10 | 4.05 | 4.26 | 3.815 | 5.74 | 3.295099 | 0.75 | 0.59 | 0.25 |
| 0.1 | 950 | 2.5 | 10.04 | 4.07 | 4.24 | 3.847016 | 5.80 | 3.356901 | 0.71 | 0.54 | 0.23 |
| 1 | 1000 | 2.51 | 10.02 | 4.08 | 4.25 | 3.854012 | 5.77 | 3.3567 | 0.72 | 0.55 | 0.24 |
| 1 | 950 | 2.5 | 10.06 | 4.13 | 4.15 | 3.892377 | 5.91 | 3.367196 | 0.76 | 0.55 | 0.25 |
| 10 | 1000 | 2.5 | 10.04 | 4.09 | 4.25 | 3.842487 | 5.79 | 3.292099 | 0.80 | 0.61 | 0.27 |
After removal of the elastic portion, each flow curve was corrected for friction and then was smoothed in order to eliminate the irregularities and fluctuations as described below.
The application of suitable lubricants in the hot compression test may significantly reduce friction, but the lubricants are unable to eliminate it completely. Therefore, the effect of friction should be considered in the raw stress data to form the friction-corrected data. Based on the upper-bound theory, a simple theoretical analysis of the barrel compression test for determination of the constant friction factor (m) has been proposed by Ebrahimi and Najafizadeh.18) The required expressions are shown below:
| (1) |
| (2) |
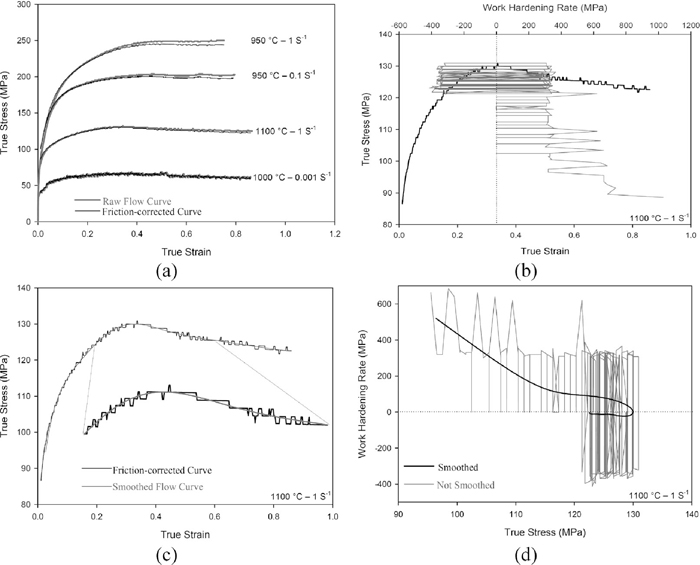
Preparation of flow curves: (a) the friction-corrected versus experimental flow curves, and for the deformation condition of T=1100°C and
The occurrence of DRX is traditionally identified from the presence of stress peaks in flow curves.19) However, not all materials display well-defined peaks when tested under hot working conditions. It has been shown by Ryan and McQueen20) and Poliak and Jonas21,22) that the onset of DRX can also be detected from inflections in plots of the strain hardening rate against stress. The derivative of the true stress with respect to true strain yields the work hardening rate, θ (Eq. (3)). Therefore, this technique requires the differentiation of the stress-strain curve, but short range noise in flow curves can render such differentiation calculus impossible (such as the one showed in Fig. 2(b)). In order to solve this problem, the flow stress data were smoothed in order to eliminate the irregularities and fluctuations in the experimental curves (Fig. 2(c)) and make them differentiable (Fig. 2(d)).22,23)
| (3) |
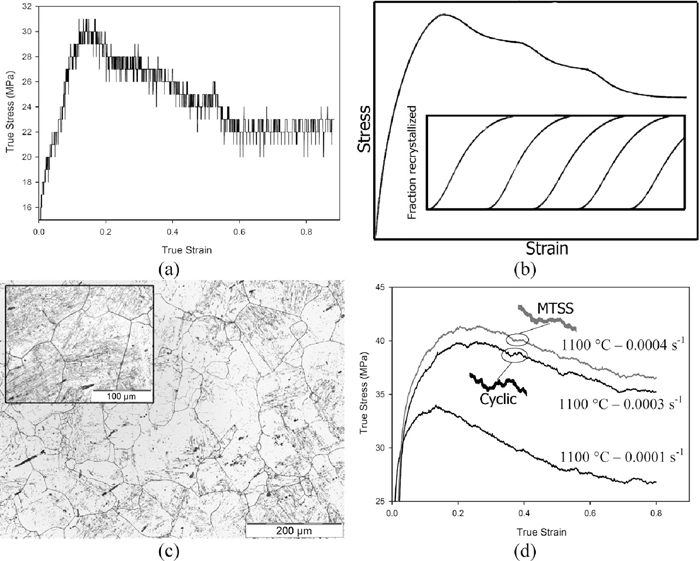
Flow curves at different deformation conditions are shown in Fig. 3. Most of the curves exhibit typical DRX behavior with a single peak stress followed by a gradual fall towards a steady state stress.24) However, the peak becomes less obvious when the strain rate increases or the deformation temperature decreases. In the single peak behavior, new cycles of DRX initiate before completion of the first cycle. Therefore, different grains will be at different stages of the DRX process at any point of time. The flow curve will represent the averaged flow stress of grains at different stages of recrystallization in the form of a single peak curve. In some cases, such as deformation condition of T=1000°C and
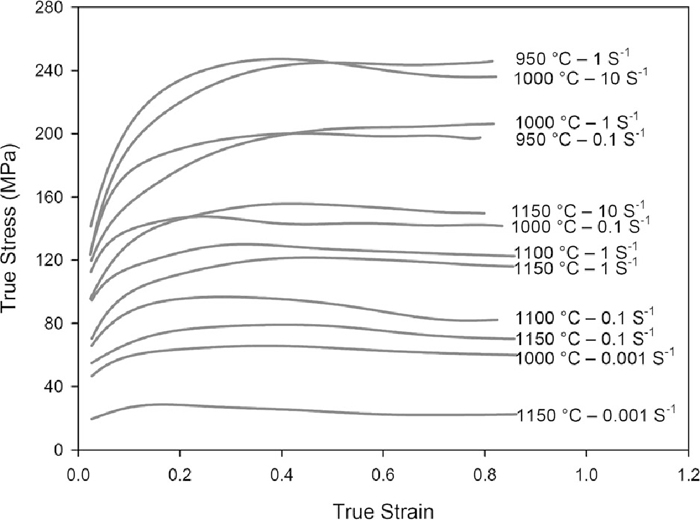
Flow curves at different deformation conditions.
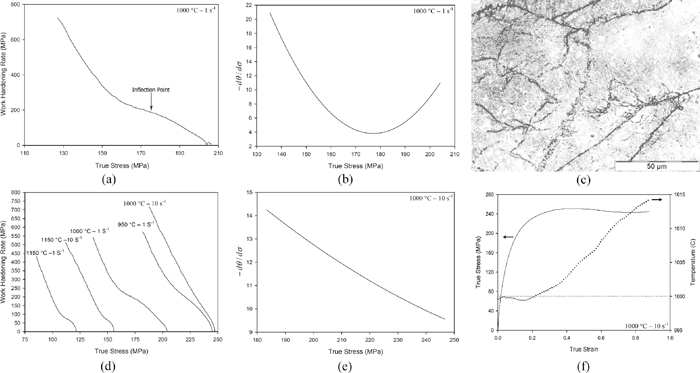
The comparison between two exceptional deformation conditions: (a) the θ–σ plot, (b) -dθ/dσ–σ plot, and (c) the hot deformed microstructure for T=1000°C and
At low stored energy, the nucleation of DRX is believed to begin at a critical strain,27) which corresponds to a critical dislocation density,28,29,30) and by the bulging of pre-existing grain boundaries.31,32) These may be the original grain boundaries, boundaries of dynamically recrystallized grains, or high angle boundaries created during straining (e.g. those associated with deformation bands or twins).33) This mechanism is often called strain-induced boundary migration (SIBM) and commonly used to explain the onset of DRX in polycrystals. However, at high stored energy, DRX begins by the growth of the high angle cell boundaries formed by dislocation accumulation.34,35,36) The difference in dislocation density in front of and behind the boundary is the driving force for the growth of the DRX nuclei.29,30,36)
In single peak DRX, such as the case of Figs. 1(c) and 1(d), nucleation occurs essentially along existing grain boundaries (necklace mechanism) and the growth of each grain is stopped by the concurrent deformation as a result of increasing the dislocation density of the new grains and reducing the driving force for their further growth.26,37) The DRX process continues until the completion of the first layer of necklace to cover the entire grain boundary. Afterwards, the subsequent layers form at the recrystallization front between the recrystallized and unrecrystallized portions. 26,32,33,34) If stress oscillations appear before reaching the steady state, then several recrystallization and grain growth cycles occur before the steady state strain, which tend to die out gradually, and the stress behavior is said to be of the cyclic or multiple peak type.38,39,40,41) In this case, the growth of grains is stopped by boundary impingement and not by concurrent deformation.24,42)
There is no evidence of classical multiple peaks in the flow curves of this work, even at very low strain rate of 0.001 s−1 and high temperature of 1150°C. Although the flow curve associated with this deformation conditions can be classified as single-peak, the close view of the original flow curve (Fig. 5(a)) shows that it is not the conventional single peak flow curve. Several plateaus (horizontal stress lines) followed by a decrease in flow stress after each plateau are detected beyond the peak point of its flow curve. Each plateau represents a transient steady state period (similar to a peak point), and the decrease in flow stress after each plateau may be attributed to the progress of a new DRX cycle. This condition may be considered as a transition state between single and multiple peak behaviors and it was called the multiple transient steady state (MTSS) behavior.8) As shown in Fig. 5(b), there may be an overlap between the end of a given cycle and the onset of the subsequent cycle of DRX. At the last stages of a cycle, the rate of recrystallization process is relatively low and the material work hardens under concurrent deformation. At the same time, the rate of the new DRX cycle increases and softening occurs. These simultaneous processes result to the appearance of several plateaus after the peak stress. The microstructures of this sample are shown in Fig. 5(c). The average prior austenite grain size was determined as about 81 µm. It is evident that there is no significant grain refinement in this case, which can be ascribed to the fact that this condition is a transition state between single and multiple peak behaviors and is related to a high temperature and low strain rate deformation condition. The latter reason will be discussed later. Figure 5(d) shows the flow curves resulted from the hot compression tests using an Instron type instrument for the same material under Zener-Hollomon parameters near that of the sample deformed under strain rate of 0.001 s–1 and temperature of 1150°C. As can be seen in this figure, the MTSS behavior has occurred again and lower Zener-Hollomon parameters can result in cyclic behavior. Therefore, these results signify the aforementioned assumption that the MTSS behavior is a transition state between single and multiple peak behaviors. Since the single peak and cyclic behaviors are respectively responsible for grain refinement and grain coarsening, this transition state (MTSS behavior) has practical importance.
DRX behavior of the sample deformed at T=1150°C and
The drop in flow stress of Fig. 3 with deformation temperature may be attributed to the increase in the rate of restoration processes and decrease in the strain hardening rate. Since the formation of DRX nuclei becomes easier at higher deformation temperatures, the critical strain for initiation of DRX decreases. Moreover, the mobility of grain boundaries increases with increasing deformation temperature and hence the rate of DRX increases. Therefore, both the peak and steady state strains decrease with deformation temperature.43)
The increase in the flow stress with strain rate can be ascribed to the decrease in the rate of restoration processes and increase in strain hardening rate.43) The rate of DRV also decreases with increasing strain rates. Since well-developed substructures by occurrence of DRV are observed in DRX microstructures and are the origin of DRX nuclei,28,34,44,45) the increase in the critical strain for initiation of DRX with increasing strain rate is reasonable. The mobility of grain boundaries decreases with increasing strain rate, which in turn increases the peak and steady state strains.
3.2. Constitutive AnalysesIt was shown by Sellars and Tegart,46,47) using the hyperbolic sine function suggested by Garofalo,48) that hot working can be considered as a thermally-activated process and it can be described by strain rate equations similar to those employed in creep studies. Based on these works, the Zener- Hollomon parameter (Z),49) which is the temperaturecompensated strain rate, can be related to the flow stress in different ways (Eq. (4)): The power law at relatively low stresses, exponential law at high stresses, and hyperbolic sine law for a wide range of deformation conditions:
| (4) |
| (5) |
By partial differentiation of these expressions at constant temperature, equations of
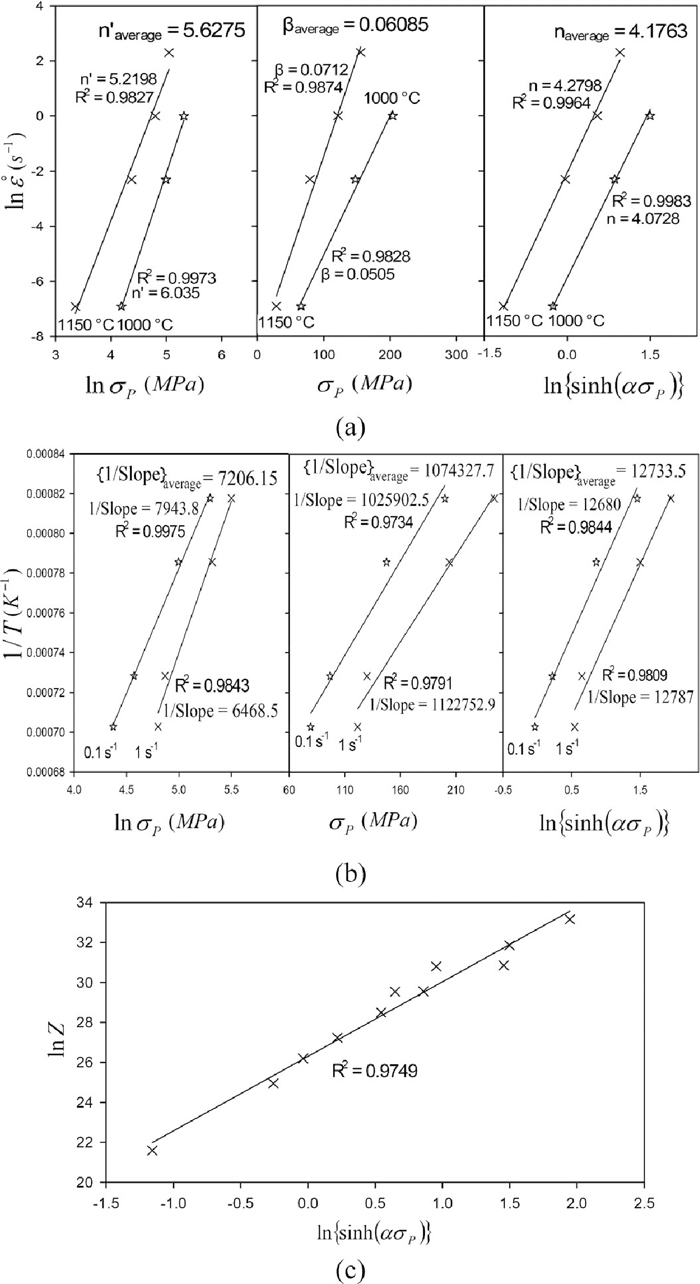
Constitutive analyses: (a) plots for calculation of hot working constants, (b) plots for calculation of deformation activation energy, (c) the hyperbolic sine plot for the peak stress.
By partial differentiation of the expressions shown in Eq. (5) at constant strain rate, the following expressions can be determined:
| (6) |
It is apparent that a greater dependence of flow stress on deformation temperature will result in greater value of deformation activation energy. It follows from these expressions that the slope of the plots of (1) ln
The value of 337 kJ/mol for deformation activation energy deviates from the self diffusion activation energy in austenite, which is about 280 kJ/mol.52) Although the hot working activation energy depends on the material being considered, it is usually referred to as apparent value, because no account is generally taken of the internal microstructural state and it is only derived from plots generated by experimental data and the assumption that the microstructure remains constant.
The value of 337 kJ/mol was used to calculate the Z parameter. According to Eq. (5), plots of lnZ against ln {sinh(ασP)} can be used for obtaining the appropriate values of n and A (Fig. 6(c)). These analyses resulted to the following constitutive equation:
| (7) |
This equation can be easily used to find the values of peak stress for a wide range of deformation conditions.
3.3. Characteristic Points of DRX Flow CurvesThe onset of DRX was detected from the inflections in plots of the θ versus σ or from the minimum in plots of –dθ/dσ versus σ (before the peak stress for both type of curves).22) The latter curves were used to detect the critical stress for initiation of DRX (σC). Moreover, the peak (σP) and steady-state (σS) stresses, peak (εP) and steady-state (εS) strains, and the critical strain for the onset of DRX (εC) were detected from the θ–σ curves, θ–ε curves, and inflection points in θ–ε plots, respectively. Figure 7 shows the method used for determination of characteristic points of flow curves by using the work hardening rate. For example, the exact values of peak stress and strain were determined at the first occurrence of θ = 0 in the θ–σ and θ–ε curves, respectively. The characteristic points of flow curves were plotted versus Z in Fig. 8. Regression analysis of these curves and afterwards consideration of Z/A dimensionless parameter resulted in the following expressions:
| (8) |
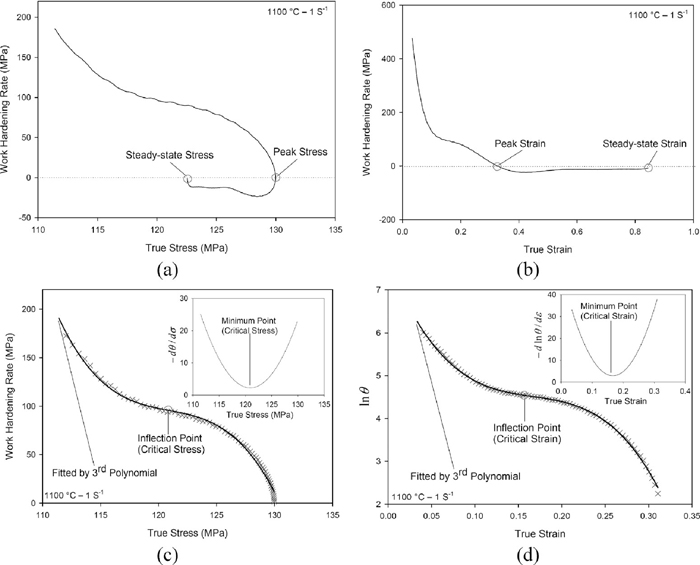
Methods used for determination of characteristic points of flow curves.
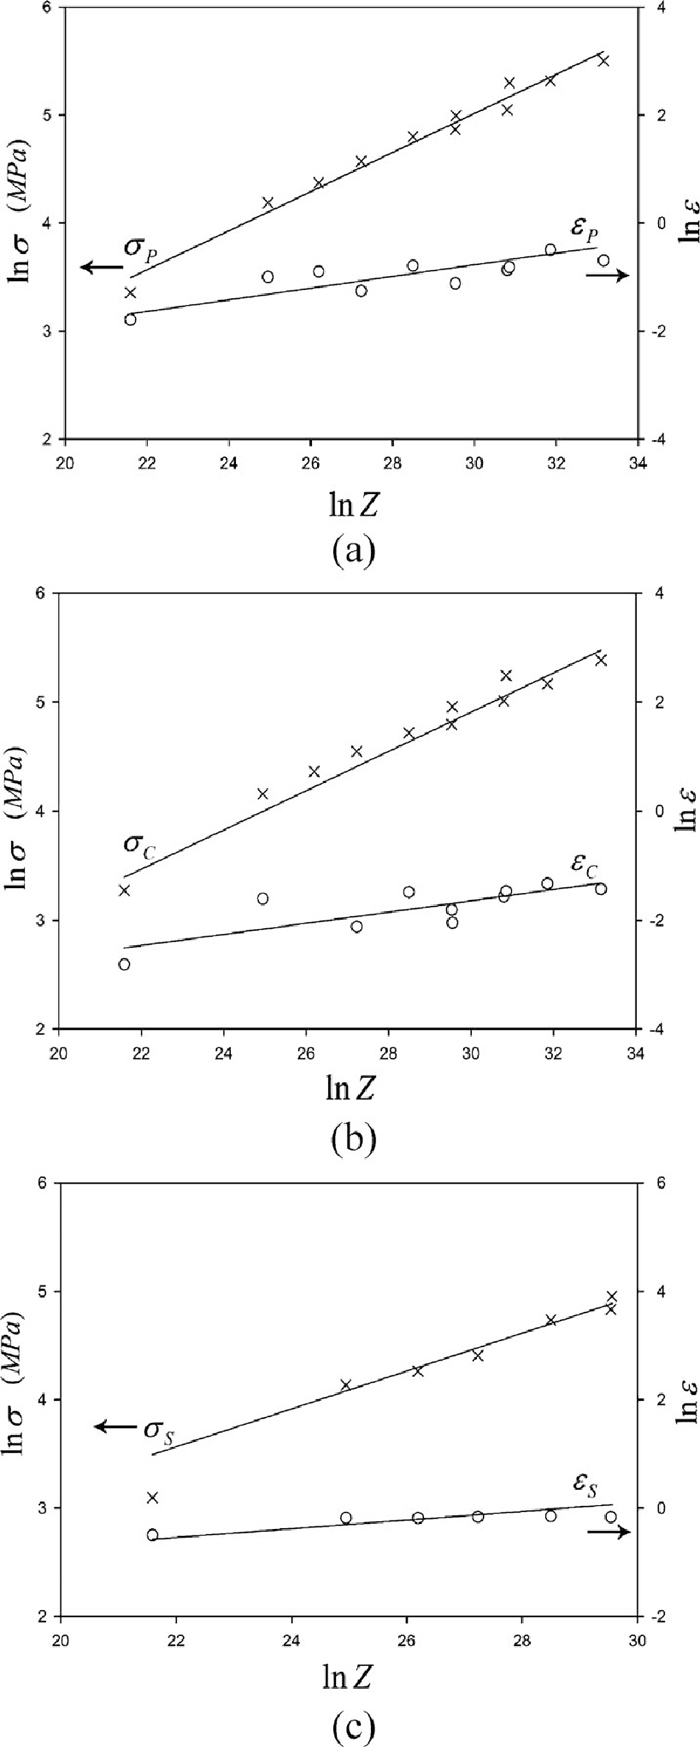
Dependence of the characteristic points of flow curves on Z.
Microstructures obtained at deformation temperature of 1150°C and different strain rates are shown in Fig. 9. This figure shows that the average grain size increases with decreasing strain rate. Figure 10 shows the resultant microstructures at strain rate of 0.1 s–1 and different deformation temperatures. Here, the average grain size increases with increasing the deformation temperatures. The increase in grain size with rising temperature and declining strain rate could be attributed to decline in dislocation density and increase in the mobility of grain boundaries and hence the growth rate.
Hot deformed microstructures at deformation temperature of 1150°C under strain rate of (a) 10, (b) 1, (c) 0.1 and (d) 0.001 s–1.
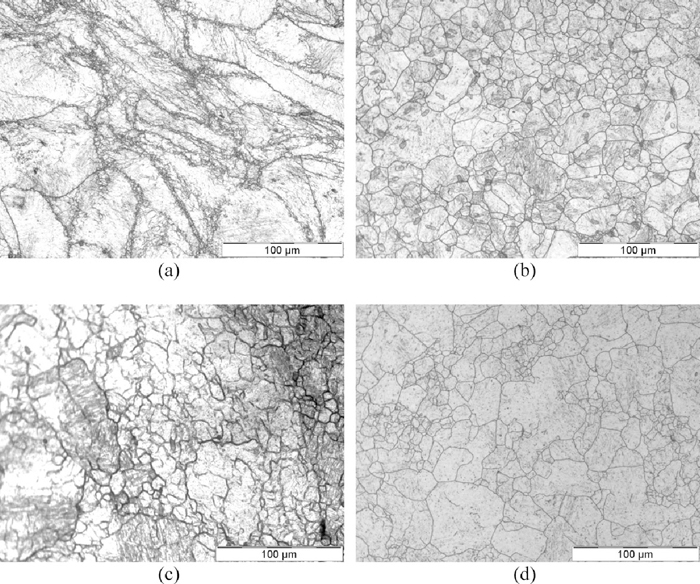
Hot deformed microstructures under strain rate of 0.1 s–1 at deformation temperature of (a) 950, (b) 1000, (c) 1100 and (d) 1150°C.
Since DRX involves repeated nucleation but limited growth of new grains, the mean DRX grain size varies slightly as recrystallization proceeds.37) However, in a partially recrystallized structure, deformed grains also contribute to the measurement of grain size. As a result, the average grain size (
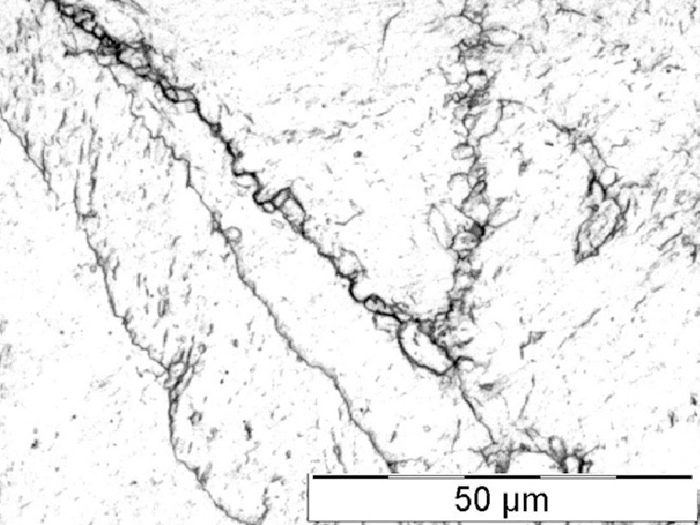
Hot deformed microstructure of the sample deformed at T=950°C and
Figure 12 shows the average grain size (
| (9) |
| (10) |
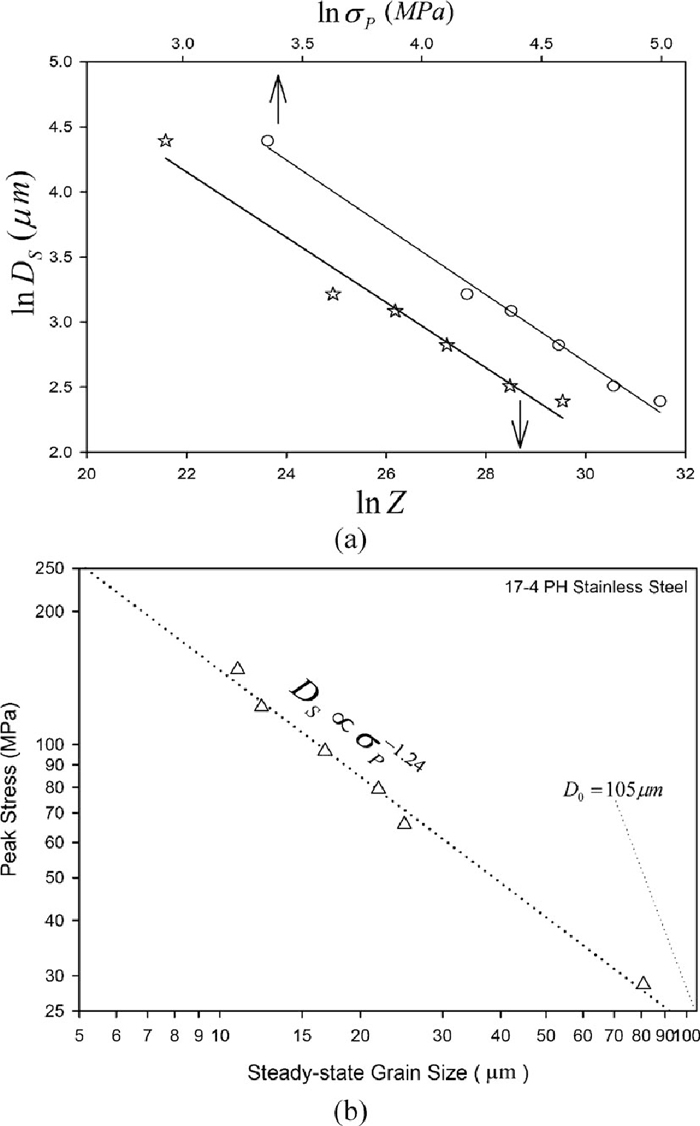
The dependence of the average steady-state grain size on Z and peak stress.
The highest Z and peak stress under DRX condition in this work was determined for the deformation condition of T = 950°C with strain rate of 1 s–1; where, the steady state grain size and strain can be estimated as 5.4 µm by Eq. (9) and 1.27 by Eq. (8), respectively. Unfortunately, the strain of 1.27 is relatively large for hot compression test. However, bear in mind that these analyses were performed for initial grain size of 105 µm. This is an undisputable fact that the recrystallized grain size under conventional discontinuous dynamic recrystallization (DDRX) is virtually independent of initial grain size.37) However, by decreasing the initial grain size, both critical and steady state strains will decrease and full DRX under high Z parameters can be achieved at relatively lower strains. In other words, the higher grain boundary frequency in the finer initial microstructure will increase the potential nucleation sites, which in turn accelerates the recrystallization process of austenite.
3.6. DRX MapMicrostructural observations when combined with the flow curve analysis can be used to construct DRX maps as shown in Fig. 13. In order to draw this figure, the critical and steady state strains from flow curve analysis (Eq. (8)) were used to define the partial and fully DRX regions (solid lines). Moreover, microstructural studies were used to relate the DRX grain size with Z (dotted lines). The microstructural observations may also be used to determine the completion strain of DRX,65) but in the current work, due to difficulties in microstructural studies, the steady state strain was used as the completion strain of DRX. Since the flow softening related to the progress of DRX continues until reaching the steady state strain, this assumption is practically reasonable. As can be seen in Fig. 13, the critical and steady state strains increase with Z, while the DRX grain size decreases with increasing Z. The developed map can be used as a rough estimate to show the effects of deformation conditions on the occurrence of DRX and on the resultant grain size. However, it should be noted that this map is valid for the 17-4 PH stainless steel with initial grain size of 105 µm. For a different initial grain size, the critical and steady state strains (solid lines) will be different and hence another map should be developed. In other words, the effect of initial grain size on the extent of DRX in a given temperature and strain rate should be taken into account in hot deformation studies.
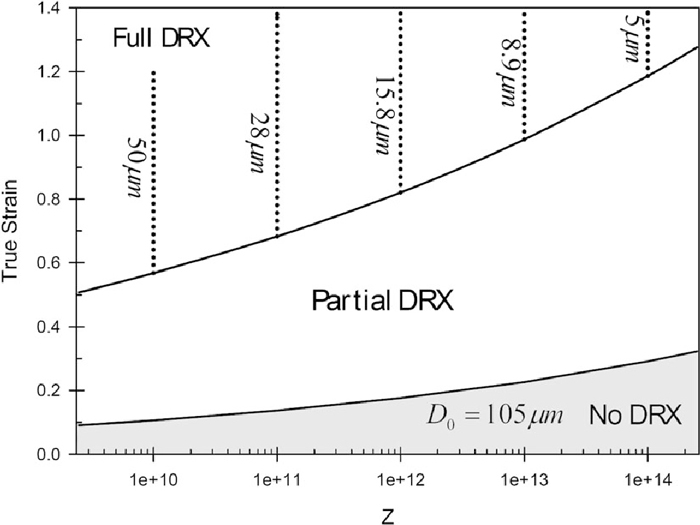
DRX map of the hot compressed 17-4 PH stainless steel with initial grain size of 105 µm.
(1) The majority of flow curves of 17-4 PH stainless steel under hot compression test exhibited typical dynamic recrystalization (DRX) behavior with a single peak stress followed by a gradual fall towards a steady state stress. A transition state between single and multiple peak behaviors was seen in this work and it was called the multiple transient steady-state (MTSS) behavior. Although some samples exhibited typical DRV or DRX behavior, the inflection analysis in the work hardening rate vs. stress plots and microstructural investigations proved the occurrence of DRX or DRV, respectively.
(2) After a critical discussion, the following constitutive equation was found, which can be used to express hot working characteristics of the 17-4 PH stainless steel during hot compression:
(3) The Z exponents for peak stress and peak strain were determined as 0.18 and 0.11, respectively.
(4) The normalized critical stress and strain for initiation of DRX were found to be σC / σP = 0.89 and , εC / εP = 0.47, respectively.
(5) Significant grain refinement occurred as a result of necklace DRX mechanism. The average dynamically recrystallized grain size decreased with increasing strain rate and decreasing deformation temperature. It was related to Zener-Hollomon parameter and peak stress by power equations with exponents of –0.25 and –1.24, respectively.
(6) A DRX map, as a bridge between flow curve analyses and microstructural investigations, was developed to show the effects of deformation conditions on the occurrence of DRX and on the resultant grain size.