Regular Article
Ab-initio Investigation of Hydrogen Trap State by Cementite in bcc-Fe
2013 年 53 巻 4 号 p. 709-713
詳細
2013 年 53 巻 4 号 p. 709-713
Hydrogen trap state by cementite in ferrite was investigated by ab-initio calculations. The calculated trap energy at cementite interstitial was 33 kJ/mol and that at the interface of cementite/ferrite was 39 kJ/mol. The calculated activation energy of the migration over the stable interstitial sites is 55 kJ/mol. Considering calculated zero point vibration energy, the trap energy at cementite interstitial becomes 41 kJ/mol and the activation energy becomes at least 59 kJ/mol. The low temperature peak at about 400 K in Thermal Desorption Spectrum (TDS) of cementite reported by other researchers is considered to correspond to the trap site at the cementite/ferrite interface. Since the interstitial trap site in cementite is not effective because of the high diffusion barrier at low temperature, the higher temperature peak at about 500 K in the TDS is considered to correspond to the migration energy from the defects such as grain boundaries in cementite introduced by deformation.
Since hydrogen embrittlement is one of the serious problems for the practical use of high-strength steel, a lot of investigations about the hydrogen state in steel have been performed and the hydrogen trap state of various defects in steel is becoming clear. Especially cementite, which is contained in high-strength steel such as tempered martensite or pearlite, has been studied regarding hydrogen trapping. Hong et al. conclude from permeation experiment that ferrite/cementite interface has trap energy of 10.85 kJ/mol,1) which was almost the same as the other researcher’s results. Nagumo2) and Kim3) reported from Thermal Desorption Spectrum (TDS) results that pearlite has a single peak which corresponds to ferrite/cementite interface. Wei and Tsuzaki investigated thermal desorption spectrometry of the hydrogen trapping capability of a tempered martensite and reported that cementite has a negligible effect on hydrogen trapping compared with dislocations in ferrite matrix or grain boundaries.4) Hanada5) and Akiyama6) showed that hydrogen in tempered martensite was distributed only in ferrite by tritium autoradiography and Ag decoration technique respectively. Takai and Watanuki7) reported from TDS measurement of drawn pearlite steel wire that deformed pearlite had two peaks of TDS and the activation energy of lower temperature peak was 20–46 kJ/mol and that of higher one was 64–93 kJ/mol. They also reported that there was only the lower temperature peak in the TDS of undrawn pearlite steel.
Several researchers1,2,3) including Takai and Watanuki7) concluded that the origin of the lower temperature peak and the higher one were considered to be the trap by ferrite/cementite interface and dislocations at the interface or grain boundaries in cementite, which are caused by deformation. Though many experimental results suggest the validity of these models, no theoretical evidence from ab-initio calculation has been made. The purpose of this study is to clarify the hydrogen trap energy and site by cementite theoretically through ab-initio calculations.
We performed all ab-initio calculations with the Vienna Ab initio Simulation Package (VASP),8,9) which solved spinpolarized DFT equation with plane wave basis and periodic boundary conditions. We used Generalized Gradient Approximation (GGA)10) Projector Augmented Wave11) method for pseudo potential calculations.
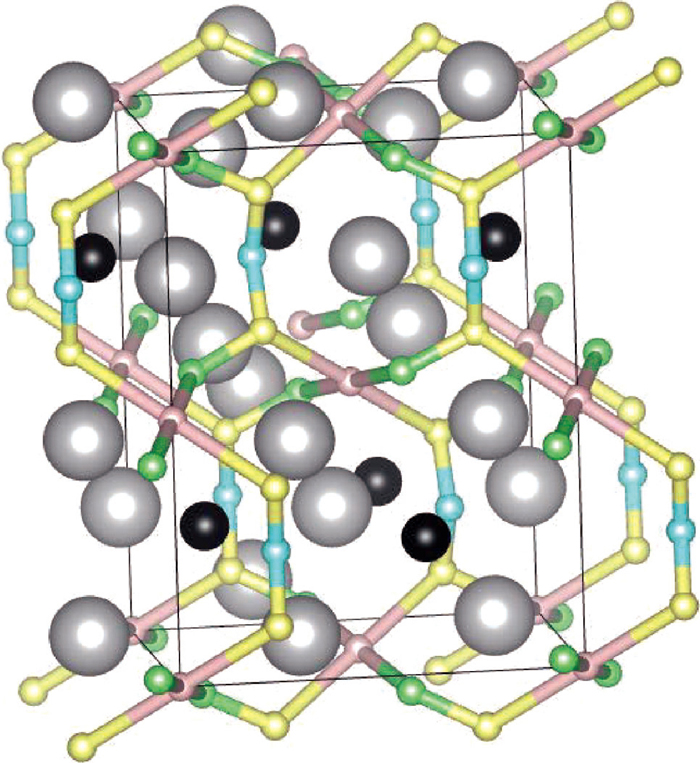
2.2. Cementite BulkThe unit cell of cementite contains four carbon atoms surrounded by six iron atoms, which form a triangular prism, as shown in Fig. 1. The formation energy of the unit cell of cementite was minimized by relaxing the lattice parameters and the positions of atoms keeping the unit cell as rectangular. The k-points and cut-off energy used in the calculations were 7×7×7 and 48243 kJ/mol (500 eV). We checked that these conditions made the calculation errors within 2 kJ/mol by comparison with several calculation results. To find the stable or metastable positions of hydrogen atom in cementite, the atom was set at several positions in cementite and all atomic positions were relaxed fixing the lattice parameters.
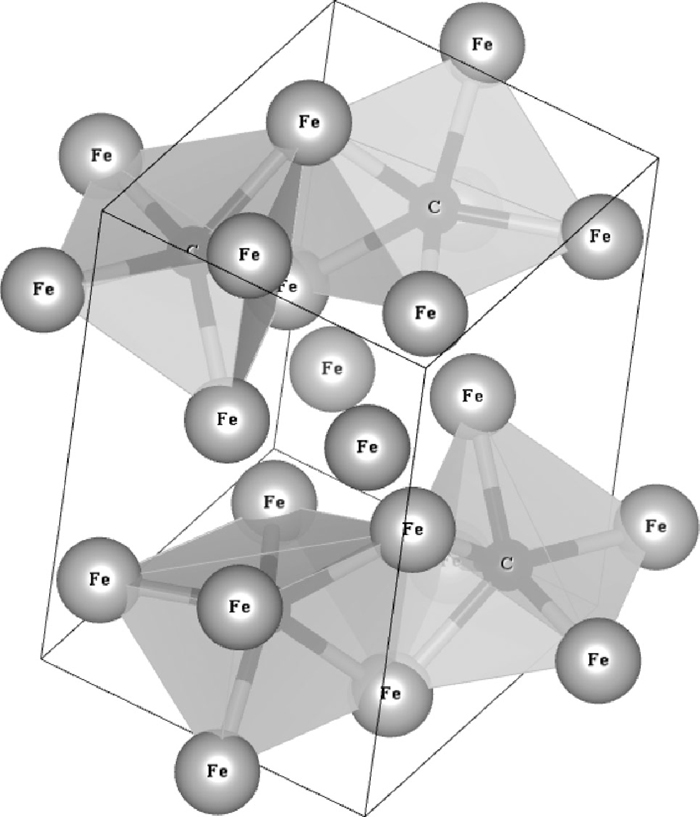
Atomic structure of cementite. The rectangular unit cell is shown by the thin line. Fe and C atoms are shown by large gray spheres and small black spheres respectively. Hexagonal prisms formed by six Fe atoms which are bonded with a C atom are shown semitransparent gray planes.
The climbing image Nudged Elastic Band (NEB)12) was used to estimate the activation energies of migration between stable or metastable sites. Several images connected with each other by pseudo springs are set between the initial state and the final state, and the path is calculated by the condition that the total energy of the system which includes all images is minimized. The number of images used in these calculations was five or seven. The number was chosen from the length of the migration path.
Since hydrogen atom is too light to neglect zero point vibration energy (ZPE), it was considered when the energies of stable states were estimated. The vibration frequency was estimated with the small displacement method within the harmonic oscillation approximations.
2.3. Ferrite/Cementite SuperlatticeThe orientation relationships of cementite and ferrite in pearlite or tempered martensite were reported mainly as follows;13)
Bagaryatsky
Isaichev
Pitsch-Petch
Among there, Bagaryatsky relationship is mostly observed.
We took Bagaryatsky relationship as ferrite/cementite interface model, because the relationship is the most frequently observed one. Since the atomic structure of the interface cannot be determined only by the facet face orientation and interface orientation relationship, we made the model of the atomic structure as follows.
It is difficult to form coherent interface, because the lattice mismatch is larger than 5%. However, for the convenience of the ab-initio calculation the coherent cementite/ ferrite interface was adapted, where the lattice parameter parallel to the facet plane was set to the natural length of cementite. One of the superlattice structures used for the calculation is shown in Fig. 2. The unit cell contains twelve iron atoms in ferrite and twelve iron atoms and four carbon atoms in cementite. The vertical length is set to minimize the formation energy. Eliminating the error caused by the difference in the cell sizes, the trap energy Etrap is calculated as
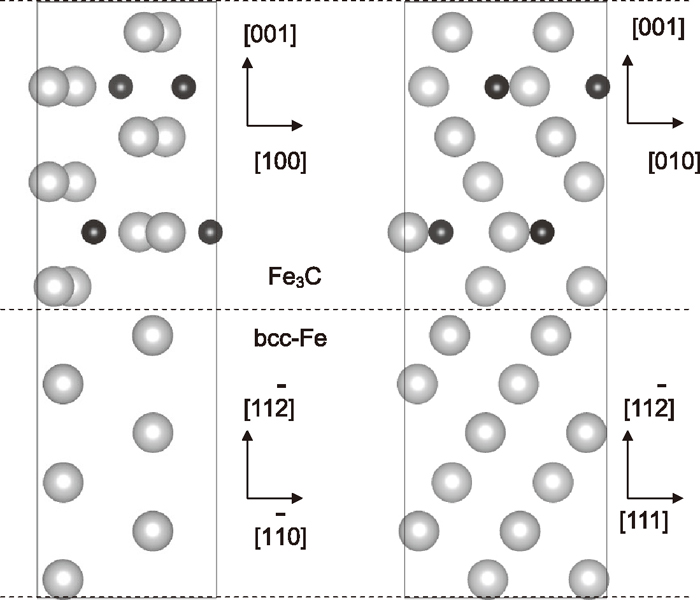
Unit cell of superlattice used for cementite/ferrite interface model. Left rectangle and right one are a view from the [111] and
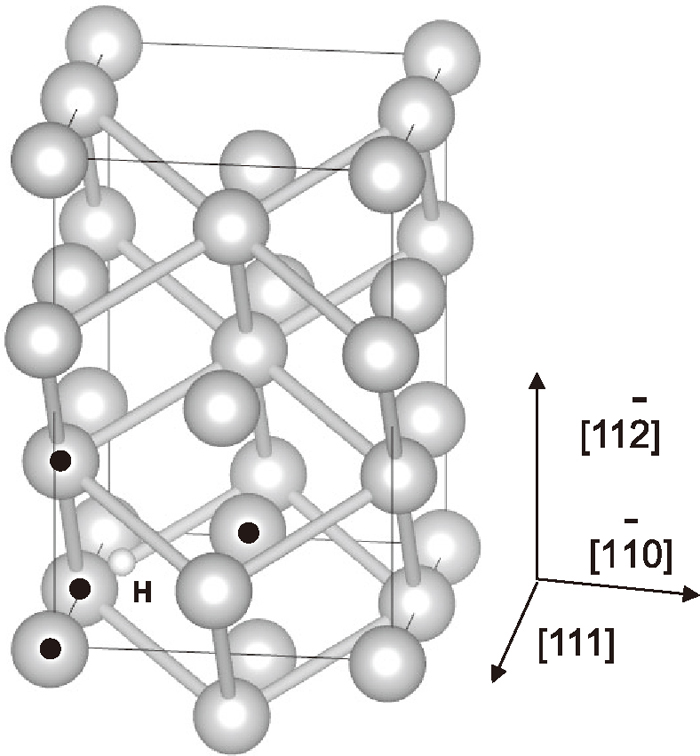
Atomic structure of the ferrite unit cell with an interstitial hydrogen atom. The unit cell corresponds to the ferrite part of cementite/ferrite superlattice. Large grey spheres and a tiny white sphere show Fe atoms and a hydrogen atom respectively. The dotted grey spheres show the Fe atoms surround the hydrogen atom. The bonds are between the second neighbor Fe atoms and the cube formed by twelve bonds corresponds to the unit cell of bcc Fe.
The most stable interstitial site for hydrogen atom in cementite is the octahedral site O surrounded by six iron atoms, which form an octahedron. A unit cell has four equivalent stable sites, which are shown as pink spheres in Fig. 4. There are three kinds of metastable sites T1, T2 and T3 in cementite. They are all surrounded by four iron atoms, which form a tetrahedron, shown as yellow, blue and green spheres respectively in Fig. 4. The stable or metastable sites have larger free space. In contrast, there are neither stable sites nor metastable sites near carbon atoms. Table. 1 lists the energy differences of the T-sites from the stable O-site and the ZPE of the each site.
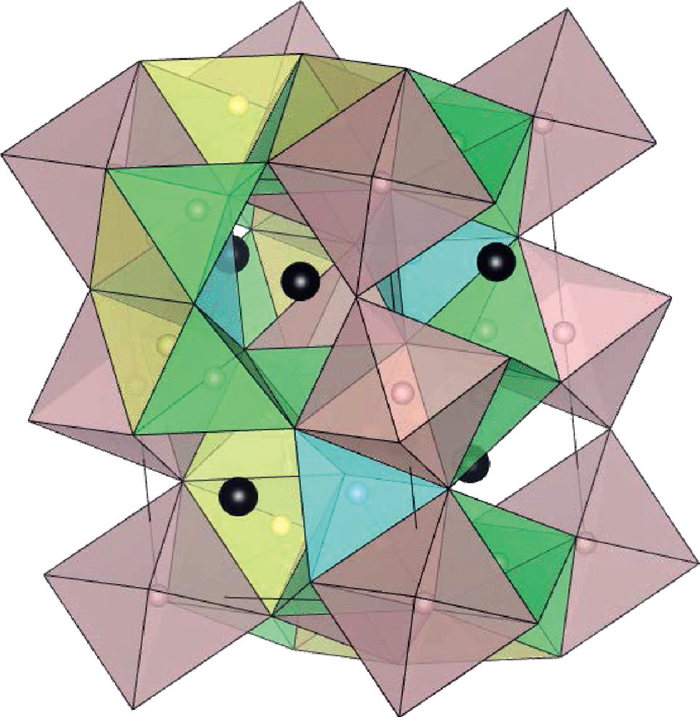
Schematic diagram of the hydrogen stable sites in cementite. Pink tiny spheres are octahedral stable sites O and six Fe atoms surrounding an O site are at the corners of each pink octahedron. Yellow, green and blue tiny spheres are tetragonal stable sites T1, T2 and T3 respectively. Four Fe atoms surrounding a T site are at the corners of each tetrahedron with the same colors. Small black spheres show C atoms.
| O | T1 | T2 | T3 | O–T1 | |
|---|---|---|---|---|---|
| relative energy (kJ/mol) | 0.0 | 49.4 | 66.6 | 76.9 | 54.7 |
| ZPE (zero point energy) (kJ/mol) | 16.4 | 23.4 | 24.5 | 21.7 | 20.3 |
| relative energy with ZPE correction (kJ/mol) |
0.0 | 56.4 | 74.7 | 82.2 | 58.6 |
The calculated migration passes between the stable or metastable sites are shown in Fig. 5. There are two kinds of passes between neighboring stable sites. One is O–T1–T2–O (P1), and the other is O–T1–T3–T1–O (P2). The passes normal to b-axis are only P1 and parallel ones are only P2. It means that the three dimensional migrations need both paths.
Diffusion path of hydrogen between stable sites and metastable sites. Gray large spheres, black middle spheres show Fe and C atoms respectively. Pink, yellow, green and blue small spheres show O, T1, T2 and T3 sites respectively. Diffusion paths are shown by the connected bonds between these sites. The rectangular shows the unit cell.
The schematic diagram of potential for hydrogen on P1 and P2 are shown in Fig. 6. Without ZPE correction, the calculated activation energies of the migration from the stable O site to T1 site is lower than that to T2 site and the energy is higher than those of the migration between metastable sites. Therefore the overall activation energy of migration among stable O sites is the activation energy from O site to T1 site, which is 55 kJ/mol and is also reported before.14) The ZPE of these sites and the saddle point between O–T1 are also shown in Table. 1. At the saddle point, the normal vibration modes of hydrogen have two real frequencies and an imaginary one. The ZPE of hydrogen at the point was estimated from two vibration modes with real frequencies. With ZPE correction, the relative hydrogen energies at metastable sites became higher by about 5–8 kJ/mol and the energy difference of hydrogen at the saddle point and at T1 site becomes only 2 kJ/mol.
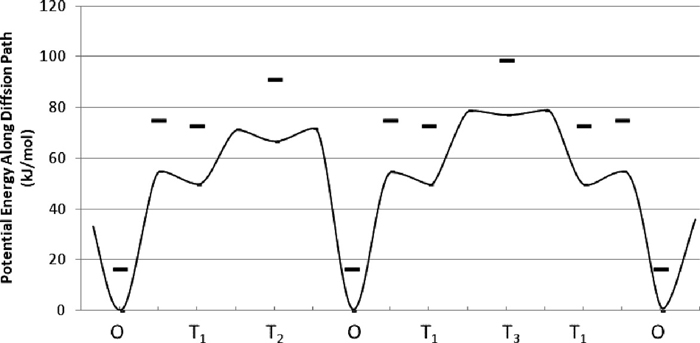
Schematic diagram of diffusion barrier height along O–T1–T2–O–T1–T3–T1–O. The thick line shows the potential energy change along the path. The bold marks (–) show the potential energies with the correction of zero point vibration energy at stable and meta stable sites and the saddle point between O and T1.
The relaxed stable interface structure which has natural lattice parameter of cementite is shown in Fig. 7. Figures 7(a), 7(b), 7(c) and 7(d) show the location of a hydrogen atom in cementite, octahedral interface site, tetrahedral interface site and ferrite respectively. The iron atoms surrounding the hydrogen atom are marked by black circles. The energies of hydrogen in cementite and interface compared with that at ferrite in superlattice and that in strained ferrite compared with that in unstrained ferrite are shown in Table. 2. From these results, the energy of hydrogen in cementite and interface are estimated as 33 kJ/mol and 39 kJ/mol respectively without the correction of ZPE.
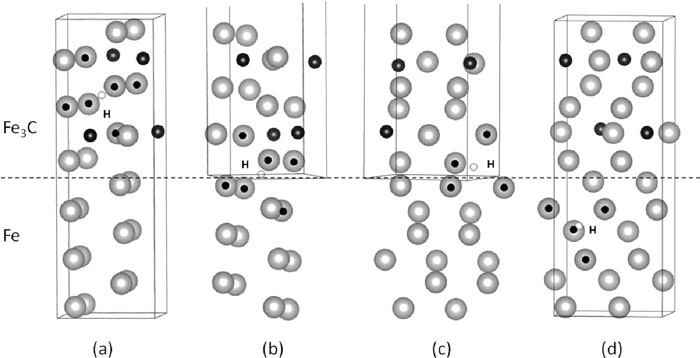
Atomic structures of hydrogen trapped at (a) O site in cementite (b) O site in cementite/ferrite interface (c) T site in cementite/ferrite interface (d) T site in ferrite. Large grey spheres, small black spheres and tiny white spheres are Fe atoms, C atoms and hydrogen atoms, respectively. The broken line shows cementite/ferrite interface position. The Fe atoms surrounding a hydrogen atom are shown by dotted grey spheres.
| cell | superlattice (Es_trap – Es_Fe) | ferrite cell (Eb_def – Eb) | ||||
|---|---|---|---|---|---|---|
| site | cementite | interface1 | interface2 | ferrite | strained | unstrained |
| relative energy (kJ/mol) | 0.2 | –5.0 | 28.4 | 0.0 | –33.5 | 0.0 |
| ZPE (zero point energy) (kJ/mol) | 16.3 | 14.9 | 23.4 | 20.8 | 20.7 | 23.7 |
| relative energy with ZPE correction (kJ/mol) | –4.3 | –10.9 | 31.0 | 0.0 | –36.5 | 0.0 |
One of the reasons why the sites neighbored by carbon atoms are unstable for hydrogen is that the electrons belonging to carbon atoms are largely distributed there. Figure 8 shows the density of states of cementite with a hydrogen atom. The 1s state of hydrogen and the 2s and 2p states of carbons are lower than the valence bands of iron atoms and almost fully occupied by charge transfer from iron atoms. Therefore the hydrogen and carbon atoms are negatively ionized, and are repulsive each other and it is difficult that a hydrogen atom becomes near a carbon atom. Although the volume of tetrahedron around T3 site is larger than that of the other tetrahedrons around T1 and T2, T3 site has higher energy than T1 and T2. The reason is considered that the distance of T3 site from nearest carbon atom is smaller than those of T1 and T2.
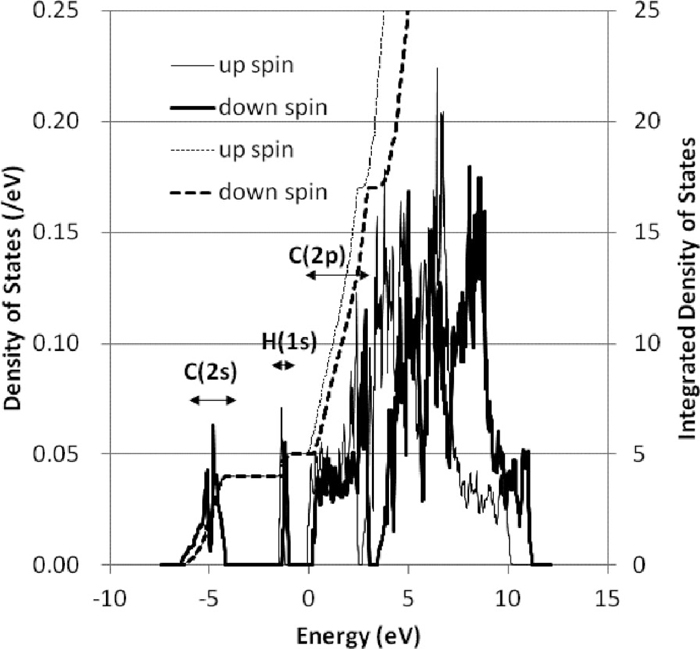
Density of states (DOS) and integrated DOS for cementite with a hydrogen atom at O site. Thin line and thick line show DOS of up spin and down spin respectively. Thin broken line and thick broken line show integrated DOS of up spin and down spin respectively. The energy ranges shown by arrows give 2s levels of C, 1s levels of hydrogen and 2p levels of C from the low energy.
The energy difference between T1 site and saddle point along O–T1 is only 2 kJ/mol considering ZPE correction. Since it is not clear if T1 site is metastable or not, both cases are taken into consideration to estimate the migration energy of hydrogen in cementite.
At first, T1 site is regarded as metastable and the overall migration energy of hydrogen in cementite is considered. The lowest activation energy from the stable O site to another metastable site, T1 site, is 59 kJ/mol. The energy is more than twice for the migration between metastable sites. When the temperature is high enough for a hydrogen atom to escape from O site, the hydrogen atom can migrate from metastable site to metastable site because of the low activation energy. Therefore the migration energy between sites is 59 kJ/mol. It is high enough for O site not to be effective trap site at low temperature, because hydrogen cannot migrate in cementite.
In the case that T1 site is not regarded as metastable, the barrier height of 59 kJ/mol at the saddle point is not enough to reach T3 site. Therefore the activation energy of migration is the direct migration energy from O site to T3 site and is higher than 82 kJ/mol. The activation energy is also too high to migrate in cementite at low temperature. O site is not considered to be an effective trap site at low temperature whether T1 site is metastable or not.
Drawing pearlite makes the lamellar spacing, the thickness of cementite layers and that of ferrite layers, smaller and introduce dislocations especially at ferrite/cementite interface and some cementite fragmentaion.15) The decrease of the layers of cementite layer indicates that many defects such as grain boundaries and dislocations are also introduced in cementite. The defects may work as new trap sites and new migration routes like grain boundaries. The high migration energy in cementite and the above discussion suggest that the origins of the high temperature peak of TDS in drawn pearlite is considered as the migration through defects in cementite with the activation energy lower than that in the perfect cementite crystal. The activation energy of the high temperature peak in TDS obtained by Takai and Watanuki is 64–93 kJ/mol and is almost the same as the calculated migration energy 59–82 kJ/mol.
The stable interface site is the octahedral site. The structure is almost the same as that in cementite as shown in Figs. 7(a) and 7(b) and the trap energy is almost the same. On the other hand, the trap energy of tetrahedral interstitial site is different from that at interstitial site in strained ferrite but almost the same as that at tetrahedral site in cementite. These results suggest that trap energy be determined by the local atomic configurations of surrounding iron atoms and repulsive carbon atoms. The Coulomb interaction by an ionized hydrogen atom in metal such as bcc-Fe or cementite may be effectively screened by conduction electrons, though the interaction between ionized atoms such as hydrogen atoms and carbon atoms cannot be ignored in a short range. Therefore, the incoherent interface may be regarded as usual grain boundaries accompanied by carbon atoms in cementite which are repulsive for hydrogen atoms and have hydrogen trap energy concomitantly lower than that of general grain boundary.
Above consideration about cementite/ferrite interface and the high barrier of migration in perfect cementite suggest that the lower temperature peak of TDS correspond to the trap energy by ferrite/cementite interface as several researchers indicated. Though the calculated trap energy of 47 kJ/mol at the coherent interface between strained ferrite and unstrained cementite does not directly correspond to the trap energy at the real coherent interface, the activation energy of 20–46 kJ/mol for the low temperature peak of TDS for pearlite estimated by Takai and Watanuki is lower than the reported trap energy of 49 kJ/mol16) and 59 kJ/mol17) at the grain boundary.
The states of hydrogen trapped in cementite and cementite/ferrite interface were analyzed by the ab-initio calculation, and we have following results.
(1) Hydrogen is more stable at the octahedral site in cementite than the interstitial site in ferrite. The trap energy is 41 kJ/mol with the correction of ZPE. The migration energy of the hydrogen trapped at the site is at least 59 kJ/mol with the correction of ZPE and is too high for the octahedral site to be an effective trap site at low temperature.
(2) The calculated trap energy of hydrogen in coherent cementite/ferrite interface was 47 kJ/mol. The trap energy is mainly determined by the local atomic structure.
(3) ZPE corrections are carried out for stable energies and the migration barrier height. Their effects are lower than 10 kJ/mol.
Based on these results, the origin of the first peak measured by TDS is considered as the trap of ferrite/cementite interface and the second peak is considered as the migration in deformed cementite. The trap energies of hydrogen in general incoherent cementite/ferrite interfaces are considered as almost the same as that in grain boundaries with carbon segregation. However the calculations about realistic cementite/ferrite interface model are needed for more quantitative analyses.