Abstract
Phase Equilibria in the MnO–FeO–MnS–FeS–SiO2 liquid phase at SiO2 saturation under reducing condition were experimentally investigated in the temperature range from 1200°C to 1400°C in order to provide a fundamental knowledge on new FerroManganese (FeMn) alloy process. High temperature equilibration, quenching and Electron Probe Micro–Analysis (EPMA) were employed to obtain equilibrium compositions of liquid phase which was separated into oxide–rich liquid and sulfide–rich liquid. Concentration of Mn defined as
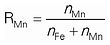 in the sulfide–rich liquid was always lower than RMn in the oxide–rich liquid. In order to understand the liquid separation and the distribution of Mn in the two liquid phases, a thermo-dynamic modeling of this liquid oxysulfide was performed by taking into account strong chemical Short–Range Ordering (SRO) in the framework of the Modified Quasichemical Model in the Quadruplet Approximation. Contrary to the general understanding that Mn attracts S stronger than Fe does and it would have resulted higher Mn content in the sulfide–rich liquid, the present experimental results show that Fe is enriched in the sulfide–rich liquid. This implies that Fe attracts S stronger than Mn does in the liquid phase concerned in the present study. Such a behavior is attributed to the fact that Mn is bound by SiO2 through a formation of (Mn–O–Si) Second–Nearest–Neighbor (SNN) pair, thus oxide–rich liquid attracts more Mn while Fe is distributed more to sulfide–rich liquid. A number of points to be considered for the production of low phosphorus FeMn alloy through the two-phase liquid separation are discussed.
1. Introduction
Recent commercial production of high Mn steel such as TWIP (TWining Induced Plasticity) steel requires a sustainable support of high quality Ferro-Manganese (FeMn) alloy. In particular, P in the FeMn alloy should be controlled as low as possible, because P in the FeMn alloy will be a direct source of P in the TWIP steel, which should be low enough.
FeMn alloys which are commercially available contain 0.2–0.4 mass pct. P,1) but this level of P has not been an issue so far because the total amount of FeMn alloy required for most grades of steels was not high (usual Mn concentration in the steels is less than ~2 mass pct.). However, the amount of FeMn alloy required to produce high Mn steel (Mn concentration in such steels is about ~20 mass pct.) is much higher than that of the conventional steels. Consequently, P concentration in high Mn steels would increase as a consequence and the high P would deteriorate quality of the product and casting performance. Therefore, dephosphorization of FeMn alloy becomes one of very important steps in the production of low P – high Mn containing steel.
Conventional dephosphorization process is performed under oxidizing condition (high oxygen partial pressure) where P is removed as phosphate anion (PO43−). Removal P under the oxidizing condition accompanies with oxidation of other valuable metal, in particular Mn which is easily oxidized as P is. Therefore, Mn loss to molten slag during the dephosphorization can be excessive. On the other hand, removal of P under reducing condition (low oxygen partial pressure) by forming phosphide anion (P3−) usually exhibits rephosphorization into FeMn alloy during the course of production due to relatively unstable nature of the phosphide. Environmental issue (arising from possible evolution of PH3 gas evolution) put a road block to this approach.2) Therefore, it is strongly demanded to seek another route to produce FeMn alloy with low phosphorus content.
Recently, Kim et al.3,4,5) investigated P distribution between FeS–MnS matte and FetO–MnO–SiO2–MgO–CaO slag for the purpose of recover Mn from waste steelmaking slags. They reported that P was not distributed in the matte but was only reported to the liquid slag phase. Based on this result, they proposed a new route to produce FeMn alloy from the waste slag via sulfide route. This proposal utilizes a chemical characteristic of P which repels S in liquid state. This repulsion results in virtually no P in the matte phase while most of the P resides in the oxide slag phase which is in equilibrium with the matte phase.
In order for this alternative route to be realized, among several issues to be considered, the two–phase separation between sulfide–rich liquid and oxide– rich liquid is of great importance as P distribution between these two phases is essential as described above. Unfortunately, Mn oxide/sulfide does not form such two–phase separation in a liquid state, because the MnO–MnS binary phase diagram shows the liquid phase being completely miscible.6) Existence of SiO2 does not induce any stable liquid immiscibility between sulfide–rich liquid and oxide–rich liquid.6) On the other hand, it is well known that FeO–FeS–SiO2 system exhibits a wide liquid miscibility gap at temperature above ~1150°C.7,8) Therefore, it is at least necessary to consider a system composed of Mn–Fe–O–S–Si, and to know regions where the two–phase immiscibility is obtained. However, little information in this system has been known in literatures.
Therefore, in the present study, the phase equilibria in the Mn–Fe–O–S–Si system was investigated through experiment and a thermodynamic modeling approach in order to understand the phase equilibria. Besides, it was also investigated about Mn distribution between sulfide–rich liquid and oxide–rich liquid, because higher Mn content in the sulfide–rich liquid is desirable to increase Mn recovery in FeMn alloy. Mn and Fe are transition metals and thus Mn3+ and Fe3+ exist, but the present investigation was conducted under a reducing condition so that the Mn3+ and Fe3+ should be low in their contents and thus ignored. In particular, the present study was performed at SiO2 saturation condition which will be described later. Under such condition, portion of Fe3+ in Fe–O–Si system has been known to be very small.9) Mn3+ is generally negligible under moderate reducing condition.10) Therefore, the system concerned in the present study may be regarded as MnO–FeO–MnS–FeS–SiO2 system. Furthermore, as mentioned before, the experiment in the present study was carried out in a SiO2 crucible in order to prevent any contamination from container material during the experiment. Therefore, finally, the system investigated in the present study is considered as MnO–FeO–MnS–FeS–SiO2 at SiO2 saturation.
The present article is composed as follows. A literature information is reviewed in order to identify available data in the present system. Experimental method is described and the results obtained in the present study are shown. The results are discussed in the view of two–phase liquid separation, and Mn distribution in both phases. In order to understand the mechanism of the Mn distribution, a thermodynamic modeling is introduced, and the experimental results are analyzed in the aid of the thermodynamic model. Finally, a possible application of the “sulfide route” is discussed.
2. Literature Review
Only two previous investigations were found in literatures on the phase equilibria in the Mn–Fe–O–S–Si system, to the best knowledge of the present authors. Ölsen and Schümann11) reported a liquidus surface in the FeO–FeS–MnO–MnS–SiO2 system showing isotherms on the miscibility gap surface and the location of critical temperatures. Unfortunately, it was not possible to access the original publication of Ölsen and Schümann,11) hence no detailed information could be obtained. According to their investigation, the liquid immiscibility was found in the FeO–FeS–SiO2 system and its size decreased gradually as the concentration of Mn was increased at constant temperature.
Silverman12) employed a standard chemical equilibration and quenching technique to determine phase equilibria in FeO–MnO–MnS–SiO2 system. The author equilibrated mixtures of oxide and sulfide powders in predetermined proportions in sealed re–sulfurized steel crucibles under N2 atmosphere. After quenching the crucibles, standard petrographic examinations were carried out and liquidus temperature and primary phases were determined. However, there could be Fe dissolution from the crucible to the sample during high temperature reaction, therefore the sample compositions reported might have been altered significantly.
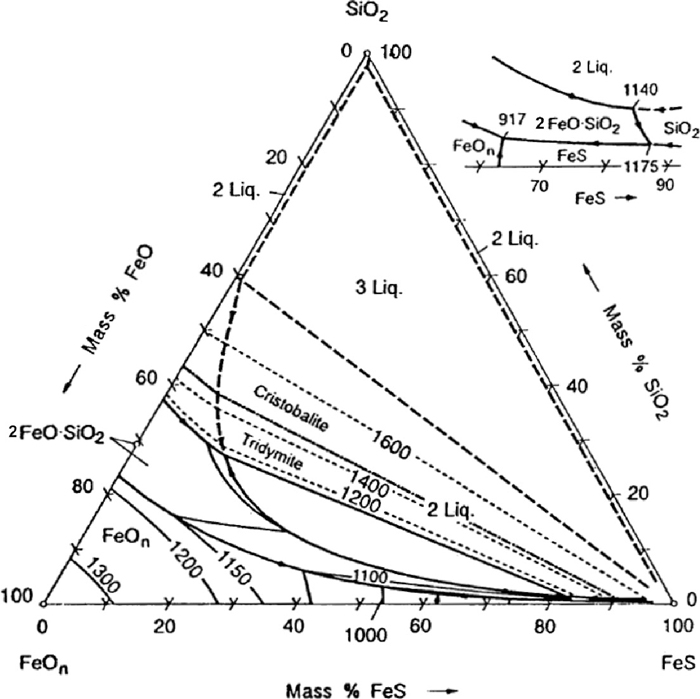
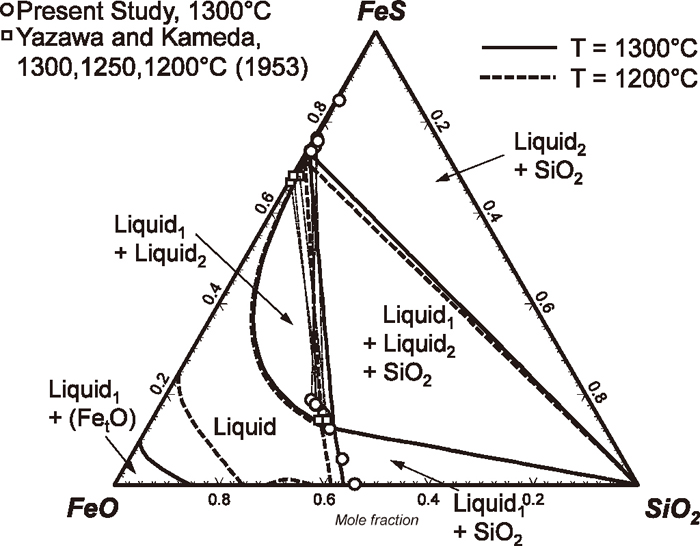
On the other hand, there have been a number of investigations in sub–systems, in particular for FeO–FeS–SiO2 and MnO–MnS–SiO2 oxysulfide systems. Phase diagram of the FeO–FeS–SiO2 system were measured by Ol’shansky,7) Yazawa and Kameda,8) and Vogel,13) respectively. Liquidus surface of the FeO–FeS–SiO2 system in equilibrium with metallic Fe is shown in Fig. 1. Although there are some discrepancy between Ol’shansky,7) and Yazawa and Kameda8) about the location of liquid immiscibility, they all agreed that there exists the liquid immiscibility between sulfide–rich liquid and oxide–rich liquid. At SiO2 saturation, a liquid with a composition close to fayalite (Fe2SiO4) with low S concentration, and the other liquid with a composition almost close to pure liquid FeS, form a wide miscibility gap.
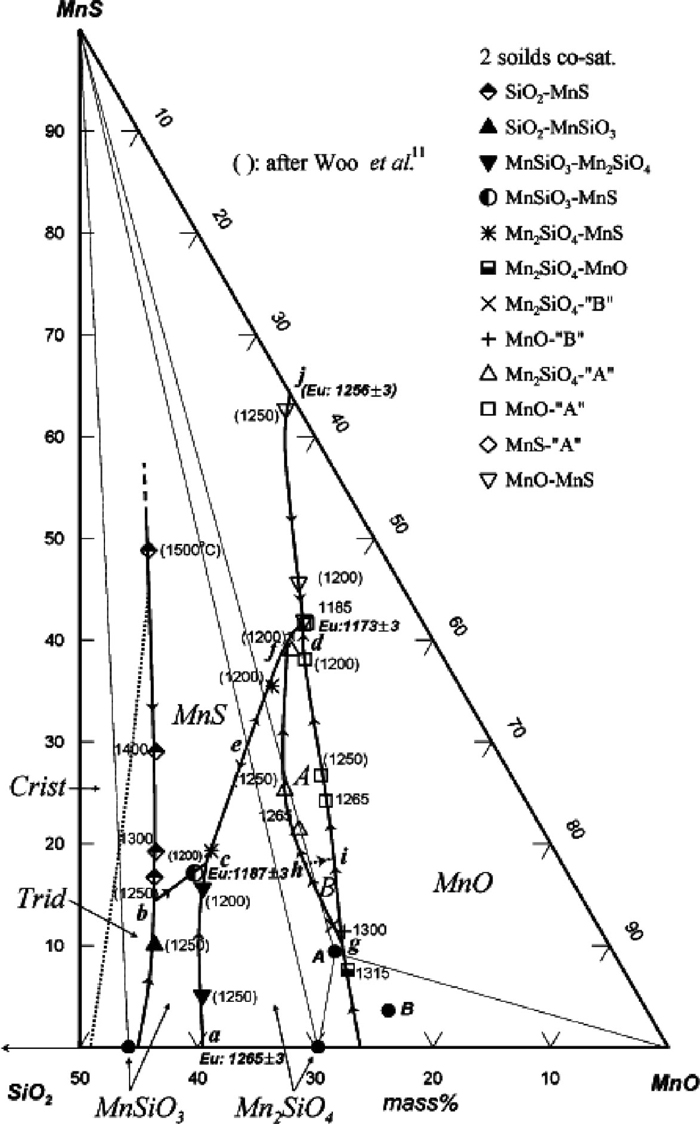
Phase diagram of the MnO–MnS–SiO2 system were investigated by Hasegawa et al.,14) Woo et al.6) and Woo and Lee.15) Liquidus surface of the MnO– MnS–SiO2 system is shown in Fig. 2.15) On the contrary to the FeO–FeS–SiO2 system, no liquid immiscibility between sulfide–rich liquid and oxide–rich liquid was found in the system.
From the experimental data available in the literatures mentioned above, it appears that there is a possibility of forming a two–liquid separation in the MnO–MnS–FeO–FeS–SiO2 system at SiO2 saturation. The two–phase immiscibility is stable in FeO–FeS–SiO2 side, and extends into the MnO–MnS–FeO–FeS–SiO2 system as the concentration of Mn increases until any solid phase appears. However, experimental investigation in the present system lacks, which would limit the understanding of the present system. Moreover, practically important information in view of the “sulfide route” for the FeMn alloy production is how Mn would distribute in both liquid phases. Therefore, in the present study, the phase equilibria in the MnO–MnS–FeO–FeS–SiO2 system at SiO2 saturation was investigated, in particular for the two-phase immiscibility in the liquid phase.
3. Experimental
The general experimental procedure used in the present study is high temperature equilibration under an inert atmosphere, quenching and Electron Probe X-ray Micro-Analysis (EPMA). Such experimental technique has been successfully applied to the investigation of phase equilibria of both oxide systems16,17,18,19,20,21) and sulfur–containing systems.6,15,22,23)
The MnO (99.9 mass pct., Kosundo), MnS (99.9 mass pct., Kosundo), FeO (99.9 mass pct., Kosundo), FeS (99.9 mass pct., Kosundo), and SiO2 (99.9 mass pct., Kosundo) were dried at 110°C, and weighed in the desired proportions. Those powders were then mixed in an agate mortar. Each sample was pelletized and placed along with a piece of quartz chunk in a quartz crucible (OD 12 mm × ID 10 mm × H 10 mm). This ensured that the sample was not contaminated by other components such as Al2O3 or MgO which is typically used as crucible materials. The crucible was then placed in the hot zone of a recrystallized alumina tube sealed by water–cooled brass end caps. The sample in the crucible was heated in a vertical MoSi2 resistance furnace under an atmosphere of Ar gas purified passing through CaSO4 column, and Mg chips at 450°C. Temperature was controlled within 2°C using a B type Pt/Rh thermocouple placed externally to the alumina tube, and were continuously monitored throughout the runs using another B type thermocouple placed immediately above the sample. As the present study focused on the two–phase liquid separation, the reaction time to reach equilibrium was expected to be short. In the previous investigations, the specimens were held for one and half hour for equilibration.8) In the present study, the reaction was carried out for four hours.
After the equilibration has been established, the samples was rapidly quenched by falling into the ice brine. Whole part of each sample was then mounted in an epoxy resin, and polished for examination using optical microscopy and EPMA.
The EPMA was carried out on a JEOL 8100-JXA1 in the WDS mode for the measurement of equilibrium concentrations (Mn, Fe, Si, and S) in each phase observed in samples. Operating conditions were 15 kV accelerating voltage, 30 nA probe current. Data were reduced using ZAF correction routine. Since O concentration was not directly obtained using the WDS, the O concentration could not be measured. Therefore, the O concentration was calculated so that the sum is to be 100 mass pct.
At least five to ten analyses were made of each phase in a sample and they were averaged. The uncertainties of the measurement was usually within 1 mass pct. Some small size liquid particle was observed being physically suspended in the other liquid phase. Therefore, the analysis for each liquid phase was carried out carefully by decreasing the probe size in order not to take any X–ray peak from the other liquid phase.
1 JEOL is a trademark of Japan electron Optics Ltd., Tokyo.
4. Experimental Results
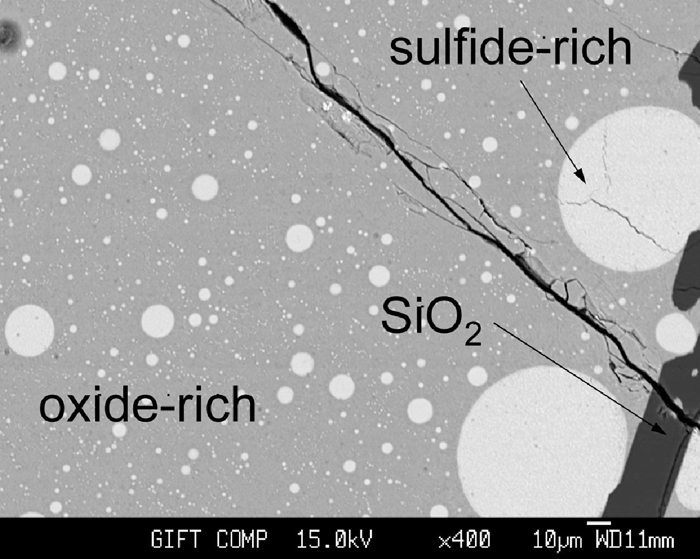
Equilibrium compositions of liquid phases are listed in Table 1, and a typical micrograph taken in this study is shown in Fig. 3.
Table 1.Equilibrium compositions of liquid phase (s) in the MnO–FeO–MnS–FeS–SiO
2 at SiO
2 saturation, obtained in the present study.
| No. | T(°C) | Mass pct. | Phase§ |
R
Mn
‡
|
R
S
‡
|
|---|
| Si | Mn | S | Fe | O† |
|---|
| Fe–O–S–Si at SiO2 saturation |
| 1 | 1300 | 20.1 | 0.0 | 0.0 | 47.2 | 32.6 | Ox | 0.00 | 0.00 |
| 2 | 1300 | 17.3 | 0.0 | 2.7 | 49.9 | 30.0 | Ox | 0.00 | 0.09 |
| 3 | 1300 | 14.9 | 0.0 | 6.0 | 55.0 | 24.2 | Ox | 0.00 | 0.19 |
| 4 | 1300 | 13.0 | 0.0 | 7.2 | 54.3 | 25.5 | Ox | 0.00 | 0.23 |
| | 0.4 | 0.0 | 28.3 | 65.5 | 5.8 | Su | 0.00 | 0.75 |
| 5 | 1300 | 11.3 | 0.0 | 8.5 | 56.9 | 23.3 | Ox | 0.00 | 0.26 |
| | 0.2 | 0.0 | 29.5 | 66.8 | 3.4 | Su | 0.00 | 0.77 |
| 6 | 1300 | 11.8 | 0.0 | 7.9 | 55.6 | 24.6 | Ox | 0.00 | 0.25 |
| | 0.2 | 0.0 | 28.7 | 67.4 | 3.6 | Su | 0.00 | 0.74 |
| 7 | 1300 | 12.0 | 0.0 | 8.2 | 56.8 | 23.0 | Ox | 0.00 | 0.25 |
| | 0.3 | 0.0 | 28.4 | 66.6 | 4.7 | Su | 0.00 | 0.74 |
| 8 | 1300 | 0.3 | 0.0 | 28.9 | 65.7 | 5.1 | Su | 0.00 | 0.77 |
| 9 | 1300 | 0.2 | 0.0 | 30.2 | 61.7 | 7.9 | Su | 0.00 | 0.85 |
| Mn–Fe–O–S–Si at SiO2 saturation |
| 10 | 1200 | 9.8 | 28.6 | 15.5 | 30.2 | 15.9 | Ox | 0.49 | 0.46 |
| | 1.0 | 16.8 | 30.9 | 48.1 | 3.2 | Su | 0.26 | 0.83 |
| 11 | 1200 | 12.3 | 25.1 | 9.7 | 29.8 | 23.0 | Ox | 0.46 | 0.31 |
| | 0.3 | 9.4 | 31.5 | 55.3 | 3.4 | Su | 0.15 | 0.84 |
| 12 | 1200 | 12.4 | 20.5 | 9.5 | 34.0 | 23.6 | Ox | 0.38 | 0.30 |
| | 0.3 | 6.2 | 29.6 | 57.7 | 6.1 | Su | 0.10 | 0.80 |
| 13 | 1200 | 13.2 | 16.2 | 7.9 | 39.3 | 23.4 | Ox | 0.30 | 0.25 |
| | 0.4 | 4.2 | 29.1 | 61.1 | 5.2 | Su | 0.07 | 0.77 |
| 14 | 1200 | 12.8 | 9.6 | 7.3 | 47.0 | 23.3 | Ox | 0.17 | 0.22 |
| | 0.4 | 2.2 | 28.4 | 64.3 | 4.7 | Su | 0.03 | 0.74 |
| 15 | 1200 | 12.3 | 27.7 | 11.3 | 28.1 | 20.7 | Ox | 0.50 | 0.35 |
| | 0.4 | 11.3 | 31.2 | 53.4 | 3.7 | Su | 0.18 | 0.84 |
| 16 | 1200 | 9.9 | 28.5 | 14.7 | 29.0 | 17.9 | Ox | 0.50 | 0.44 |
| | 0.8 | 15.6 | 29.4 | 48.8 | 5.4 | Su | 0.25 | 0.79 |
| 17 | 1300 | 11.0 | 33.4 | 14.4 | 23.4 | 17.8 | Ox | 0.59 | 0.44 |
| | 1.1 | 20.3 | 29.8 | 43.2 | 5.6 | Su | 0.32 | 0.81 |
| 18 | 1300 | 11.6 | 29.4 | 12.8 | 27.1 | 19.2 | Ox | 0.52 | 0.39 |
| | 0.7 | 14.5 | 30.9 | 49.9 | 4.0 | Su | 0.23 | 0.83 |
| 19 | 1300 | 13.2 | 24.7 | 9.5 | 28.9 | 23.6 | Ox | 0.46 | 0.31 |
| | 0.3 | 8.7 | 32.0 | 56.6 | 2.4 | Su | 0.14 | 0.85 |
| 20 | 1300 | 13.6 | 20.2 | 9.1 | 33.8 | 23.3 | Ox | 0.38 | 0.29 |
| | 0.1 | 4.4 | 31.7 | 61.3 | 2.5 | Su | 0.07 | 0.84 |
| 21 | 1300 | 13.4 | 14.7 | 8.3 | 40.5 | 23.1 | Ox | 0.27 | 0.26 |
| | 0.2 | 2.9 | 30.2 | 62.4 | 4.4 | Su | 0.05 | 0.80 |
| 22 | 1300 | 12.9 | 7.9 | 8.1 | 47.8 | 23.2 | Ox | 0.14 | 0.25 |
| | 0.2 | 1.3 | 30.5 | 64.4 | 3.6 | Su | 0.02 | 0.81 |
| 23 | 1300 | 12.7 | 27.4 | 11.1 | 27.0 | 21.8 | Ox | 0.51 | 0.35 |
| | 0.3 | 10.7 | 31.8 | 53.5 | 3.7 | Su | 0.17 | 0.86 |
| 24 | 1300 | 10.9 | 29.1 | 13.9 | 28.2 | 17.9 | Ox | 0.51 | 0.42 |
| | 0.5 | 14.2 | 32.0 | 50.5 | 2.8 | Su | 0.22 | 0.86 |
| 25 | 1300 | 9.9 | 31.1 | 15.4 | 26.9 | 16.7 | Ox | 0.54 | 0.46 |
| | 0.5 | 14.2 | 32.0 | 50.5 | 2.8 | Su | 0.22 | 0.86 |
| 26 | 1400 | 10.8 | 32.9 | 13.8 | 23.3 | 19.2 | Ox | 0.59 | 0.42 |
| | 0.6 | 20.5 | 32.8 | 44.3 | 1.8 | Su | 0.32 | 0.88 |
| 27 | 1400 | 12.2 | 29.8 | 13.1 | 26.5 | 18.3 | Ox | 0.53 | 0.40 |
| | 0.4 | 13.0 | 32.4 | 52.3 | 1.8 | Su | 0.20 | 0.86 |
| 28 | 1400 | 13.5 | 25.1 | 9.9 | 28.1 | 23.3 | Ox | 0.48 | 0.32 |
| | 0.3 | 8.7 | 30.4 | 55.4 | 5.3 | Su | 0.14 | 0.82 |
| 29 | 1400 | 14.9 | 21.4 | 7.4 | 31.4 | 24.9 | Ox | 0.41 | 0.24 |
| | 0.2 | 4.9 | 30.5 | 59.6 | 4.8 | Su | 0.08 | 0.82 |
| 30 | 1400 | 14.4 | 15.1 | 7.5 | 37.8 | 25.2 | Ox | 0.29 | 0.25 |
| | 0.3 | 3.7 | 29.2 | 62.0 | 4.8 | Su | 0.06 | 0.77 |
| 31 | 1400 | 13.4 | 8.4 | 6.3 | 46.4 | 25.6 | Ox | 0.15 | 0.20 |
| | 0.2 | 1.4 | 29.1 | 64.7 | 4.6 | Su | 0.02 | 0.77 |
| 32 | 1400 | 12.1 | 0.1 | 8.4 | 57.1 | 22.3 | Ox | 0.00 | 0.26 |
| | 0.8 | 0.1 | 26.4 | 66.9 | 5.8 | Su | 0.00 | 0.69 |
| 33 | 1400 | 14.3 | 28.2 | 9.5 | 25.6 | 22.4 | Ox | 0.53 | 0.31 |
| | 0.2 | 9.3 | 33.3 | 56.0 | 1.2 | Su | 0.14 | 0.89 |
| 34 | 1400 | 11.4 | 31.0 | 14.3 | 26.4 | 16.8 | Ox | 0.54 | 0.43 |
| | 0.4 | 17.1 | 33.0 | 49.3 | 0.5 | Su | 0.26 | 0.86 |
| 35 | 1400 | 9.4 | 29.7 | 16.1 | 27.6 | 17.1 | Ox | 0.52 | 0.49 |
| | 0.5 | 16.8 | 32.1 | 47.8 | 2.8 | Su | 0.26 | 0.86 |
† Mass pct. O = 100 – (Mass pct. Si + Mass pct. Mn + Mass pct. S + Mass pct. Fe).
§ Ox: oxide-rich liquid, Su: sulfide-rich liquid.
‡ RMn =
nMn / (
nFe +
nMn), R
S =
nS / (
nFe +
nMn) where
ni is the number of moles of
i.
Since the present system is composed of 5 elements (Mn–Fe–O–S–Si), it is not feasible to represent all of the measured compositions in a two– dimensional plot. Provided that the amount of Mn3+ and Fe3+ are small under reducing atmosphere, the system in the present study is considered to be composed of MnO–MnS–FeO–FeS–SiO2. Since the SiO2 existed in all experiments, and also an electro–neutrality condition (2nMn2+ + 2nFe2+ + 4nSi4+ = 2nO2– + 2nS2− ) should be respected, the present system may be regarded as a reciprocal pseudo–ternary system along with the following compositional variables:
|
R
Mn
=
n
Mn
n
Fe
+
n
Mn
| (1) |
|
R
S
=
n
S
n
Fe
+
n
Mn
| (2) |
where
ni is number of moles of element
i. Therefore, compositions of each phase can be plotted on a rectangular coordinate with the two variables at a given
T and
P. As these composition variables do not involve
nSi, concentrations of Si cannot be read directly from the plot. However, since the additional condition of SiO
2 saturation has been imposed, it ensures that any point on the plot using R
Mn and R
S represents a unique equilibrium state. Thus, a true phase diagram can be defined.
24,25)
4.1. Morphology of Samples
Figure 3 shows a sulfide–rich liquid suspended in the middle of the oxide–rich liquid. Grey area represents oxide–rich liquid while light circles correspond to the sulfide–rich liquid. The dark bar-like phase is solid SiO2, presumably tridymite. Measured concentration of the solid SiO2 showed that no appreciable dissolution of other elements (Mn, Fe and S) was observed.
The suspended liquid could not be completely separated from the matrix in the given experimental time (four hours). Such mechanical suspension of sulfide–rich liquid or oxide–rich liquid has also been reported in several other previous studies about phase equilibria between liquid sulfide and liquid oxide.3,4,5,8) Therefore, it was practically difficult to obtain accurate composition of liquid phase. In the present study, as already mentioned in the preceding section, a careful microscopic determination of chemical compositions of a phase was carried out by use of EPMA. This enabled to avoid uncertainty which might otherwise arise due to any adjacent phases. This technique warranted an improved accuracy in comparison with a wet analysis of separated bulk phases which were employed in some studies reported in literature,3,4,5,8) or with those which assumed that the final compositions were the same as the initial ones.12)
4.2. Immiscibility in Liquid
4.2.1. FeO–FeS–SiO2 System
Figure 4 shows an isothermal section of the FeO–FeS–SiO2 system at 1400°C. Open circles are experimentally determined liquid compositions at SiO2 saturation in the present study. Open squares are those from Yazawa and Kameda8) also at SiO2 saturation. Experimental data measured in the present study represent 1) compositions of oxide–rich liquid in equilibrium with SiO2, 2) compositions of sulfide–rich liquid in equilibrium with SiO2, and 3) compositions of oxide–rich liquid and sulfide–rich liquid simultaneously in equilibrium with SiO2. Therefore, the last type of data represents limits of two–phase separation in liquid phase at SiO2 saturation. Experimental data by Yazawa and Kameda8) also represent the same in the temperature range between 1200°C and 1300°C. Their compositions for oxide–rich liquid phase are close to the compositions measured in the present study, while their compositions for sulfide–rich liquid are low in S concentration compared to those measured in the present study. Reason for the discrepancy is not clear at present, but it may be attributed to the analytical uncertainties due to the mechanical suspension discussed in Sec. 4.1.
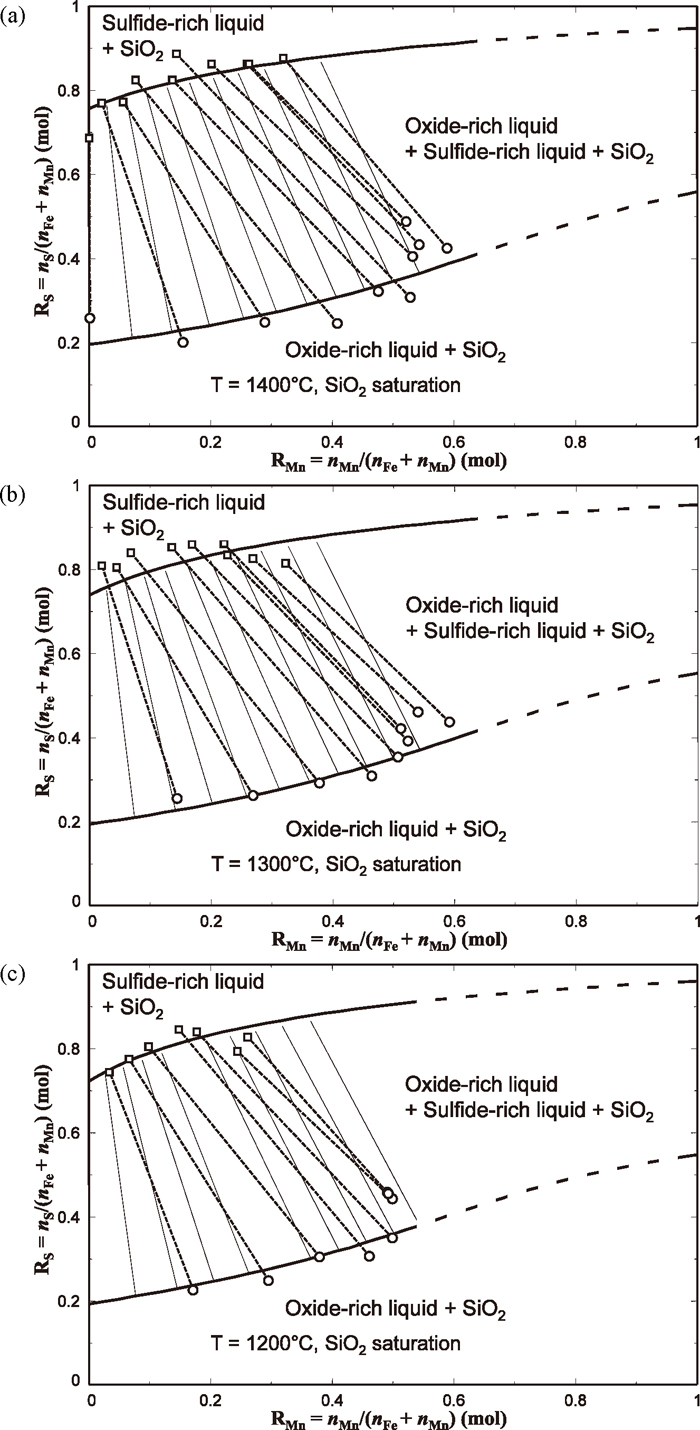
Shown in Fig. 5 are isothermal sections of the MnO–MnS–FeO–FeS–SiO2 system at SiO2 saturation at 1400°C, 1300°C, and 1200°C. Symbols are compositions of liquid phases determined in the present study, representing equilibria between oxide–rich liquid and sulfide–rich liquid, both in equilibrium with SiO2. In order to specify couples of liquid phases in equilibrium with each other, tie-lines are also shown along with the symbols in the figures as dashed lines. It should be noted that those tie-lines do not lie on the same plane as this system is not a true reciprocal ternary system but a reciprocal pseudo–ternary system (Mn–Fe–O–S) saturated by SiO2. It can be seen in the figures that size of the immiscibility in the liquid phase did not considerably change as temperature increases from 1200°C to 1400°C. When the oxide–rich liquid was in equilibrium with the sulfide–rich liquid, RS in the oxide–rich liquid increased as RMn increased. Tie-lines between the sulfide–rich liquid and oxide–rich liquid are observed such that RMn in the sulfide–rich liquid are always lower than RMn in the oxide–rich liquid. This means a preferential distribution of Mn in the oxide–rich liquid phase and also a preferential distribution of Fe in the sulfide–rich liquid phase. Similar preferential distributions of Mn in oxide–rich slag and that of Fe in sulfide–rich matte have also been reported by Kim et al.3,4,5)
5. Thermodynamic Model for the Liquid Oxysulfide Phase
In order to understand the solution behavior of the liquid phase investigated in the present study, the Gibbs energy of the liquid phase is formulated in this section and will be utilized to discuss the solution behavior (two-phase separation and Mn distribution in the two-phase) in Sec. 6. All the thermodynamic calculations performed in the present study were carried out using FactSage thermodynamic software.26,27)
The Gibbs energy of the liquid oxysulfide phase is described using the Modified Quasichemical Model in the Quadruplet Approximation (MQMQA).28,29) This model was first developed by Pelton et al.28) to describe Gibbs energy of molten ionic solution such as molten salts.30,31,32) Recently the model has been extended its application in order to calculate S solubility in multicomponent molten oxides at low sulfur content29,33) as well as phase diagrams of the MnO–SiO2–Al2O3–MnS and its sub–systems29,34) and the CaO–SiO2–CaS and the CaO–Al2O3–CaS systems.23) In this model, it is assumed that the oxysulfide consists of two distinctive sublattices: for example, the present MnO–FeO–MnS–FeS–SiO2 system, (Mn2+, Fe2+, Si4+)x(O2−, S2−)y. Cations reside exclusively on the cationic sublattice, whereas anions reside exclusively on the anionic sublattice. Two important chemical reactions are considered in the model. The first is the reciprocal exchange reaction among the pure liquid components such as those given in Reactions (3) to (5).
|
“FeO”(l)+
SiS
2
(l)=FeS(l)+
SiO
2
(l) Δ
G
FeSi/OS
°,exchange
| (3) |
|
MnO(l)+
SiS
2
(l)=MnS(l)+
SiO
2
(l) Δ
G
MnSi/OS
°,exchange
| (4) |
|
FeS(l)+MnO(l)=MnS(l)+“FeO”(l) Δ
G
FeMn/OS
°,exchange
| (5) |
For Reactions (3) and (4) , the Gibbs energy changes are considerably negative as shown in Table 2 that a strong First–Nearest–Neighbor (FNN) cation–anion Short–Range Ordering (SRO) in the liquid solution is expected. The reaction (5) also exhibits a small negative Gibbs energy change, and the FNN SRO would exist but its extent would be small.
Table 2.Standard Gibbs free energies (Δ
G°) of several reactions considered in the present study.
23,27,29,38)| Reciprocal Reaction | ΔG° (kJ/mol) |
|---|
| 1200°C | 1300°C | 1400°C |
|---|
| MnO(l) + 1/2S2(g) = MnS(l) + 1/2O2(g) | 82.38 | 82.78 | 83.14 |
| “FeO”(l) + 1/2S2(g) = FeS(l) + 1/2O2(g) | 94.56 | 93.99 | 93.33 |
| MnO(l) + FeS(l) = MnS(l) + “FeO”(l) | –12.18 | –11.21 | –10.19 |
| “FeO”(l) + 1/2SiS2(l) = FeS(l) + 1/2SiO2(l) | –159.61 | –158.71 | –157.80 |
| MnO(l) + 1/2SiS2(l) = MnS(l) + 1/2SiO2(l) | –171.80 | –169.91 | –167.99 |
The other reaction that should be taken into account is the well–known strong Second–Nearest–Neighbor (SNN) SRO between cations over anions. For example, in the MnO–SiO2 liquid, the maximum SNN SRO occurs near the Mn2SiO4 composition where Si4+ cations prefer to have Mn2+ cations in their second coordination shell (equivalent to a model of Mn2+ cations and
Si
O
4
4-
orthosilicate anions). This is taken into account by the following SNN pair exchange reaction:
|
(Mn-O-Mn)+(Si-O-Si)=2(Mn-O-Si) Δ
g
MnSi/OO
| (6) |
In order to treat both FNN and SNN SRO simultaneously, various quadruplet “clusters” that consist of two cations and two anions such as MnMn/OO, MnFe/OO, FeFe/SS, FeSi/SS, MnSi/OS, SiSi/SS,
etc., are considered as basic entities of the model. Therefore, there are total 18 different quadruplets in the present MnO–FeO–MnS–FeS–SiO
2 system. These quadruplets are distributed randomly over “quadruplet” sites. A complete mathematical description of the model is given by Pelton
et al.28) The Gibbs energy of the solution is given by:
|
G
L
=
∑
i,j=
Mn
2+
,
Fe
2+
,
Si
4+
k,l=
O
2-
,
S
2-
n
ij/kl
g
ij/kl
-TΔ
S
config
| (7) |
where
nij/kl and
gij/kl are the number of moles and the molar Gibbs energy of the “
ij/kl” quadruplets, and Δ
Sconffig is the configurational entropy of mixing, which is given by randomly distributing the quadruplets over the sublattices, taking into account the fact that anion–cation pairs are shared among quadruplets. Because the exact mathematical expression for such distribution is not known, the configurational entropy is approximated by a cluster–variational equation as given in Ref.
28). Taking into account such SRO in the thermodynamic modeling has been shown to be important in order to obtain better prediction in multicomponent solutions.
29,35,36,37)
In order to calculate the Gibbs energy of the solution, it is necessary to evaluate all gij/kl. The way of calculation for those gij/kl from Gibbs energies of pure liquid components (oxides and sulfides), the Gibbs energies of SNN pair exchange reactions such as ΔgMnSi/OO given in Eq. (5), and FNN and SNN coordination numbers (zi and Zi) is well described in the previous articles,23,28,29) thus will not be repeated here.
Originally, all the Gibbs energies of SNN pair exchange reactions were set to zero, except for Δgij/OO in oxide systems which have been developed for many years by Pelton and co-workers.9,10,38,39) This thermodynamic model has been successfully applied to calculate sulfide capacity (CS = (%S)
(
p
O
2
/
p
S
2
)
) of the MnO–FeO–SiO2 and its sub–systems with no adjustable model parameters.29) As will be discussed in Sec. 6.1, however, one additional model parameter was added to the Fe–O–S system and another one parameter to the Fe–Si–O–S system later40) in order to obtain better agreement with experimental phase diagram data obtained by Yazawa and Kameda.8) However, its effect on the calculated sulfide capacity is not significant. All the model parameters necessary for the calculation of the Gibbs energy of the liquid phase are shown in Table 3.
Table 3.Gibbs energy model parameters for liquid phase (J/mol of pairs).
| Parametera | (Mn2+, Fe2+, Si4+)(O2–, S2–) | Reference |
|---|
|
Δ
g
SiFeMn/OO
|
-8 368(
Z
Si
4+
n
Si
4+
∑
i=cation
Z
i
n
i
)
(
Z
Mn
2+
n
Mn
2+
∑
i
=Mn
2+
,
Fe
2+
Z
i
n
i
)
|
10) |
|
Δ
g
FeFe/OS
|
4184 | 40) |
|
Δ
g
FeSi/OO(S)
101
|
146 440(
Z
Fe
2+
n
Fe
2+
∑
i=cation
Z
i
n
i
)
(
n
S
2-
n
O
2-
+
n
S
2-
)
|
40) |
|
Z
Mn
2+
=
Z
Fe
2+
=
Z
O
2-
=
1.3774
b
,
Z
Si
4+
=
2.7548
b
,
Z
S
2-
=
1.3774
c
, ζ=
1.0
d
|
a Δ
gij/OO for binary oxide systems are taken from.
9,38,39)
b SNN coordination numbers of cations and oxygen are defined in.
9,38)
c SNN coordination number of sulfur is defined in.
29)
d Ratio of FNN to SNN coordination number of all cation and anions are defined in
28) and taken from.
29)
6. Discussions
Experimental results in the Sec. 4.2.2 showed that the liquid composed of MnO–MnS–FeO–FeS–SiO2 saturated by SiO2 formed a wide miscibility gap between oxide–rich liquid and sulfide–rich liquid. When these two liquid phases were in equilibrium with each other, Mn was enriched in the oxide–rich liquid, relative to the sulfide–rich liquid. Although such preferential distribution of Mn in the oxide–rich phase is not practically desirable, it is worthwhile to elucidate the mechanism of the Mn distribution in these two liquid phase. In this section, those experimental observations are analyzed in the aid of thermodynamic modeling approach introduced in the Sec. 5, and the mechanism of the preferential Mn distribution in oxide–rich phase is discussed.
6.1. The FeO–FeS–SiO2 System and Comparison with the MnO–MnS–SiO2 System
Figure 4 also shows a calculated isothermal section of the FeO–FeS–SiO2 system. Calculated compositions of immiscible liquids at SiO2 saturation are in reasonable agreement with the data measured in the present study. Also, calculated saturation boundary of SiO2 in sulfide–rich liquid (at high FeS concentration) and that in oxide–rich liquid (at low FeS concentration) are also in favorable agreement with the data measured in the present study. In order to obtain better agreement with the experimental data obtained by Yazawa and Kameda,8) two model parameters were added to the Gibbs energy of the liquid phase (Eq. (7)) as shown in Table 3 (ΔgFeFe/OS × nFeFe/OS and
Δ
g
FeSi/OO(S)
101
×
n
FeSi/OO
). The introduction of those parameters is also justified by the experimental data obtained in the present study.
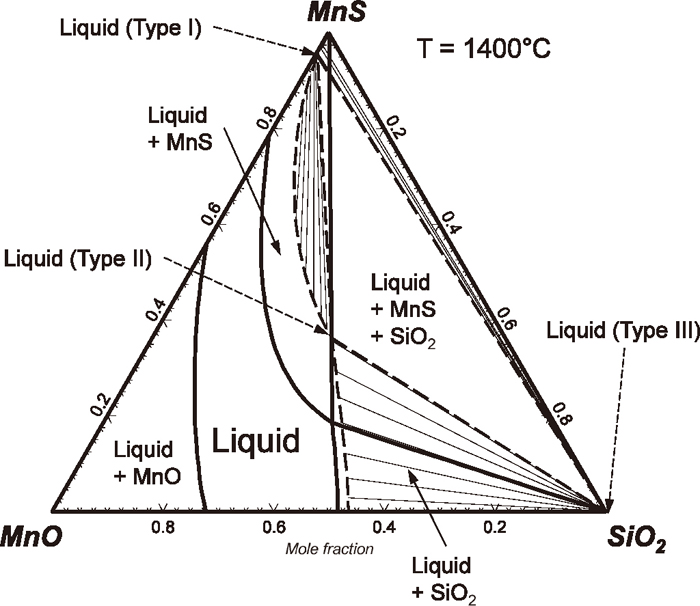
The phase diagram of the FeO–FeS–SiO2 system may be compared with the phase diagram of the MnO–MnS–SiO2 system. Figure 6 shows a calculated phase diagram of the MnO–MnS–SiO2 system29) which has been validated by the experimental data of Woo et al.6) Contrary to the FeO–FeS–SiO2 system, the MnO–MnS–SiO2 system does not exhibit a miscibility gap (oxide–rich and sulfide–rich) in the liquid phase. However, there is a tendency of forming a metastable miscibility gap in the liquid, as evidenced by sudden expansion of two-phase region (liquid + MnS) as SiO2 added to MnO–MnS binary liquid. This implies a strong repulsion between MnS and SiO2 in the liquid phase.34) The miscibility gap is actually hidden by the high melting temperature of solid MnS. Consequently, the metastable miscibility gap in the liquid phase was calculated by suppressing all solid phases during the thermodynamic calculation, and the calculated metastable miscibility gap is shown as dashed lines in the figure. There is 3–phase metastable equilibrium composed of 1) a liquid composed of MnS with little of MnO and SiO2 (type I), 2) the other liquid composed of MnO, SiO2, and MnS (type II), and 3) another liquid of almost pure SiO2 (type III). Thin lines represent tie-lines in the metastable miscibility gap. Tie-lines connecting the liquid 1) and the liquid 3) tells a very strong repulsion between MnS and SiO2 in the liquid phase as mentioned above.
From the above facts, it is expected that the liquid MnO–FeO–MnS–FeS–SiO2 saturated by SiO2 also exhibits a two-phase immiscibility (type I and type II), and the present thermodynamic model should explain such immiscibility.
6.2. MnO–MnS–FeO–FeS–SiO2
Full lines shown in the Fig. 5 is calculated miscibility gap between oxide–rich liquid and sulfide–rich liquid in equilibrium with SiO2. Calculated lines are in reasonable agreement with the experimentally determined immiscibility. Only liquid phase immiscibility under SiO2 saturation was calculated, hence phase equilibria involving other solid phases were not considered in the present calculation.
Calculated tie-lines between these two liquid phases are also shown in the figure as thin solid lines. As mentioned before, those tie-lines, whether they were measured or calculated, are not necessarily on the plane of the phase diagram. Therefore, it may not be right to superimpose such tie-lines here, but it is intended to show how the two–phase equilibria result in Mn distribution between these two liquid phases. Both experiment and calculation show that Mn is distributed preferentially in oxide–rich liquid phase relative to the sulfide–rich liquid phase, according to the direction of the tie-lines. In other words, Fe is preferentially associated with S to form FeS–rich sulfide liquid, while Mn attracts S less than Fe does, residing in the oxide–rich liquid. This is contrary to the common understanding that Mn is more reactive with S than Fe is. In the next section, it will be elucidated how such discrepancy is possible to occur in the present MnO–MnS–FeO–FeS–SiO2 liquid phase in the aid of thermodynamic modeling.
6.3. Solution Behavior
Irrespective of whether the liquid is a single phase or not (two–phase system, for instance), the distribution of Mn and Fe in the liquid phase(s) can be represented by the following reaction:
|
FeS(l)+MnO(l)=MnS(l)+“FeO”(l) Δ
G
FeMn/OS
°,exchange
| (5) |
The Gibbs energy change of the above reciprocal exchange reaction
Δ
G
FeMn/OS
°
is shown in
Table 2. As the
Δ
G
FeMn/OS
°
is negative (
e.g., −10.19 kJ/mol at 1400°C), the reaction tends to proceed to the righthand side to some extent. Therefore, MnS (or Mn–S FNN pair) is preferred to FeS (Fe–S FNN pair) in the liquid. Then, it may be thought that if the liquid phase is split into two phases, the sulfide–rich liquid would contain more Mn than the oxide–rich liquid does. However, the experimental results obtained in the present study show the opposite tendency. In order to resolve this apparent controversy, clarification of the role of SiO
2 in the liquid phase under consideration is in order.
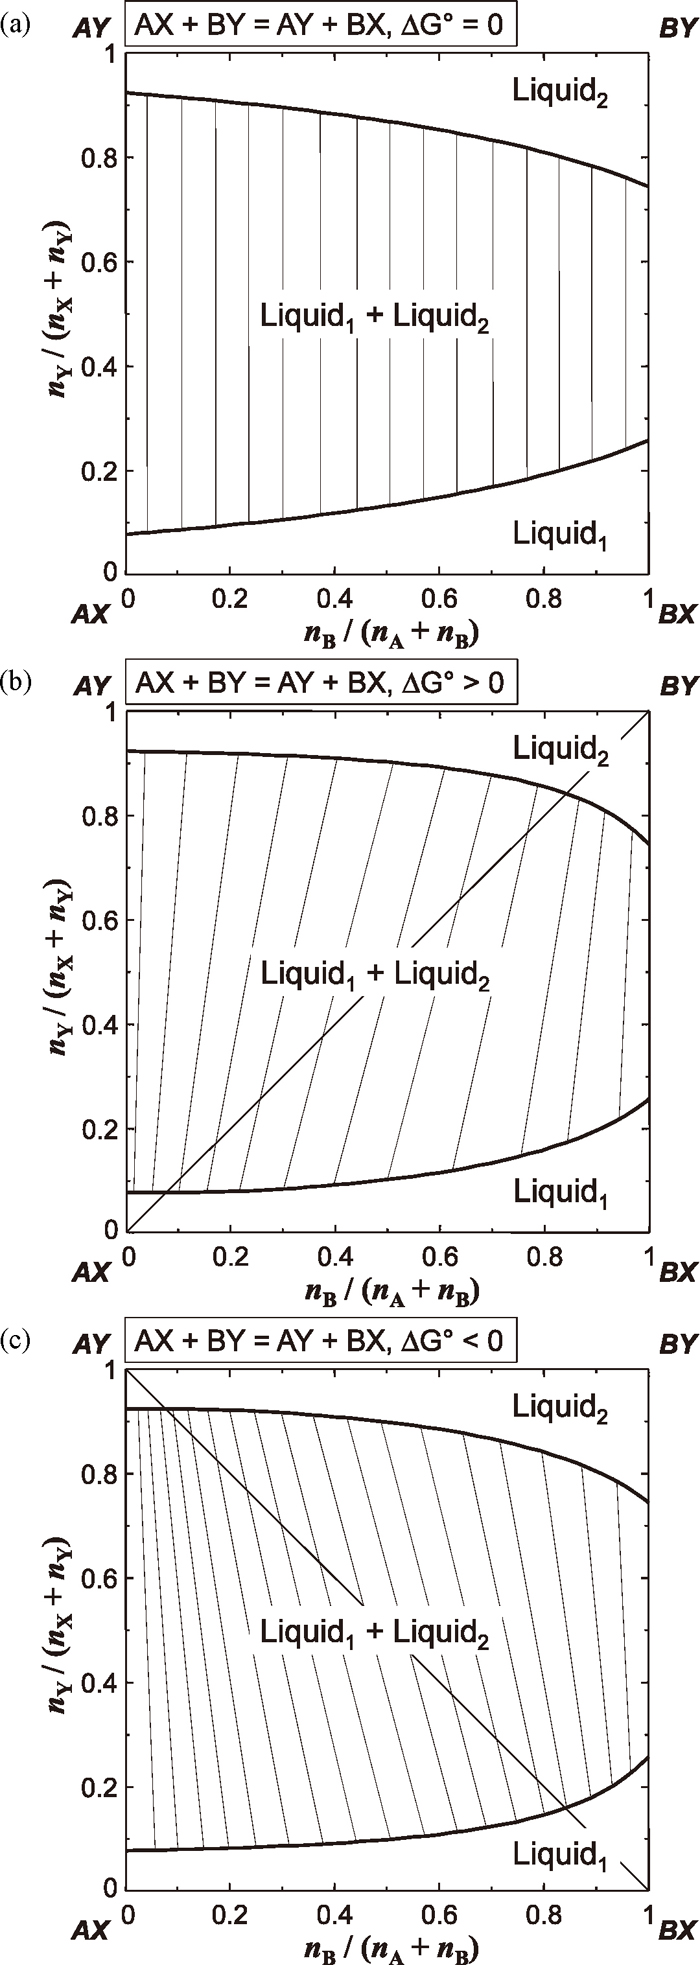
Before the consideration of the role of SiO2, it is first necessary to understand the relationship between the sign of the Gibbs energy of reciprocal exchange reaction and direction of tie-lines in two-liquid phase region. Suppose that a following reciprocal exchange reaction is considered in a hypothetical reciprocal ternary solution AX–BX–AY–BY (or (A,B)(X,Y)):
|
AX+BY=AY+BX Δ
G
AB/XY
°,exchange
| (8) |
Also it is assumed that AX–AY and BX–BY sub-binary solutions exhibit miscibility gaps, respectively, while other sub-binary solutions are assumed to be ideal.
Figure 7 shows the calculated phase diagrams (isothermal sections) of the hypothetical AX–BX–AY–BY system using the MQMQA when the Gibbs energy of reciprocal exchange reaction (
Δ
G
AB/XY
°,exchange
) is zero, positive, and negative, respectively. Details of model calculation using the MQMQA is listed in
Table 4. According to this example model calculations, it is seen that 1) when
Δ
G
AB/XY
°,exchange
is zero, tie-lines in the two-liquid region are parallel to the direction of AX–AY and BX–BY sides, 2) when
Δ
G
AB/XY
°,exchange
is positive, tie-lines in the two–liquid region rotate to the direction of a stable diagonal connecting AX and BY, and 3) when
Δ
G
AB/XY
°,exchange
is negative, tie-lines in the two–liquid region rotate to the other direction of the other stable diagonal connecting AY and BX. It is clear that the sign of
Δ
G
AB/XY
°,exchange
determines the stable pairs of stable diagonal, and the direction of tie–lines. The absolute value of
Δ
G
AB/XY
°,exchange
the decides how much the tie–lines rotate toward the direction of the stable diagonal. Now, in the present system MnO–MnS–FeO– FeS–SiO
2, the sulfides (MnS and FeS) may be regarded as AY and BY, and MnO saturated by SiO
2 and FeO saturated by SiO
2 may be regarded as AX and BX in the
Fig. 7.
Table 4.Parameters of the MQMQA used for the calculations shown in
Fig. 7.
| Type | zia | Zia |
Δ
g
AB/OS
°,exchange
|
Δ
g
AA/XY
|
Δ
g
BB/XY
|
|---|
| (J/mol) | (kJ/mol of pairs) |
|---|
| I | 12 | 6 | 0 | 15 | 12 |
| II | 12 | 6 | –15 | 15 | 12 |
| III | 12 | 6 | 15 | 15 | 12 |
a zi and
Zi are the FNN and SNN coordination numbers, respectively, required in the MQMQA, and definitions can be found in.
28)
Although the Reaction (5) is considered to be a main chemical reaction controlling Mn distribution in two–liquid phases, the
Δ
G
FeMn/OS
°,exchange
shown in Table 2 was only for the case where all four components are in their (pure) standard states. When those components exist in the liquid MnO–MnS–FeO–FeS–SiO2 phase, concentration of SiO2 in the oxide–rich liquid at SiO2 saturation is considerable as can be seen in Table 1. On the other hand, concentration of SiO2 in the sulfide–rich liquid is extremely low as evidenced by the present experimental data (Table 1). This is also due to very strong reciprocal exchange reactions (MnO + SiS2 = MnS + SiO2) proceeding to righthand side. Such high concentration of SiO2 in the oxide components does affect the thermodynamic stability of MnO and FeO, and the apparent Gibbs energy change of the above reaction,
Δ
G
FeMn/OS
°,exchange
should be altered. Therefore, rather than considering the Reaction (5), the following reaction modified from the Reaction (5) is necessary to be considered:
|
FeS
(l)
SiO
2
+MnO
(l)
SiO
2
=MnS
(l)
SiO
2
+"FeO"
(l)
SiO
2
Δ
G
(9)
| (9) |
where subscript
SiO2 denotes the SiO
2 saturation condition. FeS(l)
SiO2 and MnS(l)
SiO2 can be regarded as almost pure FeS and MnS (Refer to
Table 1). Gibbs energies of MnO(l)
SiO2 and “FeO”(l)
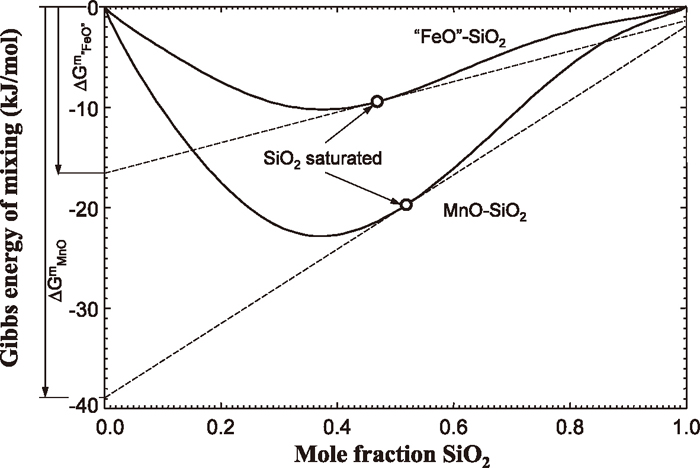
SiO2 are now estimated as follows. Thermodynamic interaction between SiO
2–MnO or SiO
2–“FeO” is represented by Gibbs energy of mixing, and those Gibbs energies of mixing calculated by the Modified Quasichemical Model
9,38) at 1400°C are shown as full lines in
Fig. 8. SiO
2 saturation at the same temperature are marked with circles. Therefore, the new components MnO(l)
SiO2 and “FeO”(l)
SiO2 are sorts of hypothetical components in each liquid phase at concentration marked with the circles at 1400°C. Molar Gibbs energies of the MnO(l)
SiO2 and the “FeO”(l)
SiO2 are then estimated as partial Gibbs energies of MnO in MnO–SiO
2 and “FeO” in “FeO”–SiO
2 at the SiO
2 saturated concentrations, respectively:
|
G
i
=
G
i
°
+Δ
G
i
m
| (10) |
where
Gi,
G
i
°
, and Δ
G
i
m
are the partial Gibbs energy, the standard Gibbs energy, and the partial Gibbs energy of mixing, of
i (= MnO or “FeO”), per mole of components.
Δ
G
i
MnO
and
Δ
G
i
“FeO”
at the SiO
2 saturation are marked with squares in the figure. As the interaction between MnO and SiO
2 is more exothermic than that between “FeO” and SiO
2, the partial Gibbs energy of MnO is lowered more than that of “FeO”. This now alters the Gibbs energy of the Reaction (5) as much as 23 kJ/mol, and Δ
G(9) becomes positive (12.62 kJ/mol), which is different in sign to the
Δ
G
FeMn/OS
°,exchange
(−10.19 kJ/mol). Therefore, the Reaction (9) now proceeds to the lefthand side, and Fe–S FNN pair in the liquid becomes more favorable. Moreover, generally stronger Mn–S FNN pair in MnO–MnS–FeO–FeS liquid becomes weaker by the presence of SiO
2 as a result of the interaction between MnO and SiO
2. In other words, Mn is bound by Si through intervening of O. The more positive the Δ
G(9) is, the weaker the Mn–S FNN pair becomes. This results in sulfide–rich liquid of relatively high Fe concentration (lower R(Mn)) and oxide–rich liquid of relatively high Mn (higher R(Mn)). Such phenomena can only be treated thermodynamically when the FNN SRO and SNN SRO are simultaneously taken into account as is in the MQMQA.
6.4. Possibility to Utilize “Sulfide” Route in the Production of Low P–FeMn Alloy
In order to apply the two–phase separation (sulfide–rich liquid and oxide–rich liquid) in the production of low P–FeMn alloy, there are a number of points to be considered. First of all, it is necessary to confirm whether P does not dissolve into sulfide–rich liquid, while most P remains in oxide–rich liquid. This has well been confirmed by Kim et al.3,4,5)
Secondly, Mn concentration in the sulfide–rich liquid is generally low as observed in the present study. This was also the case in those reported by Kim et al.3,4,5) If a FeMn alloy, which usually contains more than 58 mass pct. Mn,1) is to be obtained from the sulfide–rich liquid after removal of P, then it is desirable to increase Mn concentration in the sulfide–rich liquid. Recently, Kim et al.5) reported that increasing pS2 increased the concentration of Mn in sulfide–rich liquid. However, further research on this topic is still necessary to increase the distribution of Mn in the sulfide–rich liquid. According to the result analyzed in the present study, the main reason of low Mn distribution in the sulfide–rich liquid is a stronger interaction between MnO and SiO2 in the oxide–rich liquid than that between FeO and SiO2. This lowers a chance for S to form MnS. Therefore, a fiux agent which effectively interacts with SiO2, leaving MnO available to form MnS would be necessary to increase the distribution of Mn in the sulfide–rich liquid.
Collection of sulfide–rich liquid from the two–phase mixture is also to be considered. Although a mechanical phase separation between oxide–rich liquid and sulfide–rich liquid has been observed only for limited number of samples in the present study, it seems that the mechanical phase separation by natural flotation of the lighter phase (oxide–rich liquid) seems not easy in the present case probably due to similar densities between the two phases. Introducing strong turbulence in the liquid phases seems necessary to induce coalescence among small liquid particles, consequently increase buoyancy force for the lighter phase.
7. Conclusions
In order to find a new way to produce low P–FeMn alloy, two–phase separation in liquid phase between oxide–rich liquid and sulfide–rich liquid was proposed.3,4,5) In the present study, a relevant phase equilibria in the MnO–FeO–MnS–FeS–SiO2 liquid phase was investigated to find conditions for the two–phase separation in the liquid phase and to elucidate the Mn distribution in these two liquid phases. It was found that the liquid phase separates into oxide–rich liquid and sulfide–rich liquid MnO–MnS–FeO–FeS–SiO2 system at SiO2 saturation. Size of the miscibility gap in the liquid phase did not change considerably as temperature increases from 1200°C to 1400°C. Concentration of Mn defined as
R
Mn
=
n
Mn
n
Fe
+
n
Mn
in the sulfide–rich liquid was always lower than RMn in the oxide–rich liquid. According to the thermodynamic analysis using a thermodynamic model in the framework of the MQMQA, the low Mn distribution in the sulfide–rich liquid was attributed to the fact that a strong interaction between MnO and SiO2 in the oxide–rich liquid. This lowers MnS formation (or Mn–S FNN pair) in the liquid state. Therefore, an effective flux agent which interacts with SiO2 leaving MnO available to form MnS would be necessary to increase the distribution of Mn in the sulfide–rich liquid. In order to utilize the two–phase separation in the liquid phase, increasing Mn concentration in the sulfide–rich liquid, and separation of the sulfide–rich liquid from the two–phase mixture are suggested to be further investigated.
Acknowledgements
Financial support of Graduate Institute of Ferrous Technology, Pohang University of Science and Technology through an Initiative Research Program of the year 2010 is greatly acknowledged. One of the authors (YBK) thanks to Prof. Arthur D. Pelton (École Polytechnique de Montréal, Montréal, Canada) for constructive discussions and suggestions.
References
- 1) S. E. Olsen, M. Tangstad and T. Lindstad: Production of Manganese Ferroalloys, Tapir Academic Press, Trondheim, Norway, (2007), 14.
- 2) J.-H. Shin and J. H. Park: Metall. Mater. Trans. B, 43B (2012), 1243.
- 3) S.-J. Kim, T. Hotta, H. Shibata and S. Kitamura: CAMP–ISIJ, 23 (2010), 897, CD-ROM.
- 4) S.-J. Kim, H. Shibata, N. Maruoka, S. Kitamura and K. Yamaguchi: High Temp. Mater. Proc., 30 (2011), 425.
- 5) S.-J. Kim, H. Shibata, J. Takekawa, S.-Y. Kitamura, K. Yamaguchi and Y.-B. Kang: Metall. Mater. Trans. B, 43B (2012), 1069.
- 6) D.-H. Woo, Y.-B. Kang, H. Gaye and H.-G. Lee: ISIJ Int., 49 (2009), 1490.
- 7) Y. I. Ol’shanskii: Diklady Akademii Nauk SSSR, 70 (1950), 245.
- 8) A. Yazawa and M. Kameda: Tech. Rep. Tohoku Univ., 18 (1953), 40.
- 9) E. Jak, P. Hayes, A. Pelton and S. Decterov: Int. J. Mater. Res. (formerly Z. Metallkd.), 98 (2007), 847.
- 10) Y.-B. Kang and I.-H. Jung: Proc. 8th Int. Conf. on Molten Slags, Fluxes and Salts, Gecamin Ltd., Santiago, Chile, (2009), 460.
- 11) W. Ölsen and E. Schümann: Taschenbuch für Eisenhüttenleute, 5th ed., cited in 41).
- 12) E. Silverman: Trans. Meter. Soc. AIME, 221 (1961), 512.
- 13) R. Vogel: Arch. Eisenhüuttenwes, 36 (1965), 481.
- 14) A. Hasegawa, K. Morita and N. Sano: Tetsu-to-Hagané, 81(1995), 8.
- 15) D.-H. Woo and H.-G. Lee: J. Am. Ceram. Soc., 93 (2010), 2098.
- 16) Y.-B. Kang, I.-H. Jung, S. A. Decterov, A. D. Pelton and H.-G. Lee: ISIJ Int., 44 (2004), 975.
- 17) Y.-B. Kang, I.-H. Jung, S. A. Decterov, A. D. Pelton and H.-G. Lee: ISIJ Int., 44 (2004), 965.
- 18) E. Jak and P. Hayes: Proc. 7th Int. Conf. on Molten Slags, Fluxes and Salts, South African Inst. Mining Metallurgy, Johannesburg, Rep. of South Africa, (2004), 85.
- 19) Y.-B. Kang and H.-G. Lee: ISIJ Int., 45 (2005), 1543.
- 20) Y.-B. Kang and H.-G. Lee: ISIJ Int., 45 (2005), 1552.
- 21) M.-S. Kim, Y.-B. Kang, W.-Y. Cha and H.-G. Lee: J. Am. Ceram. Soc., 95 (2012), 2059.
- 22) B. Zhao, P. C. Hayes and E. Jak: Metall. Mater. Trans. B, 42B (2011), 978.
- 23) R. Piao, H.-G. Lee and Y.-B. Kang: Acta Mater., 61 (2013), 683.
- 24) M. Hillert: J. Phase Equil., 18 (1997), 249.
- 25) A. D. Pelton: Phase Transformation in Materials, Ch.1., ed. by G. Kostortz, Wiley–VCH Verlag GmbH, Weinheim, Germany, (2001), 56.
- 26) C. W. Bale, P. Chartrand, S. A. Degterov, G. Eriksson, K. Hack, R. Ben Mahfoud, J. Melançon, A. D. Pelton and S. Petersen: Calphad, 26 (2002), 189.
- 27) C. W. Bale, E. Bélisle, P. Chartrand, S. A. Decterov, G. Eriksson, K. Hack, I.-H. Jung, Y.-B. Kang, J. Melançon, A. D. Pelton, C. Robelin and S. Petersen: Calphad, 33 (2009), 295.
- 28) A. D. Pelton, P. Chartrand and G. Eriksson: Metall. Mater. Trans. A, 32A (2001), 1409.
- 29) Y.-B. Kang and A. D. Pelton: Metall. Mater. Trans. B, 40B (2009), 979.
- 30) P. Chartrand and A. D. Pelton: Metall. Mater. Trans. A, 32A (2001), 1361.
- 31) P. Chartrand and A. D. Pelton: Metall. Mater. Trans. A, 32A (2001), 1385.
- 32) P. Chartrand and A. D. Pelton: Metall. Mater. Trans. A, 32A (2001), 1417.
- 33) Y.-B. Kang and J. H. Park: Metall. Mater. Trans. B, 42B (2011), 1211.
- 34) Y.-J. Kim, D.-H. Woo, H. Gaye, H.-G. Lee and Y.-B. Kang: Metall. Mater. Trans. B, 42B (2011), 535.
- 35) A. D. Pelton and Y.-B. Kang: Int. J. Mater. Res. (formerly Z. Metallkd.), 98 (2007), 907.
- 36) Y.-B. Kang and A. D. Pelton: Calphad, 34 (2010), 180.
- 37) E. A. Lass, A. Zhu, G. Shiflet and S. J. Poon: Acta Mater., 58 (2010), 5460.
- 38) G. Eriksson, P. Wu, M. Blander and A. D. Pelton: Can. Metall. Q., 33 (1994), 13.
- 39) P. Wu, G. Eriksson and A. D. Pelton: J. Am. Ceram. Soc., 76 (1993), 2065.
- 40) Y.-B. Kang and A. D. Pelton: Modeling FeO–FeS–SiO2 system, unpublished research, CRCT, École Polytechniqe de Montréal, (2009).
- 41) M. Kowalski, P. J. Spencer and D. Neuschütz: Slag Atlas, VDEh, Düsseldorf, Germany, (1995) 209.