Abstract
Tailored properties in hot press forming process (HPF) were investigated with focus on phase transformation characteristics and deformation behavior of constituent base materials for the Tailor Welded Blank (TWB-HPF) and partial quenching (PQ-HPF) approaches. The former uses sheets with different hardenabilities, which results in graded mechanical properties after HPF. The latter uses a single sheet but different heat treatment conditions, which eventually induce the same effect as the first approach. Preliminary dilatometric experiment was conducted to investigate the phase transformation characteristics of the two base metals for TWB-HPF. U-channel was formed by draw bending with the two approaches. For PQ-HPF, several initial tool temperatures varying from room to 450°C were investigated. Thermo-mechanical finite element (FE) analyses of the HPF process with metallurgical considerations in the constitutive model were performed for parts exhibiting tailored properties. These analyzes included the evaluation of heat transfer characteristics and the microstructure evolutions under HPF conditions. A thermodynamic calculation program was used to determine the thermo-physical, physical and metallurgical properties for various microstructures and temperatures. FE analyzes of the hot press forming with phase transformation considerations were conducted using the commercial software DEFORMTM-3D with the DEFORMTM-HT module. The combined experimental and simulation results provided an understanding, on the one hand, of the role of phase transformation in strengthening the material and reducing springback for the TWB-HPF approach and, on the other hand, of temperature on phase transformation characteristics of HPF steel for the PQ-HPF approach.
1. Introduction
Hot press forming technology takes advantage of improved formability by forming sheet metals at high temperature. The use of HPF parts, which meet the requirements of crash performance and weight reduction in automotive applications, keeps increasing.
One of the recent challenges of the HPF process is to produce parts with different mechanical properties in various regions. For instance, an innovative trend in this technology is to tailor mechanical properties by producing location dependent phase transformation kinetics in the part.1) The manufacturing of a single part with graded mechanical properties can be achieved using either the Tailor Welded Blanks (TWB) technique or partial quenching (PQ). In the former, sheets with different hardenabilities are joined by welding and formed under HPF condition (TWB-HPF), while for the latter, different cooling histories are applied to different regions of the same sheet (PQ-HPF).2,3,4,5,6) Normally, the microstructure of the sheet is mostly martensite at a cooling rate usually higher than 30°C/s in the typical HPF process for boron added steels.7,8)
Since the HPF process involves complex material behavior during forming and quenching, the optimization of the process parameters is very challenging. Moreover, finding optimum process conditions from experimental trial-and-error only is very costly because each new trial requires the redesign and manufacturing of special tools. Therefore, the use of numerical simulations such as finite element (FE) method is necessary to enhance efficiency in the process optimization stage. Naderi et al.9) performed coupled thermo-mechanical simulations of the forming and quenching processes using the commercial software ABAQUS and compared the predicted punch force and temperature distribution with experimental data. In their FE simulations, the tools were modeled using rigid elements, while the blank was discretized with eight node continuum elements. Xing et al.10) investigated the effects of blank holding force, punch clearance and die radius on the shape of a HPF part. They considered the entire HPF process in their simulations, including forming, quenching and springback. The thermal capacity and thermal expansion coefficients were assumed to be linear combinations of those of the different phases, weighted by the corresponding volume fractions. Behrens et al.11) conducted a virtual dilatometer experiment and a U-channel draw-bend test using a commercial FE software LS-Dyna for the simulation of HPF, with consideration of the phase transformation, in order to validate their thermo-elastic-plastic-metallurgical models. In another application of HPF to a real automotive component called flex plate, a process optimization through iterative FE simulations was conducted taking phase transformation into account as well.12) Lee et al.12) demonstrated that the stress produced during forming was significantly relaxed during cooling with the occurrence of martensitic transformation.
In the present work, two steel candidates with different phase transformation kinetics will be determined for both TWB-HPF and PQ-HPF approaches to get tailored mechanical properties. For TWB-HPF, instead of applying real TWB sheet, the study on two selected candidates will be performed. The TWB-HPF approach, using a boron added steel (HPF steel) and a high strength low alloy (HSLA) steel, can be implemented without changing the main HPF process conditions such as blank and tool temperatures. When the two materials undergo the same thermo-mechanical process, different phase transformation kinetics leads to a part with graded-mechanical properties. These properties and the dimensional accuracy after HPF, which have not been often assessed for tailored products, are evaluated in this work. The PQ-HPF approach is investigated with particular emphasis on the effect of the initial tool temperature on phase transformation and mechanical response of a boron added steel (HPF steel). In this study, in line with experiments FE simulations will be complementarily used to understand the detailed deformation behaviors in HPF conditions. The commercial software JMatPro Ver. 6.2 and DEFORMTM-3D Ver. 10.2, with the DEFORMTM-HT module, are used to compute the thermo-physical material properties and to perform the FE thermo-mechanical-metallurgical analysis, respectively.
2. Experimental Procedures
2.1. Materials
In this study, a 340Y HSLA steel and a HPF1470 boron steel, which is used in conventional HPF process, were selected as candidate materials for the TWB-HPF and PQ-HPF. The chemical compositions are [0.09 wt% C, 0.95 wt% Mn, and 0.28 wt% Si] for 340Y and [0.26 wt% C, 1.7 wt% Mn, 0.35 wt% Si, and 30 wt ppm B] for HPF1470. Both materials were cold-rolled down to a gauge of 1.5 mm. The HSLA steel, in which the transformation to martensite is prohibited under typical cooling rates encountered in HPF processes, exhibits a lower hardenability. The appropriateness of the two selected materials will be discussed in a later section.
2.2. Dilatometric Test
Dilatometric analyses were performed on a Theta Industries Dilatronic III to verify whether the two candidate materials followed the expected transformation characteristics. In these tests, induction heating and compressed air were used to control the heating temperature and the cooling rate, respectively. The microstructure was observed with a Leica DM6000 M optical microscope at a magnification of ×1000 to quantify the transformed phases after various heat treatments.
2.3. U-draw Bending Experiment
In this study, U-channel draw bending experiments were conducted as a HPF process with a TWB and initial tool temperature of 25°C, and with partial quenching (PQ) using different initial tool temperatures1. In all these experiments, the austenizing temperature and time were set to 930°C and 5 minutes, respectively. The blank temperature was measured from K-type thermo-couples inserted into the blank on the thickness-sided edges as shown in Fig. 1. After forming at typical HPF temperature, the cooling time of the formed part was set to 20 seconds. To verify the quality of the formed part, microscopic observations and coordinate measurements of the U-bent part were performed.

1 In real applications of the partial quenching (PQ) approach, a temperature gradient is established inside a single tool. However, in this study, a number of uniform initial tool temperatures were enforced to simplify the investigation of the tool temperature influence on the deformation and cooling characteristics of the HPF steel.
3. Finite Element Modeling
3.1. Thermo-mechanical-metallurgical Coupled Simulation
The hot working of metals such as hot forging, hot extrusion or HPF can be classified as a metallo-thermo-mechanical process. Simulations of these processes are rather complicated because of the concurrent interrelationship between the metallurgical, thermal and mechanical fields. For instance, the metallurgical field determines the thermal properties such as specific heat, conductivity and latent heat, which influence the temperature distributions in the workpiece. The mechanical field leads to the deformation and geometry evolution of the workpiece. The updated geometry, in turn, modifies the boundary conditions and affects the thermal field. Some important mathematical models involved in the simulations are described below.
The temperature field is governed by the heat transfer equation13)
|
ρ
c
T
˙
=
∂
∂
x
i
(
k
∂T
∂
x
i
)
+
σ
ij
ε
˙
ij
p
+∑
L
IJ
ξ
˙
IJ
| (1) |
where,
ρc,
k,
LIJ and
ξ
˙
IJ
are the heat capacity, thermal conductivity, latent heat and transformation rate, respectively. Here, I and J denote two different phases; for example,
ξ
˙
12
indicates the rate of transformed volume fraction from Phase 1 to Phase 2.
The total strain rate generated during forming and cooling can be decomposed into various individual strain contributions as follows14)
|
ε
˙
ij
total
=
ε
˙
ij
el
+
ε
˙
ij
pl
+
ε
˙
ij
thm
+
ε
˙
ij
vol
+
ε
˙
ij
tp
| (2) |
where,
ε
˙
ij
el
,
ε
˙
ij
pl
,
ε
˙
ij
thm
are the elastic, plastic and thermal strain rate, respectively, while is the
ε
˙
ij
vol
volumetric strain rate due to transformation. These quantities are calculated using the following equations
|
ε
˙
ij
el
=
1+ν
E
σ
˙
ij
-
ν
E
σ
˙
kk
δ
ij
| (3) |
|
ε
˙
ij
pl
=
λ
˙
∂F
∂
σ
ij
| (4) |
|
ε
˙
ij
thm
=α
T
˙
δ
ij
| (5) |
|
ε
˙
ij
vol
=∑
β
IJ
ξ
˙
IJ
δ
ij
| (6) |
where
βIJ is the transformation expansion coefficient from Phase I to Phase J and
δij is the Kronecker delta symbol.
An additional plastic strain related to the transformation
ε
˙
ij
tp
that may occur during cooling can be expressed as
|
ε
˙
ij
tp
=
3
2
K
IJ
dϕ (
ξ
IJ
)
d
ξ
IJ
ξ
˙
IJ
s
ij
, where ϕ(
ξ
IJ
) = (2-
ξ
IJ
)
ξ
IJ
| (7) |
as proposed by Leblond.
15) In
Eq. (7),
KIJ is a parameter called transformation plasticity coefficient,
sij is the deviatoric stress tensor and
ϕ is a correction function that depends on the transformed phase volume fraction
ξIJ.
16) The definition of
ϕ was taken from the Desalos’ proposal.
16)
In general, phase transformations in steels can take place diffusionally and non-diffusionally. The former is basically time-dependent such as the transformations from austenite to ferrite, pearlite and bainite. The latter is time-independent such as the transformation of austenite to martensite. Diffusional phase transformations in steels have typically been described by the JMAK kinetics equation,17,18,19) which is employed in the DEFORM software.
The JMAK equation inevitably requires data obtained from many phase transformation experiments with various cooling rates to create corresponding time-temperature-transformation (TTT) diagrams. As an alternative of the JMAK approach, the semi-empirical kinetics prediction model developed by Kirkaldy and Venugopalan (K-V) was used because of difficulty in creating TTT diagrams experimentally.
20,21) The expression of the kinetics, in a rate form for each transformation, is described as
where “
Comp” implies the chemical composition,
G is the austenite ASTM grain size,
T the temperature and
X the volume fraction of each phase.
In this study, the TTT diagrams of the considered steels were first obtained using commercial software JMatPro, in which the kinetics expression and thermodynamics are based on the K-V model.22,23) Then, the generated TTT diagrams are imported into the DEFORM software. The JMAK parameters are calculated from two C-curves for transformation start and finish in that TTT diagram. The chemical composition were already discussed in Section 2.1 and the austenite ASTM grain size, G, was assumed to be 8. Finally, the additivity rule was applied to convert isothermal reactions to non-isothermal decompositions.14)
For a diffusionless phase transformation, the martensite phase fraction, Xm, below the Ms temperature has been calculated using the Koistinen and Marburger24) empirical relationship
|
X
m
=
X
γ
AT
(1-exp(-0.001(Ms-
T
Q
)))
| (10) |
where,
X
γ
AT
is the austenite fraction,
TQ and
MS are the quenching and martensite start temperatures, respectively.
3.2. Determination of Thermal, Mechanical and Metallurgical Parameters
The results of a thermo-mechanical-metallurgical FE analysis depend on the accuracy of the constitutive description and thermal coefficients. However, the measurement of all these parameters is practically impossible. Therefore, in this study, the coefficients used in the FE simulations were selectively determined from experiments, and data previously reported or from thermodynamic database.
The physical and thermo-physical properties such as density, thermal expansion, thermal conductivity and specific heat, which are temperature and microstructure dependent, and the phase transformation kinetics, i.e., TTT or CCT diagrams, were predicted from the chemical compositions using the thermodynamic database in JMatPro. Moreover, the temperature and microstructure dependent mechanical properties, such as the flow stress-strain curve of each constituent phase, were also obtained from this software. An extensive database was created during the development of JMatPro for the calculation of physical and thermo-physical properties of various phases. For example, the thermo-physical properties including Young’s modulus (E), Poisson’s ratio (ν), heat capacity (ρc), thermal conductivity (k) and thermal expansion coefficient (α) for the selected materials were calculated as a function of temperature and phase. They are listed in Tables 1 and 2. A linear interpolation as a function of temperature was performed between each known value. The transformation expansion coefficient (mm/mm), latent heat of each phase (10–6 N/mm2) and transformation plasticity coefficient (MPa–1) were also approximated using polynomials
|
β
IJ
=
A
o
+
A
1
T +
A
2
T
2
| (11) |
|
L
IJ
=
B
o
+
B
1
T +
B
2
T
2
+
B
3
T
3
+
B
4
T
4
+
B
5
T
5
+
B
6
T
6
| (12) |
|
K
IJ
=
C
o
+
C
1
T +
C
2
T
2
+
C
3
T
3
+
C
4
T
4
| (13) |
in which the temperature is expressed in °C. The coefficients of each equation are listed in
Tables 3,
4,
5.
Table 1.Thermo-physical properties of various phases for HPF1470 steel.
| Temperature [,°C] | 25 | 100 | 300 | 500 | 700 | 900 | 950 |
|---|
| E [GPa] | A | 198 | 191 | 173 | 155 | 136 | 116 | 111 |
| F | 209 | 206 | 192 | 170 | 142 | 111 | 103 |
| P,B | 209 | 206 | 192 | 171 | 143 | 112 | 104 |
| M | 209 | 206 | 192 | 170 | 142 | 111 | 103 |
| ν | A | 0.294 | 0.298 | 0.310 | 0.322 | 0.333 | 0.345 | 0.348 |
| F | 0.290 | 0.293 | 0.301 | 0.309 | 0.317 | 0.324 | 0.326 |
| P,B | 0.289 | 0.292 | 0.300 | 0.307 | 0.315 | 0.323 | 0.325 |
| M | 0.290 | 0.293 | 0.301 | 0.308 | 0.316 | 0.324 | 0.326 |
| k [N/s·K] | A | 17.0 | 18.0 | 20.4 | 22.8 | 25.2 | 27.7 | 28.3 |
| F | 43.4 | 44.1 | 42.4 | 37.5 | 32.6 | 30.1 | 29.9 |
| P,B | 47.7 | 47.0 | 42.8 | 37.1 | 31.9 | 29.6 | 29.5 |
| M | 43.4 | 44.0 | 42.3 | 37.5 | 32.6 | 30.0 | 29.9 |
| ρc [N/mm2·K] | A | 3.7 | 3.8 | 4.1 | 4.3 | 4.5 | 4.6 | 4.7 |
| F | 3.5 | 3.7 | 4.4 | 5.3 | 7.3 | 5.5 | 5.4 |
| P,B | 3.5 | 3.8 | 4.4 | 5.3 | 7.4 | 5.9 | 5.9 |
| M | 3.5 | 3.7 | 4.4 | 5.3 | 7.4 | 5.5 | 5.4 |
| α [10–5] | A | 2.51 | 2.51 | 2.51 | 2.52 | 2.52 | 2.53 | 2.53 |
| F | 1.28 | 1.30 | 1.37 | 1.44 | 1.52 | 1.59 | 1.61 |
| P,B | 1.25 | 1.27 | 1.35 | 1.42 | 1.52 | 1.63 | 1.67 |
| M | 1.27 | 1.29 | 1.36 | 1.44 | 1.51 | 1.58 | 1.60 |
Table 2.Thermo-physical properties of various phases for 340Y steel.
| Temperature [,°C] | 25 | 100 | 300 | 500 | 700 | 900 | 950 |
|---|
| E [GPa] | A | 197 | 191 | 173 | 154 | 135 | 115 | 110 |
| F | 209 | 206 | 192 | 170 | 142 | 111 | 103 |
| P,B | 209 | 206 | 192 | 170 | 142 | 111 | 103 |
| M | 209 | 206 | 192 | 170 | 142 | 111 | 103 |
| ν | A | 0.294 | 0.298 | 0.310 | 0.322 | 0.334 | 0.346 | 0.349 |
| F | 0.290 | 0.293 | 0.301 | 0.309 | 0.317 | 0.325 | 0.326 |
| P,B | 0.290 | 0.293 | 0.300 | 0.308 | 0.316 | 0.324 | 0.326 |
| M | 0.290 | 0.293 | 0.301 | 0.309 | 0.317 | 0.324 | 0.326 |
| k [N/s·K] | A | 17.3 | 18.2 | 20.6 | 23.0 | 25.3 | 27.7 | 28.3 |
| F | 52.1 | 51.1 | 46.0 | 39.2 | 33.5 | 30.5 | 30.2 |
| P,B | 53.4 | 52.0 | 46.0 | 39.0 | 33.2 | 30.5 | 30.2 |
| M | 52.1 | 51.1 | 46.0 | 39.2 | 33.4 | 30.5 | 30.2 |
| ρc [N/mm2·K] | A | 3.7 | 3.8 | 4.1 | 4.3 | 4.5 | 4.6 | 4.7 |
| F | 3.5 | 3.7 | 4.4 | 5.3 | 7.2 | 5.6 | 5.4 |
| P,B | 3.5 | 3.7 | 4.4 | 5.3 | 7.3 | 6.0 | 5.4 |
| M | 3.5 | 3.7 | 4.4 | 5.3 | 7.2 | 5.6 | 5.4 |
| α [10–5] | A | 2.53 | 2.53 | 2.54 | 2.54 | 2.55 | 2.55 | 2.55 |
| F | 1.26 | 1.28 | 1.35 | 1.43 | 1.50 | 1.58 | 1.59 |
| P,B | 1.25 | 1.27 | 1.35 | 1.42 | 1.51 | 1.62 | 1.63 |
| M | 1.26 | 1.28 | 1.35 | 1.43 | 1.50 | 1.57 | 1.59 |
Table 3.Coefficients of
Eq. (11) for each phase transformation and materials. 1 and 3 denote HPF1470 and 340Y. (A(Austenite), F(Ferrite), P(Pearlite), and B(Bainite)).
| 1:A-F | 1:A-P | 1:A-B | 1:A-M | 3:A-F | 3:A-P | 3:A-B | 3:A-M |
|---|
| Ao | 0.01235 | 0.01095 | 0.01095 | 0.01212 | 0.01238 | 0.01198 | 0.01198 | 0.01231 |
| A1 | –1.33*10–5 | –1.40*10–5 | –1.40*10–5 | –1.29*10–5 | –1.34*10–5 | –1.39*10–5 | –1.39*10–5 | –1.33*10–5 |
| A2 | 4.05*10–9 | 5.72*10–9 | 5.72*10–9 | 4.10*10–9 | 4.07*10–9 | 5.14*10–9 | 5.14*10–9 | 4.09*10–9 |
Table 4.Coefficients of
Eq. (12) for each phase transformation and materials. 1 and 3 denote HPF1470 and 340Y. (A(Austenite), F(Ferrite), P(Pearlite), and B(Bainite)).
| 1:A-F | 1:A-P | 1:A-B | 1:A-M | 3:A-F | 3:A-P | 3:A-B | 3:A-M |
|---|
| B0 | 1134.97649 | 1133.61501 | 1133.615 | 959.49701 | 1163.479 | 1124.2351 | 1124.2351 | 1067.3021 |
| B1 | –0.04023 | 1.21086 | 1.21086 | 1.2519 | –1.34035 | 0.86717 | 0.86717 | 1.02108 |
| B2 | 0.00152 | –0.01232 | –0.01232 | –0.01224 | 0.01772 | –0.00805 | –0.00805 | –0.00957 |
| B3 | –1.21*10–5 | 4.76*10–5 | 4.76*10–5 | 4.78*10–5 | –9.48*10–5 | 2.84*10–5 | 2.84*10–5 | 3.53*10–5 |
| B4 | 3.10*10–8 | –8.80*10–8 | –8.80*10–8 | –9.03*10–8 | 2.30*10–8 | –4.81*10–8 | –4.81*10–8 | –6.34*10–8 |
| B5 | –4.05*10–11 | 6.92*10–11 | 6.92*10–11 | 7.32*10–11 | –2.66*10–10 | 3.09*10–11 | 3.09*10–11 | 4.65*10–11 |
| B6 | 1.92*10–14 | –1.87*10–14 | –1.87*10–14 | –2.06*10–14 | 1.16*10–13 | –4.95*10–15 | –4.95*10–15 | –1.08*10–14 |
Table 5.Coefficients of
Eq. (13) for each phase transformation and materials. 1 and 3 denote HPF1470 and 340Y. (A(Austenite), F(Ferrite), P(Pearlite), and B(Bainite)).
| 1:A-F | 1:A-P | 1:A-B | 1:A-M | 3:A-F | 3:A-P | 3:A-B | 3:A-M |
|---|
| C0 | 1.38*10–4 | 1.21*10–4 | 1.21*10–4 | 1.35*10–4 | 1.43*10–4 | 1.37*10–4 | 1.37*10–4 | 1.42*10–4 |
| C1 | 3.58*10–7 | 3.00*10–7 | 3.00*10–7 | 3.53*10–7 | 4.53*10–7 | 4.35*10–7 | 4.35*10–7 | 4.51*10–7 |
| C2 | –1.07*10–9 | –9.77*10–10 | –9.77*10–10 | –1.04*10–10 | –1.19*10–9 | –1.17*10–9 | –1.17*10–9 | –1.18*10–9 |
| C3 | 1.00*10–12 | 9.08*10–13 | 9.08*10–13 | 9.79*10–13 | 1.04*10–12 | 9.92*10–13 | 9.92*10–13 | 1.03*10–12 |
| C4 | –3.49*10–16 | –2.78*10–16 | –2.78*10–16 | –3.41*10–16 | –3.41*10–16 | –2.88*10–16 | –2.88*10–16 | –3.39*10–16 |
The effective heat transfer coefficient (heff) that combines both convection and radiation effects with an emissivity of 0.8 and interfacial heat transfer coefficient (h), listed in Tables 6 and 7, respectively, were obtained from the previous work.25) These parameters are necessary to accurately simulate the heat transfer between the blank, the ambient environment and the tools. The thermal conductivity (k) and heat capacity (ρc) for hot working tool steel AISI H13 were measured using TC-7000 of ULVAC-RIKO and listed in Table 8.
Table 6.Effective convective heat transfer coefficient during heat transfer in air.
| Temperature [°C] | 50 | 100 | 300 | 500 | 700 | 900 | 1000 |
|---|
| heff [W/m2·K] | 11 | 13.6 | 24.5 | 41.5 | 67.8 | 106 | 129 |
Table 7.Contact heat transfer conductance as a function of interface pressure.
| P [MPa] | 0 | 5 | 10 | 20 | 40 |
|---|
| h [W/m2·K] | 750 | 1330 | 1750 | 2500 | 3830 |
Table 8.Thermo-physical properties for AISI H13.
| Temperature [°C] | 100 | 200 | 300 | 400 |
|---|
| k [N/s·K] | 24 | 24 | 24 | 24 |
| ρc [N/mm2·K] | 3.5 | 3.6 | 3.7 | 4.0 |
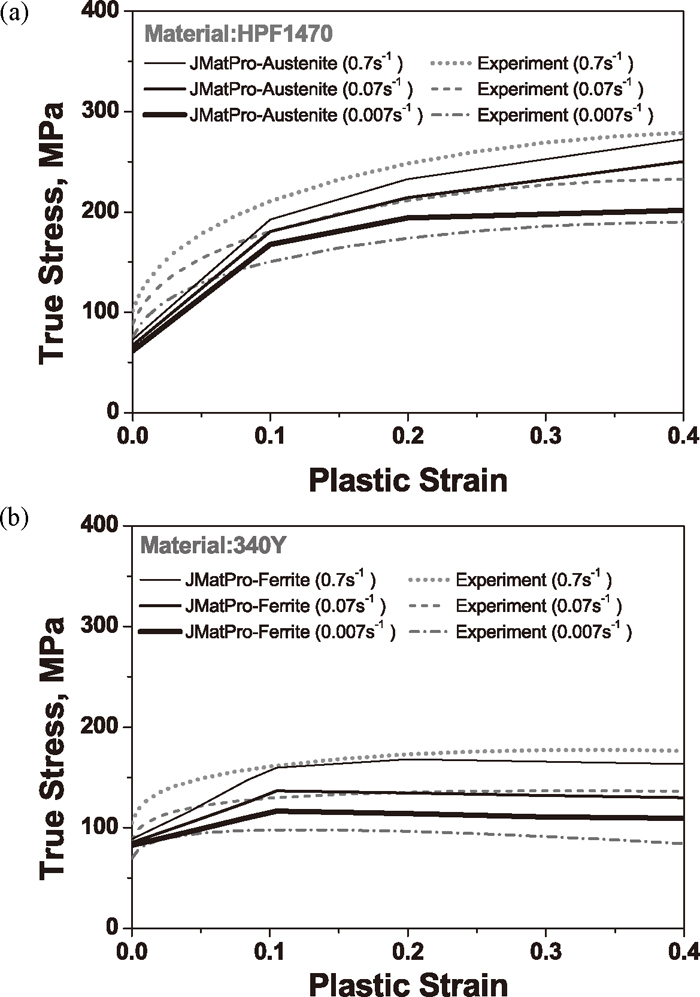
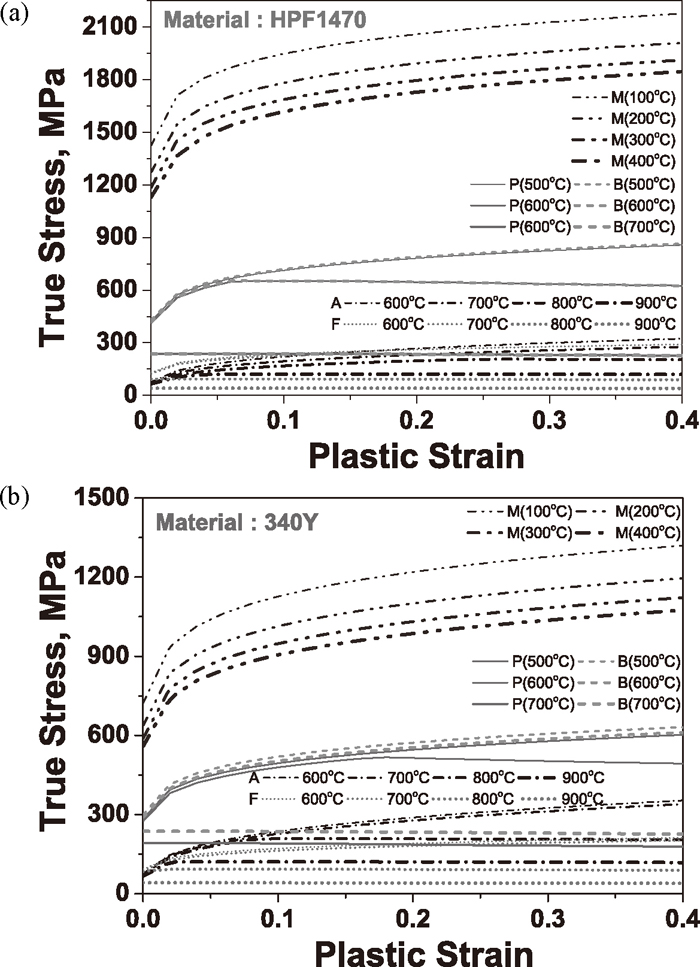
For the mechanical aspect of the simulation, the flow curves of all the constitutive phases are particularly important to model the deformation behaviour during forming and cooling in the HPF process. In this work, the stress-strain curves predicted by the thermodynamic software as functions of temperature and strain rate were employed. Previous results measured experimentally at a typical forming temperature of 730°C were first compared in Fig. 2.26) This figure indicates that the calculated stress-strain curves for various strain rates are in reasonable agreement with those measured in an average sense for both materials, except in the strain range below 0.1. The stress-strain curves calculated by JMatPro were employed for the other phases because of difficulty in measuring them. For instance, Fig. 3 shows the flow curves of both materials for various temperatures at a strain rate of 0.1 s–1.
3.3. Finite Element Model
Thermo-mechanical-metallurgical FE simulations were performed by using DEFORMTM-3D for a detailed analysis of the HPF process. The analysis includes the evaluation of the workpiece deformation, the heat transfer characteristics and the microstructure evolutions during HPF conditions. Figure 4 shows the FE model of the U-draw bending process. Considering the symmetries of the workpiece and boundary conditions, only a quarter of the blank and tools were modeled. The locations called Top, Wall, and Bottom as well as Pt1 in Fig. 4(b) denote the points where the properties and stresses are evaluated and, whenever possible, compared to experimental data after the simulations. The mesh consisted of 8-node continuum elements. A von Mises elasto-plastic material model assuming isotropic hardening was employed for the mechanical aspect. The tools, which were assumed to be rigid, were modeled with continuum elements. The whole simulation procedures consist of 1) blank air cooling with initial temperature of 930°C; 2) forming at initial tool temperature of 25°C for TWB-HPF and 25°C, 200°C, 350°C and 450°C for PQ-HPF, 3) die quenching, 4) tool removal and springback, and 5) cooling of U-channel in air. The cooling durations for blank in air, the die quenching and the U-channel in air were 10, 20 and 600 sec, respectively, which is consistent with realistic process conditions. The punch velocity was 25 mm/s as in the real pressing. A coulomb friction coefficient of 0.15 was assumed, by reference to previous works in which, numerical simulations of the U-draw bend test were carried out.9,27,28) The heat transfer from the blank to the ambient air was considered assuming an environment temperature of 20°C.

4. Result and Discussion
4.1. Dilatometric Test
The dilatometric test results for the 340Y and HPF1470 steels at the cooling rate of 30°C/s are shown in Fig. 5.26) The measured hardness after cooling is about 160 Hv0.5 for 340Y and 475 Hv0.5 for HPF1470. An analysis based on the known volumetric expansion of martensite and ferrite, and the measured hardness values, indicated that most of the austenite transformed into martensite for HPF1470 and ferrite for 340Y. Therefore, the two selected materials were found appropriate for the TWB-HPF part because of their different phase transformation kinetics, that is, the typical boron added HPF1470 steel acquires a high strength while the 340Y steel retains a lower strength with a high ductility after the entire process.
4.2. U-Draw Bending of TWB-HPF
4.2.1. Phase Transformation Characteristics
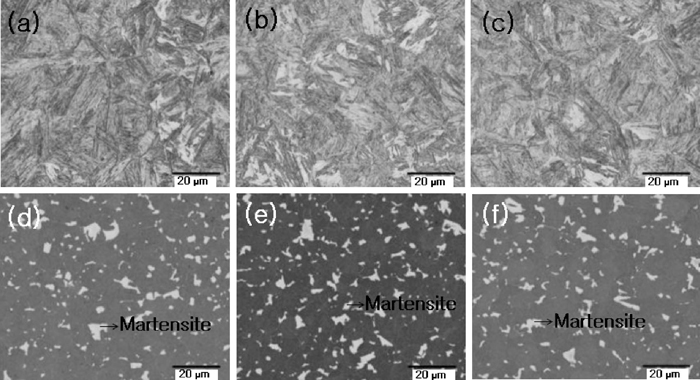
Figure 6 shows the temperature history of the blank for an initial tool temperature of 25°C at the three measuring points Top, Bottom and Wall in Fig. 4(b). In the case of the 340Y steel, it was observed that the temperature before forming (the end of blank transport in air) is higher than that of the HPF1470. This can be explained by the latent heat generation from the ferritic phase transformation in 340Y. This will be discussed later using the CCT curves. To confirm the hardenability of the two materials after HPF, a microscopic analysis was conducted. Figure 7 shows the microstructure of the HPF1470 and 340Y steels at three locations after the HPF process. It shows almost 100% martensite for HPF1470 at all locations. In contrast, for the 340Y steel, it was observed that ferrite was the dominant phase with only about 8% of martensite. This is because most of the austenite was transformed into ferrite during the transfer and forming steps.

To investigate the cooling performances of the two materials during the U-draw bending process, the temperature histories of the three regions were superimposed onto the calculated CCT diagram. As shown in Fig. 8(a), the cooling and CCT curves for the HPF1470 steel confirm that complete martensitic transformation is achieved in all three regions. For 340Y steel in Fig. 8(b), the evolution of ferritic phase transformation initiates even before forming starts. In Fig. 9, the calculated phase volume fractions at the three locations during the HPF process are shown for the two materials. Again, for the HPF1470 steel, nearly 100% martensite transformation was completed (Fig. 9(a)). For the 340Y steel (Fig. 9(b)), the major resulting phase is ferrite with only about 4% of martensite. This value is less than the 8% experimentally measured but the order of magnitude is reasonable. Considering that many of the material and physical properties were determined from thermodynamic calculations, the FE predictions look very promising.

One of the advantages of the HPF process is that the manufactured products have excellent dimensional accuracy compared with cold stamped products. In order to investigate this phenomenon, the springback for the U-channel drawn by cold stamping and HPF were compared in Fig. 10. In agreement with previous studies, the shape change due to springback is more pronounced for the U-channel drawn by cold stamping. In fact, the shape changes for the two materials formed by HPF are hardly noticeable. For a finer assessment of shape change after springback, a 3-dimensional coordinate measurement of the flange was performed and the results are shown in Fig. 10. The measured gap between the tool geometry and the deformed flange end is much smaller. The gap between the flat support and the flange end or, equivalently, the springback amount after forming, is much higher for HPF1470 than for 340Y under cold stamping. This is because the flow stress of the HPF1470 steel at room temperature is significantly higher than that of the 340Y steel, namely, 685 MPa for HPF1470 versus 500 MPa for 340Y. It is a well known fact that springback is proportional to the flow stress when elastic properties are the same.

Interestingly, the springback for 340Y is slightly larger than that of HPF1470 in the case of the HPF. From classical elasto-plasticity consideration, the springback of HPF1470 should be larger because the flow stress of this steel at the forming temperature is larger than that of the 340Y steel, as already shown in Fig. 2. In addition, the Young’s moduli of the two steels are almost the same as shown in Tables 1 and 2. To understand the above experimental results, the role of transformation plasticity, which occurs in HPF, was analyzed.
In order to investigate the transformation behaviors of the steels in the current HPF process, FE simulations were performed while turning on and off the transformation plasticity (TP) option. The temperature history, transformed phase volume fraction and stress distribution were evaluated in the punch corner region at the point defined as Pt1 in Fig. 4(b). For HPF1470, the temperature measured at Pt1 was higher without the TP option as shown in Fig. 11. As expected, the temperatures at Pt1 for 340Y did not differ significantly whether the TP option was turned on or not. The difference in the cooling rate seems to be due to the difference in contact condition in association with the transformation plasticity. For the 340Y steel, the temperature difference is much lower than that for the HPF1470 steel because a small amount of transformation is involved during cooling.

In Fig. 12, the effective stress variations and the martensite volume fraction evolution during cooling are shown for both materials. Figure 12 shows that a significant stress relaxation occurred during quenching, especially in the case of the HPF1470 steel. For this steel, Fig. 12(a) also indicates that the relaxed stress during phase transformation recovers once the reaction ends, but the final stress is still higher when TP is turned off. Although with a smaller magnitude, a similar result was observed for the 340Y steel as shown in Fig. 12(b).

Figure 13 shows the measured shape changes and those predicted with and without the TP option. First of all, reduced springback was observed when the transformation plasticity was turned on in the simulation for both materials. This is likely associated to the stress relaxation due to transformation plasticity. In spite of different absolute values, the gap distances predicted for HPF1470 and 340Y were in good trends with the experiments only when the transformation plasticity was turned on. When the transformation plasticity option was not included in the simulation, the springback for HPF1470 was larger than that for 340Y. Moreover, the results of simulations with TP turned on and off for the 340Y steel show that the springback difference is almost negligible. This is likely because most of the transformation occurs prior to the forming step. Therefore, it is presumed that transformation plasticity does not contribute significantly in reducing residual stresses or springback in 340Y steel. Conversely, HPF1470 is subjected to a large amount of transformation plasticity after the forming step, which leads to the significant relaxation of the residual stresses.

To investigate the cooling characteristics and deformation behavior for the HPF1470 steel under partial quenching in HPF (PQ-HPF), the tool temperature for U-draw bending was controlled by cartridge heaters, as shown in Fig. 1(c). Four different tool temperatures were considered: room temperature (RT), 200°C, 350°C, and 450°C. The measured and simulated temperature histories at the Top part of the U-channel are represented in Fig. 14 as a function of the initial tool temperatures. The temperature histories with TP turned on were in excellent agreement with the measured temperature for all four cases. These histories were superposed to the CCT diagram of HPF1470 in Fig. 15, which indicated that a broad range of hardenability is accessible depending on the initial tool temperature in the U-draw bending test. Note that for these PQ-HPF simulations, the air cooling stage of U-channel is important. The calculated volume fractions of transformed phases are represented in Fig. 16. 100 and 95% austenite decomposition were obtained at the end of die quenching (but before air cooling by removing the tools from quenched sheet) with initial tool temperatures of 25°C and 200°C, respectively, while these fractions dropped to only 15 and 3% after quenching, respectively, with initial tool temperatures of 350 and 450°C. In the latter case, it can be shown that most of the phase transformation took place during air cooling of U-channel (after removing tools from the cooled sheets) at higher initial temperature. The phase fraction evolutions shown in Fig. 16 indicate that almost 100% martensite is achieved when the initial tool temperature is lower than 450°C either by tool quenching only or by tool and subsequent air cooling. The bainitic phase fraction also increased during die quenching and air cooling for the initial tool temperature of 450°C.


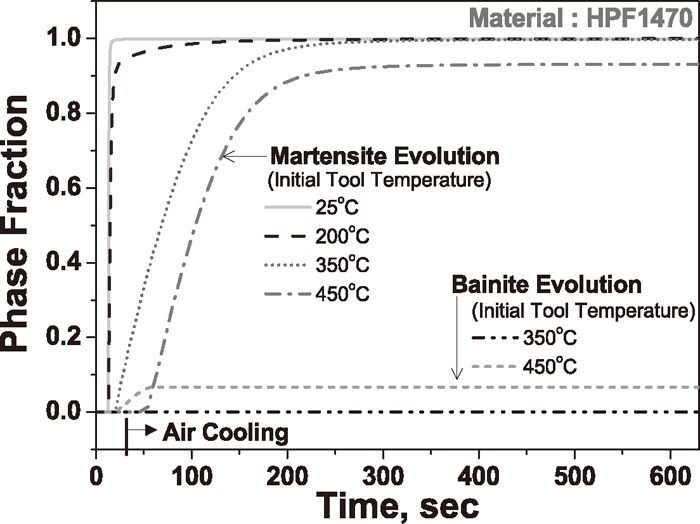
Figure 17 shows the tensile strengths and elongations of specimens extracted at the Top of the U-channel for different initial tool temperatures. A tensile strength of over 1500 MPa was obtained for initial tool temperatures lower than 250°C. Although almost full transformation occurred at an initial tool temperature of 350°C, most of the martensite appeared during air cooling. Therefore, formed parts with this temperature condition might undergo auto-tempering and result in strength degradation. The strength of the HPF1470 steel for the initial tool temperature of 450°C was lower than half of that obtained for a tool temperature of RT. This is due to the incomplete martensitic transformation with the austempering effect and the occurrence of the bainite during cooling in the tool. Figure 18 shows the microstructure of the U-channel for HPF1470 with various initial tool temperatures.26) The heat-treated samples consist of (almost) full martensite at the initial tool temperatures of 200°C or less. In particular, as shown in Fig. 18(d), the microstructure of the sample with the initial tool temperature of 450°C contains a significant amount of bainite, which is consistent with the decrease of the strength and hardness, and the slight increase of elongation shown in Fig. 17.

5. Conclusions
In this work, the HPF1470 and 340Y steels were shown to be suitable candidates for the TWB-HPF process because of the ultra-high strength and lowered hardness, respectively. Moreover, the measurements of U-channel shape changes for the two materials after HPF process were more significant for the 340Y steel compared to the HPF1470, although the former has significantly lower strength than the latter at the forming temperature, which contradicts the classical elasto-plastic theory of springback. This phenomenon was explained by the lower contribution of transformation plasticity, or the early exhaustion of austenitic phase, during the transfer stage for 340Y. Nevertheless, for HPF1470, a martensitic transformation that takes place mostly after forming can reduce the residual stress developed during forming and decrease springback. All these detailed deformation behavior were captured by the thermo-mechanical-metallurgical FE simulations.
A fundamental study on the partial quenching approach (PQ-HPF) of U-draw bending for HPF1470, based on simulation and experiments at various temperatures, indicated that a full martensite structure and full strength can be achieved with an initial tool temperature lower than 200°C. When this temperature is over 450°C, only half of the full strength can be obtained.
Acknowledgement
The authors appreciate the support by POSCO, the grants from the ERC program of National Research Foundation of Korea (NRF-2012R1A5A1048294) and by the Basic Science Research Program (#2011-0009801).
References
- 1) P. Hein and J. Wilsius: Steel Res. Int., 79 (2008), 85.
- 2) A. Pic, D. Munera, L. Cretteur, F. Schmit and F. Pinard: Stahl Eisen, 128 (2008), 59.
- 3) R. Erhardt and J. Boke: Proc. of Hot Sheet Metal Forming of High-Performance Steel, eds. by K. Steihoff et al., GRIPS media GMBH, Germany, (2008), 83.
- 4) F.-J. Lenze, S. Sikora, J. Banik and D. Sauer: Proc. of Hot Sheet Metal Forming of High-Performance Steel, eds. by K. Steinhoff et al., GRIPS media GMBH, Germany, (2008), 15.
- 5) A. Ghiotti, D. Pellegrini and S. Bruschi: Proc. of IDDRG, eds. by B. S. Levy et al., Golden, USA, (2009), 941.
- 6) K. Lamprecht, G. Deinzer, A. Stich, J. Lechler, T. Stoehr and M. Merklein: Proc. of IDDRG, ed. by Ralf Kolleck, Verlag der Technischen Universitat Graz, Austria, (2010), 37.
- 7) M. Naderi and W. Bleck: Proc. Material Characterization Conf., eds. by A. A. Mammoli et al., WIT Press, UK, (2007), 95.
- 8) M. C. Somani, L. P. Karjalainen, M. Eriksson and M. Oldenburg: ISIJ Int., 41 (2001), 361.
- 9) M. Naderi, V. Uthaisangsuk, U. Prahl and W. Bleck: Steel Res. Int., 79 (2008), 77.
- 10) Z. W. Xing, J. Bao and Y. Y. Yang: Mater. Sci. Eng. A, 499 (2009), 28.
- 11) B.-A. Behrens, P. Olle and C. Schaeffner: Proc. of Numisheet, ed. by P. Hora, Institute of Virtual Manufacturing, Switzerland, (2008), 557.
- 12) M.-G. Lee, S.-J. Kim and H. N. Han: Comput. Mater. Sci., 47 (2009), 556.
- 13) Z. Guo, G. Kang and N. Saunders: Int. Conf. on Metal Forming, eds. by K. Mori et al., Wiley-VCH Verlag GmbH & Co. KGaA, Japan, (2010), 892.
- 14) S. H. Kang and Y. T. Im: Int. J. of Mech. Sci., 49 (2007), 423.
- 15) J. B. Leblond: Int. J. Plasticity, 5 (1989), 551.
- 16) L. Taleb, N. Cavallo and F. Waeckel: Int. J. of Plasticity, 17 (2001), 1.
- 17) M. Avrami: J. Chem. Phys., 7 (1939), 1103.
- 18) M. Avrami: J. Chem. Phys., 8 (1940), 212.
- 19) M. Avrami: J. Chem. Phys., 9 (1941), 177.
- 20) J. S. Kirkaldy and D. Venugopalan: Phase Transformations in Ferrous Alloys, ed. by A. R. Marder and J. I. Goldstein, TMS Publications, Warrendale, PA, (1984), 125.
- 21) H. H. Bok, M.-G. Lee, E. J. Pavlina, F. Barlat and H.-D. Kim: Int. J. Mech. Sci., 53 (2011), 744.
- 22) X. Li, A. P. Miodownik and N. Saunders: J. Phase Equilibria, 22 (2001), 247.
- 23) Z. Guo, N. Saunders, A. P. Miodownik and J. P. Schille: MS&T 2006: Heat Treat. Steel, TMS Publications, Warrendale, PA, (2006), 215.
- 24) D. P. Koistinen and R. E. Marburger: Acta Metall., 7 (1959), 59.
- 25) A. Shapiro: Steel Res. Int., 80 (2009), 658.
- 26) J. W. Choi, M.-G. Lee, F. Barlat, H. S. Son and J. B. Nam: ISIJ Int., 52 (2012), 2059.
- 27) P. Åkerström and M. Oldenburg: Proc. of Numisheet, ed. by P. Hora, Institute of Virtual Manufacturing, Switzerland, (2008), 569.
- 28) M.-G. Lee and S.-J. Kim: Met. Mater. Int., 18 (2012), 425.