Regular Article
Influence of Deformation Temperature on γ-α Phase Transformation in Nb–Ti Microalloyed Steel during Continuous Cooling
2013 年 53 巻 6 号 p. 1070-1075
詳細
2013 年 53 巻 6 号 p. 1070-1075
The dynamic continuous-cooling-transformation (CCT) diagrams of Nb–Ti microalloyed steel for four different deformation temperatures of 850, 900, 950 and 975°C were plotted by means of a combined method of dilatometry and metallography. The influence of deformation temperature on continuous cooling transformation behavior and transformation microstructure was elucidated. The reason that the polygonal ferrite transformation field is shifted to the right and moved down as the deformation temperature is increased and the progress of transformation for lowest continuous cooling rate of 0.5°C/s was obviously retarded at the lowest deformation temperature of 850°C was discussed in details based on transformation kinetics and strain-induced precipitation kinetics, respectively. Moreover, the polygonal ferrite grain size for lowest continuous cooling rate of 0.5°C/s can be significantly refined from approx. 15.4 μm to 9.4 μm as the deformation temperature is reduced from 975°C to 850°C. In addition, the empirical equation to calculate γ-α phase transformation start temperature was established, and the calculated Ar3 temperatures are in good agreement with measured ones.
Microalloyed steels have been being widely used in mechanical engineering, pressure vessels, pipelines transporting,1) ships building, etc., due to their enhanced strength, balanced with better toughness and weldability.2) Although the carbon can significantly enhance strength due to its solid-solution strengthening, high levels of carbon content bring about poor toughness and weldability, hence, new generation microalloyed steels utilize chemical compositions design of low carbon content in conjunction with microalloying. And the increase of strength is attributed to grain refinement, precipitation hardening, solid-solution strengthening, enhanced hardenability, etc. Additionally, for a given steel composition, the optimum microstructure can be achieved by suitably designed thermomechanical control process (TMCP), i.e., controlled rolling, followed by accelerate cooling or ultra fast cooling.
Many investigations have been reported about γ-α phase transformation in low carbon microalloyed steels.2,3,4,5,6,7,8,9,10,11,12) These studies mainly focus on effect of chemical compositions, austenite state (undeformed or recrystallized austenite and deformed austenite) or cooling rate on phase transformation behaviors, however, systematic work on influence of deformation temperature on Ar3 temperature and quantitative relationship between Ar3 temperature, deformation temperature and cooling rates is lack. Bengochea et al.4) and Eghbali et al.5) mainly indicated influence of deformation temperature and prior austenite microstructure on ferrite grain refinement, respectively. Manohar et al. indicated that Ar3 temperature can be increased with the increase of finishing deformation.7) And the continuous-cooling-transformation (CCT) diagrams with two deformation temperatures of 950°C and 900°C were plotted in Olasolo et al.’s investigation, but they thought that the CCT diagrams were nearly the same.8) Furthermore, the quantitative relationship between Ar3 temperature and processing parameter was not clarified in these studies. Although the equation for calculating Ar3 temperature was deduced in Yuan et al.’s investigation,9) this equation can not be directly used to calculate Ar3 temperature due to Dγ (austenite grain size) and Δε (residual strain) needed to be determined and influence of deformation condition on Ar3 temperature was also not studied. Liu et al. only indicated the relationship between Ar3 temperature and cooling rate obeys exponential function.12) In addition, we hope that the finishing rolling temperature can be increased during hot rolling, which can bring about some advantages, such as, suppressing strain induced precipitation of Nb(C,N), lowering rolling force, easily controlling profile and increasing productivity, etc. So there is an obvious scientific and commercial significance for more insight into influence of deformation temperature on γ-α phase transformation.
In the present paper, influence of deformation temperature on γ-α phase transformation during continuous cooling were investigated by simulation of TMCP. The dynamic CCT diagrams with four different deformation temperatures were plotted. Moreover, the transformation behavior and transformation microstructure were discussed in more details. In addition, the model for calculating Ar3 temperature was established.
The chemical compositions of tested steel are given in Table 1. The tested steel was vacuum melted ingots which were then hot rolled to plates with the thickness of approx. 12 mm using two-high 450 mm experimental hot rolling mill. Furthermore, to make Nb completely dissolve in austenite, the Nb complete solution temperature was estimate as approx. 1038°C using Eq. (1),13) Hence, the hot rolled plates were reheated to 1200°C for 2 h, and then water quenched to room temperature. And this reheating process can make NbC dissolve on the basis of Dutta et al.’s work14) on the steel of similar composition. The specimens were cut from these pre-quenched plates and machined to round ladder dilatometry samples with the diameter of 6 mm and 10 mm and the length of 15 mm and 30 mm in the middle and edge, respectively.
| (1) |
| Steel | C | Si | Mn | P | S | Alt | Nb | Ti | N |
|---|---|---|---|---|---|---|---|---|---|
| Nb–Ti MAS | 0.08 | 0.25 | 1.39 | 0.01 | 0.002 | 0.06 | 0.035 | 0.018 | 0.0034 |
Figure 1 shows the thermal simulation process of thermomechanical control process (TMCP). The tested steel was reheated to 1200°C and held for 180 s, and then cooled to four different deformation temperatures of 850, 900, 950 and 975°C and held for 15 s to eliminate temperature gradient. After holding, the compression deformation was performed with the true strain of 0.5 and strain rate of 5 s–1, and then followed by continuous cooling with different cooling rate of 0.5, 2, 5, 10, 20, 30, 40°C/s.

Thermal simulation process of the thermomechanical control process.
Samples were sectioned and the surface underneath the thermocouple was polished and etched in 4% nital solution for the observation of OM (LEICA DMIRM). The continuous-cooling-transformation (CCT) diagrams were plotted by transformation temperature determined on the dilatometric curves with the help of metallographic observation. Moreover, the γ-α transformation start temperature was estimated as the temperature at which the ferrite volume fraction was approx. 5%.
Figure 2 shows the continuous-cooling-transformation (CCT) diagrams for four different deformation temperatures of 850°C, 900°C, 950°C and 975°C. As can be seen in this figure, The CCT diagrams for four different deformation temperatures are similar to each other, showing the transformation field is divided into polygonal ferrite, perlite and bainite transformation field. In addition, the ferrite transformation field is shifted to the right and moved down as the deformation temperature is increased. Furthermore, it can be noticed that the bainite transformation start temperature is almost unchanged at the range of cooling rate higher than 5°C/s for the four different deformation temperatures. Influence of deformation temperature and cooling rate on the time of transformation which equals (Ts–Tf)/CR (Ts is transformation starting temperature, Tf is transformation finishing temperature and CR is cooling rate) is given in Fig. 3. It can be seen that the time of transformation is firstly sharply decreased and then slightly decreased as the cooling rate is increased for the four different deformation temperatures. Moreover, the time of transformation is obviously lowered with the increase of deformation temperature at the lowest cooling rate of 0.5°C/s, and this effect is not pronounced at the range of cooling rate higher than 2°C/s.
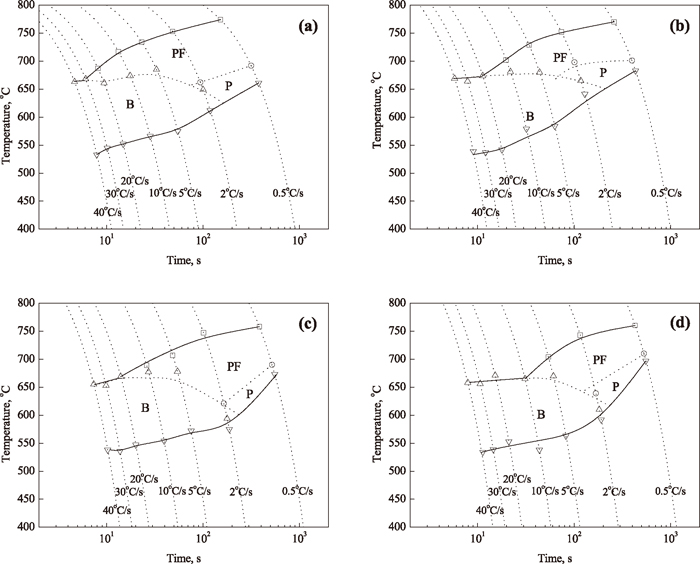
Continuous cooling transformation diagrams for four different deformation temperatures of (a) 850°C, (b) 900°C, (c) 950°C and (d) 975°C.
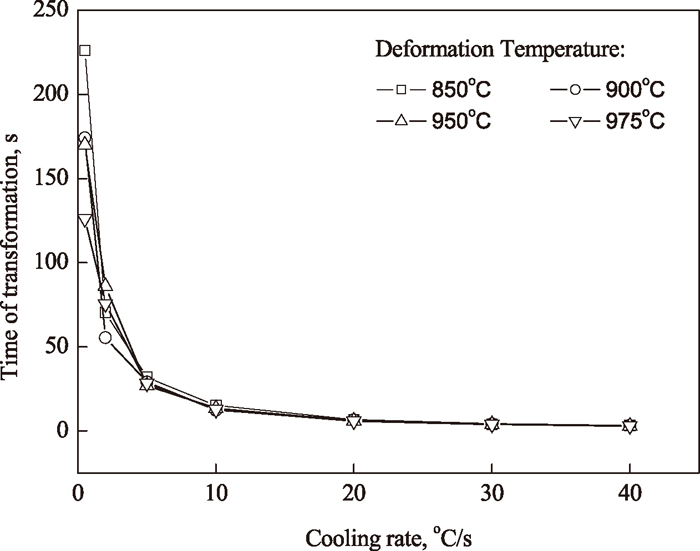
Effect of cooling rate and deformation temperature on the time of transformation.
Based on Eq. (2),15) the Tnr value was estimated as approx. 978°C for the tested steel, indicating that four different deformation temperatures are all lower than Tnr. Moreover, the variation in the dislocation density was also estimated as 2.53×10¹⁶ m–2, 2.23×10¹⁶ m–2, 1.94×10¹⁶ m–2, and 1.66×10¹⁶ m–2 for four different deformation temperatures of 850°C, 900°C, 950°C, and 975°C using Eq. (3),16) respectively. On the one hand, the total driving force ΔGαγ= ΔGchem+ΔGdef17) can be significantly enhanced due to the increase of dislocation density. On the other hand, the density of ferrite nucleation sites is also enhanced due to the increase of austenite grain boundaries area per unit volume, dislocation density, formation of deformation bands, high-energy incoherent twins interfaces and sub-grains. So the deformation of austenite can markedly promote the formation of ferrite, i.e., the γ-α phase transformation start temperature can be increased, and this phenomenon has also been reported by much published data.1,2,6,7,8,10,17,18) However, for higher deformation temperature, i.e., 975°C and 950°C, on the one hand, the stored energy of deformation is reduced due to high recovery rate and partial recrystallization which significantly lower the dislocation density and increase the sub-grain size, resulting in the reduction of total driving force. On the other hand, the density of ferrite nucleation sites is also reduced because of the decrease of dislocation density. So the higher supercooling is needed for γ-α phase transformation, showing lower Ar3 temperature at higher deformation temperature. But at the lower deformation temperature, i.e., 900°C and 850°C, less softening leads to higher Ar3 temperature. And these measured results are in good agreement with Hanlon et al.’s calculated results.17) In addition, it has been reported that the enhanced polygonal ferrite formation, accompanied by the decrease in hardenability was brought about by the deformation of austenite,7,19) resulting in that the ferrite nose is shifted to the higher cooling rate.
| (2) |
| (3) |
As aforementioned the stored energy is higher at lower deformation temperature, it is expected that the progress of transformation can be also accelerated. In fact, the progress of transformation for the lowest cooling rate of 0.5°C/s is markedly retarded. Although the stored energy of deformation for lower deformation temperature is further higher than that for higher one, on the basis of Chen et al.’s report,20) the temperature range of strain-induced precipitation of Nb(C,N) for lower deformation temperature is much lower than that for higher one during continuous cooling. For lower deformation temperature, on the one hand, the driving force for precipitation of Nb(C,N) is higher due to higher supersaturation ratio, on the other hand, the density of precipitates nucleation sites is also higher due to higher dislocation density, resulting in the formation of a great number of fine precipitates, which can effectively pin γ/α interfaces due to higher pining force, so the transformation kinetics is lowered. Conversely, for higher deformation temperature, the driving force of precipitation and the density of precipitates nucleation sites are both lower, so the number of precipitates per unit volume is lower and the size of precipitates may be coarsened due to higher temperature range of precipitation, resulting in lower pinning force of precipitates. And Manohar et al. also insisted that the strain-induced precipitation could retard the progress of transformation by pinning the interfaces.7) Moreover, it can be seen that the time of transformation for the deformation temperature of 850°C is slightly higher than that for the deformation temperature of 900, 950 and 975°C at the cooling rate higher than 5°C/s.
3.2. Transformation MicrostructuresFigure 4 represents the evolution of microstructure at different cooling rate and deformation temperature. At the lowest cooling rate of 0.5°C/s, the microstructure composed of polygonal ferrite and perlite is observed for four different deformation temperatures. Moreover, the polygonal ferrite grain size was measured as approx. 9.4, 10.3, 11.9 and 15.4 μm for four different deformation temperatures of 850, 900, 950 and 975°C using linear intercept method, respectively, showing the ferrite grain size can be markedly refined at lower deformation temperature due to higher nucleation rate and lower growth rate. It can be seen that the polygonal ferrite grain size can be also significantly refined by increasing cooling rate up to 5°C/s (by comparison of Figs. 4(a) and 4(b), 4(e) and 4(f), 4(i) and 4(j) and 4(m) and 4(n)). In addition, when the cooling rate is increased to 5°C/s, the microstructure composed of ferrite and bainite is observed. Increasing the cooling rate to 20°C/s, the microstructure is mainly dominated by bainite, but a little ferrite can be also observed, especially at lower deformation temperature. And the bainite microstructure can be gained at the cooling rate of 40°C/s.
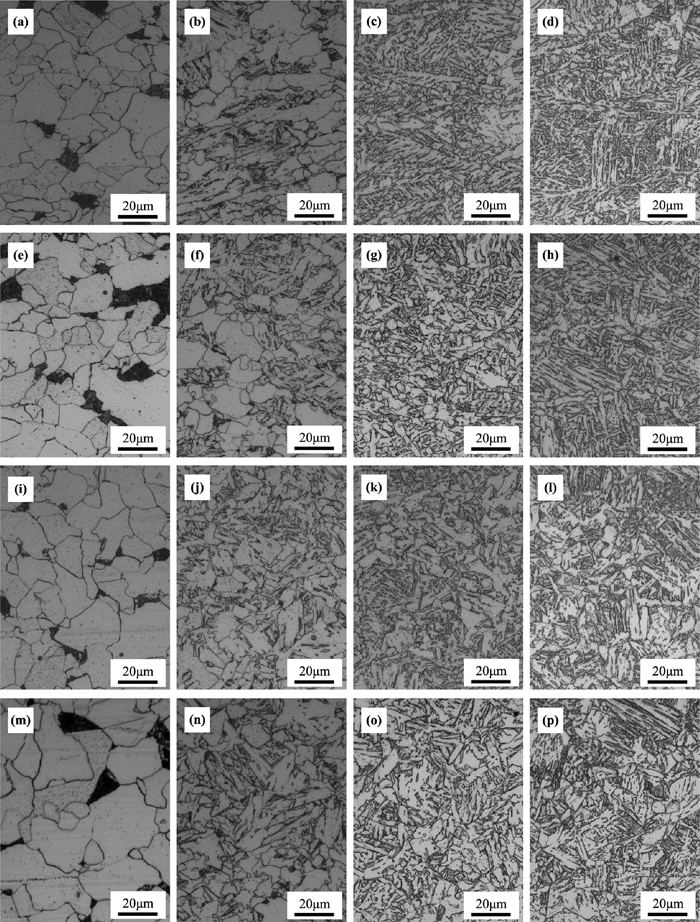
Typical optical microstructure for different deformation temperature of (a), (b), (c) and (d) 850°C; (e), (f), (g) and (h) 900°C; (i), (j), (k) and (l) 950°C and (m), (n), (o) and (p) 975°C, (a), (e), (i) and (m) 0.5°C/s; (b), (f), (j) and (n) 5°C/s; (c), (g), (k) and (o) 20°C/s and (d), (h), (l) and (p) 40°C/s.
It is well known that the γ-α phase transformation start temperature is determined by the austenite state, i.e., austenite grain boundaries area per unit volume, dislocation density, formation of deformation bands, high-energy incoherent twins interfaces and sub-grains, which affects the ferrite nucleation sites and the total driving force. And the austenite state is mainly affected by thermomechanical control process, such as deformation temperature and cooling rate. So the γ-α phase transformation start temperature can be expressed as a function of deformation temperature and cooling rate.
From Fig. 5, we can see that the relation between γ-α phase transformation start temperature and cooling rate is obeyed exponential function, and Liu et al. also indicated that the relation was found to obey exponential function and the following equation was given:12)
| (3) |
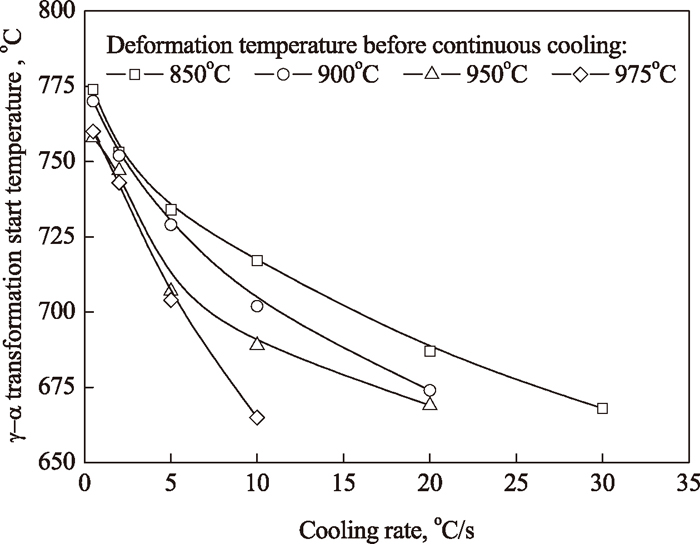
Influence of cooling rate on γ-α transformation start temperature.
In the present investigation, the Eq. (3) was adopted and the influence of deformation temperature on γ-α phase transformation start temperature was considered. The empirical equation to calculate γ-α phase transformation start temperature was established, as follows:
| (4) |
The comparisons of calculated values and measured ones are given in Fig. 6. It can be seen that the calculated Ar3 temperatures are in good agreement with measured ones, indicating that the Eq. (4) can be used to estimate Ar3 temperatures of tested steel at different deformation temperature and cooling rate.
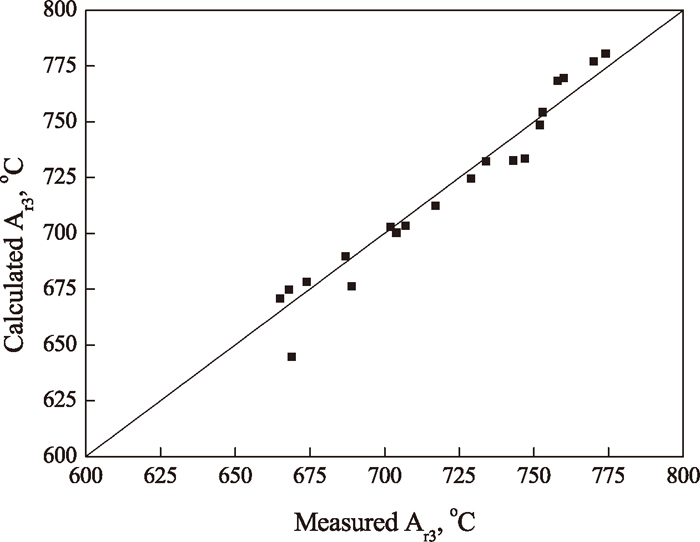
Comparisons of measured Ar3 temperature and calculated Ar3 temperature.
(1) The polygonal ferrite transformation field is shifted to the right and moved down as the deformation temperature is increased. The time of transformation is firstly sharply decreased and then slightly decreased with the increase of cooling rate for four different deformation temperatures; furthermore, the progress of transformation for the lowest continuous cooling rate of 0.5°C/s was obviously retarded at lower deformation temperature, but this effect is not pronounced at the range of cooling rate higher than 2°C/s.
(2) By reducing deformation temperature can significantly refine polygonal ferrite grain size, showing the polygonal ferrite grain size for lowest continuous cooling rate of 0.5°C/s can be refined from approx. 15.4 μm to 9.4 μm as the deformation temperature is reduced from 975°C to 850°C. In addition, by increasing cooling rate can also refine ferrite grain size.
(3) On the basis of influence of cooling rate on γ-α phase transformation start temperature, moreover, the deformation temperature was considered. The empirical equation to calculate γ-α phase transformation start temperature was established, and the calculated Ar3 temperatures are in good agreement with measured ones.
This work is supported by the Fundamental Research Funds for the Central Universities (N110607003, N100507002 and N110307002) and the Scholarship Award for Excellent Doctoral Student granted by Ministry of Education of P. R. China.