Abstract
The viscosity of the CaO–SiO2–MnO(–CaF2) slags (CaO/SiO2 = 1.0, MnO = 10, 40 mass%) was measured to clarify the effect of CaF2 on the viscous flow of molten slags at high temperatures. Furthermore, the Raman spectra of the quenched glass samples were quantitatively analyzed to investigate the structural role of CaF2 in a depolymerization of silicate networks. The critical temperature of the slags abruptly increased at 15 mass% CaF2, which was confirmed to originate from a crystallization of cuspidine using XRD analysis. The viscosity of the slags continuously decreased by CaF2 addition in the 10 mass% MnO system, whereas the viscosity of the 40 mass% MnO system was not significantly affected by CaF2 addition. The activation energy for the viscous flow of silicate melts decreased by CaF2 addition and its tendency became less significant in the more basic composition, i.e. in the 40 mass% MnO system. The effect of CaF2 on the viscosity of the slags was quantitatively analyzed using micro-Raman spectra of quenched glass samples accompanying with a concept of silicate polymerization index, Q3/Q2 ratio. A polymerization index continuously decreased with increasing content of CaF2 in the 10 mass% MnO system, whereas it was not affected by CaF2 in the 40 mass% MnO system. Consequently, the bulk thermophysical property of the CaO–SiO2–MnO–CaF2 slags was quantitatively correlated to the structural information.
1. Introduction
Viscosity of silicate melts at high temperatures has been widely investigated, because of the close relationship between their macroscopic thermophysical properties and the microscopic molecular (or ionic) structure, which strongly affect the reaction efficiency in process metallurgy.1,2,3,4,5,6,7,8,9,10,11,12,13,14,15,16,17,18,19,20,21,22,23,24) Recently, we thoroughly evaluated the novel structure-viscosity relationship of CaO–SiO2–MnO slag system using micro-Raman spectroscopy due to its importance in smelting and refining processes for the production of manganese ferroalloys as well as high manganese steels.21,22)
The slag-metal reaction kinetics should be enhanced in view of high production rate and low cost in smelting and refining processes of Mn ferroalloys as well as high Mn steels. In order to meet these requirements, it is necessary to consider and quantify the effect of fluorspar (CaF2) addition on the viscosity of MnO-containing slags at high temperatures, because the CaF2 is well known to decrease the viscosity of silicate melts.3,4,5,6,7,8,9,10,11,12,15,19,20,24) The experimental study of the effect of CaF2 on the viscosity of various silicate melts has been investigated by several researchers for CaO–SiO2 (–MgO)–CaF2,3,4,5,10,11,12,24) FeO(–CaO)–SiO2–CaF2,6,7,8) CaO–SiO2–Na2O–Li2O–CaF2,19) and CaO–Al2O3–SiO2–MgO–CaF2 systems.20)
From the above studies, the viscosity itself and the activation energy of Newtonian flow of silicate melts generally decrease with increasing content of CaF2 due to depolymerization reactions of silicate networks, indicating that the addition of CaF2 is more effective in higher silica content region. However, the effect of CaF2 on the viscosity of the FeO–SiO2 slags was not found to be as significant as in the case of the CaO–SiO2 slags.6) In MO (M = Mg, Na2)-containing slags, the addition of CaF2 has limited effect on viscosity within a specific content due to additional contribution of basic oxides such as MgO and Na2O besides CaO in the silicate depolymerization.10,11,12,19)
Also, for the highly basic slags, of which silica content is lower than about 10 mass%, CaF2 suppresses the precipitation of solid phases at lower temperatures, whereas the effect of CaF2 on viscosity itself is negligible when the slags are completely liquid at high temperatures.20) From solid-state 19F nuclear magnetic resonance (NMR) spectroscopic analyses of CaO–SiO2–CaF2 (–Na2O) systems, it was reported that F– was dominantly coordinated with Ca2+ in alkali-free ternary system, whereas it predominantly bonded with Na+ rather than Ca2+ in quaternary system. In both cases, however, F– ions were commonly believed not to break the Si–O–Si bonds.14)
Alternatively, there is no experimental work investigating the effect of CaF2 on the viscosity of MnO-containing silicate melts, even though there are some experimental data for the viscosity of the CaO–MnO–SiO2 ternary slag.1,2,7) Therefore, in the present study, the viscosity of the CaO–SiO2–MnO–CaF2 slags has been measured to clarify the effect of CaF2 on the viscous flow of molten slags at high temperatures. In addition, the Raman spectra of the quenched glass samples were quantitatively analyzed to investigate the structural role of CaF2 in a depolymerization of silicate networks with a reference to our previous works.21,22)
2. Experimental
2.1. Slag Preparation for Viscosity Measurement
All of slag samples were prepared using reagent-grade chemicals such as MnO, SiO2, CaF2 and CaO calcined from CaCO3 at 1273 K for 10 hours and the pre-melted slags were used. The pre-melting was carried out using a Pt-10 mass% Rh alloy crucible (diameter 40 mm, depth 60 mm) under a purified Ar atmosphere in a super kanthal electric furnace.
2.2. Procedure of Viscosity Measurement
The rotating cylinder method was used in the present study and a schematic diagram of the experimental apparatus is shown in Fig. 1. A rotating viscometer (Brookfield, model LV-DV II + Pro) was set on the super kanthal electric furnace. The temperature was measured using an R-type (Pt/Pt-13 mass% Rh) thermocouple. The experimental temperature range was about 1523 to 1873 K.

The measurements of viscosity in the present study were made using a Pt-10 mass% Rh alloy spindle, crucibles, and suspending wire, of which dimensions are listed in Table 1. The experiment was started by placing the crucible, containing pre-melted slag, inside the reaction chamber at 1873 K. Then, the spindle rotating at a speed of 100 rpm was lowered into the slag. The tip of the bob was placed about 5 mm above the base of the crucible and about 5 mm of the shaft was immersed in the melt. The equilibration time was approximately 20 minutes at each temperature. Standard oil samples with viscosity of 0.0486, 0.0952, 0.50 and 0.985 Pa·s (0.486, 0.952, 5.0 and 9.85 poise) were used to calibrate the spindle.
Table 1.Dimensions of the crucible, spindle, and suspending wire used in the measurement of slag viscosity (material; all Pt-10%Rh alloy).
| Crucible | inner diameter (mm) | 40 |
| inner depth (mm) | 65 |
| Spindle | bob diameter (mm) | 10 |
| bob length (mm) | 30 |
| shaft diameter (mm) | 3 |
| shaft length (mm) | 65 |
| degree of taper (°) | 45 |
| Suspending wire | wire diameter (mm) | 2 |
| (lower part) | wire length (mm) | 165 |
| Suspending wire | wire diameter (mm) | 2 |
| (upper part) | wire length (mm) | 365 |
In addition, the CaF2 content of the slag samples was analyzed using X-ray fluoroscopy (Bruker, model S4 Explorer) after experiments, because evaporation of the fluoride species from the melts was expected.25) It was confirmed that the weight loss of CaF2 by fluoride emission during viscosity measurements was within about 5% of the initial content, which is similar to previous works.4,10,11,12,19) Hence, the composition in the present article refers to initial content.
The procedures for the preparation of glass samples and the quantitative analysis of Raman spectra are already described in detail in a previous article.21)
3. Results and Discussion
3.1. Effect of CaF2 Addition on the Viscosity and Critical Temperature of CaO–SiO2–MnO Slags
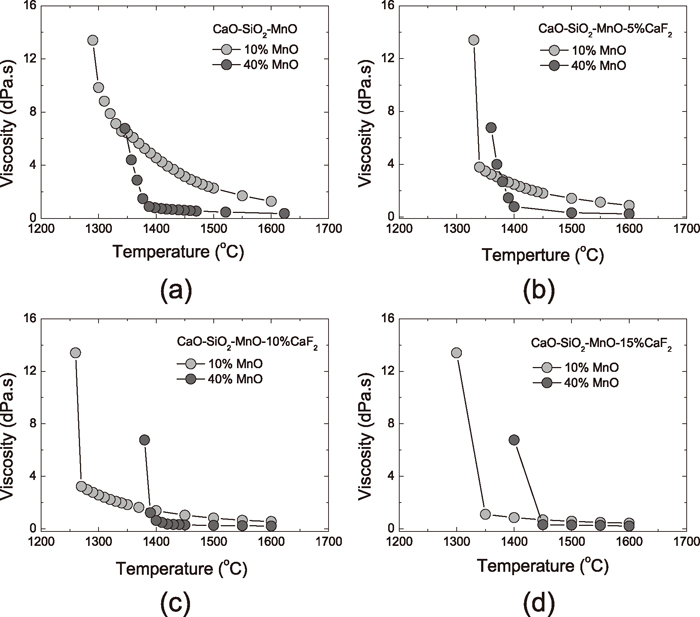
The viscosities of the CaO–SiO2–MnO(–CaF2) slags (CaO/SiO2 = 1.0) are shown as a function of temperature in Fig. 2 for 10 mass% MnO system and in Fig. 3 for 40 mass% MnO system. The viscosity values for CaF2-free system at 1673, 1773 and 1823 K measured by other researchers are also shown in Figs. 2 and 3 for comparison.1,2,7) One can see that the literature values and the present results are in good agreements within experimental scatters.
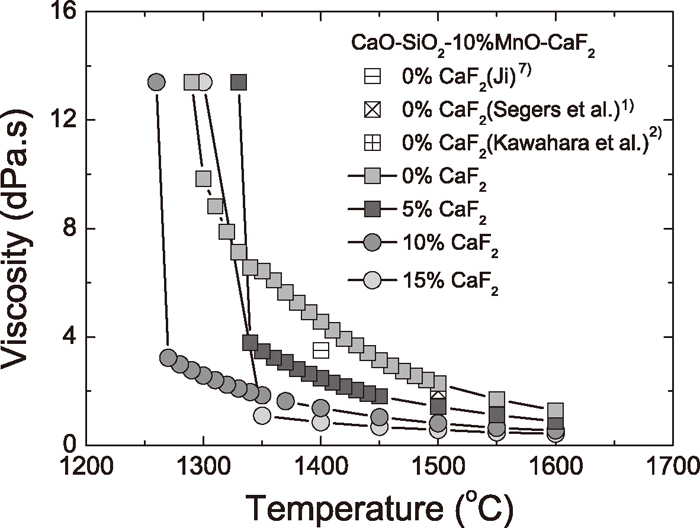
The viscosity of 10 mass% MnO system is generally higher than that of 40 mass MnO system at a given CaO/SiO2 (= 1.0) ratio and CaF2 content. Also, it gradually increases with decreasing temperature and this tendency is significant as the CaF2 content decreases when MnO content is 10 mass% (Fig. 2), whereas the viscosity does not change so much as temperature decreases to about 1723 K when MnO content is 40 mass%. For the latter in Fig. 3, the viscosity drastically increases at a specific temperature, which has been called critical (or crystallization) temperature (TCR).10,11,12,18,19)
A temperature dependency of the viscosity for the 10 and 40 mass% MnO systems are compared in Fig. 4 at different CaF2 contents. The critical temperature of 10 mass% MnO system decreases from about 1623 K to 1543 K as the content of CaF2 increases from 0 to 10 mass% (Figs. 4(a)–4(c)), followed by a rebound to about 1623 K when the CaF2 content reaches 15 mass% (Fig. 4(d)). For the 40 mass% MnO system, there is no significant change in critical temperature (1673 (±5) K) when the CaF2 content varies from 0 to 10 mass% (Figs. 4(a)–4(c)). However, it abruptly increases to about 1723 K when the CaF2 content changes from 10 to 15 mass% (Fig. 4(d)).
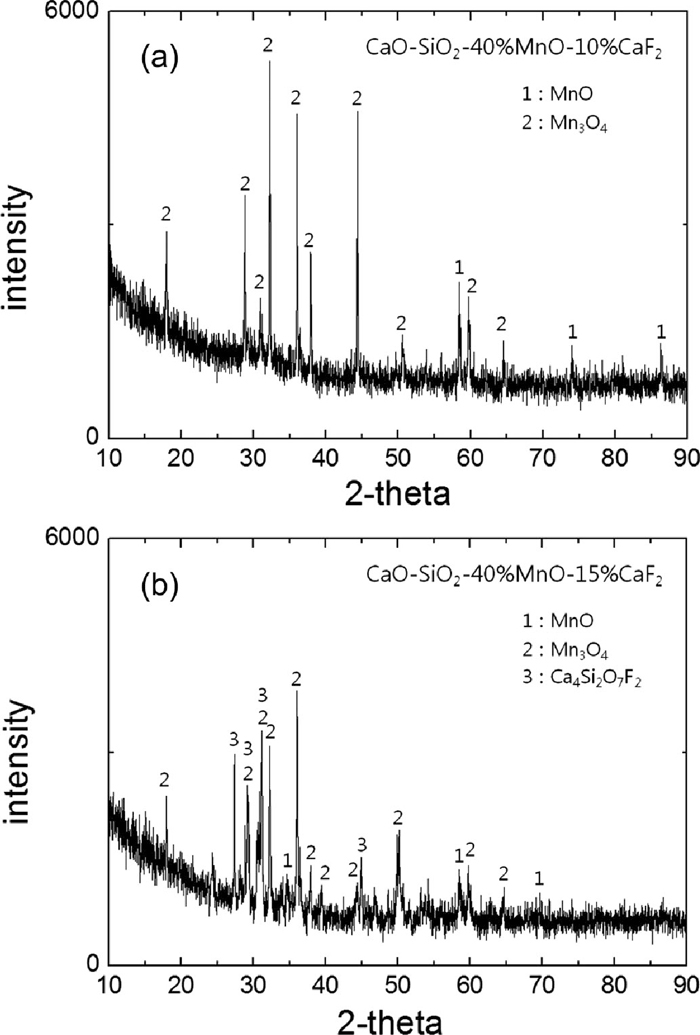
An increase in the critical temperature at 15 mass% CaF2 composition in both 10 and 40 mass% MnO systems was found to originate from a crystallization of cuspidine (Ca4Si2O7F2), which was confirmed by XRD analysis as shown in Fig. 5. It was found that 10 mass% CaF2 system exhibited a crystallization of Mn oxides, viz. MnO and Mn3O4 as shown in Fig. 5(a), whereas Mn oxides and cuspidine were detected in 15 mass% CaF2 system in Fig. 5(b). Here, the Mn3O4 is believed to form by oxidation of MnO in slag samples attached in a spindle during cooling after viscosity measurement. Therefore, even though a reliable phase diagram of the CaO–SiO2–MnO–CaF2 quaternary system is not available at this time, the cuspidine is expected to primarily crystallize in the CaO–SiO2–MnO–15 mass% CaF2 system (C/S = 1.0, MnO = 10–40 mass%).
Furthermore, in Fig. 4, the effect of MnO content on the viscosity of slags at temperatures greater than TCR increases by decreasing the content of CaF2. This means that MnO is also relatively strong network modifier as likely as CaO in the CaF2-free silicate melts. The structural role of Ca2+ and Mn2+ ions in a depolymerization process of the CaO–SiO2–MnO ternary system was systematically discussed in our previous articles.21,22,23)
The viscosities of the CaO–SiO2–CaF2-10 mass% MnO system at various temperatures are plotted against the content of CaF2 in Fig. 6. The viscosity of slags continuously decreases as the content of CaF2 increases at a given temperature and the effect of CaF2 addition is more dominant at lower temperatures, whereas CaF2 did not significantly affect the viscosity of slags at higher temperatures. However, the viscosity of slags containing 40 mass% MnO is very low, viz. lower than 0.1 Pa.s even in the CaF2-free system at temperatures greater than 1673 K as shown in Fig. 7.

Therefore, CaF2 is not so useful in the 40 mass% MnO system in view of slag fluidity and furthermore the combination of high MnO (e.g. 40 mass%) and high CaF2 (e.g. 15 mass%) promotes the precipitation of solid phase (e.g. cuspidine), which is undesirable in the viewpoint of not only smelting and refining processes but also post-treatment of skimmed slags. Hence, the addition of large amounts of CaF2 is not recommended at high MnO-containing slags because the larger the amounts of CaF2 added, the severe corrosion of refractory materials expected.26)
3.2. Activation Energy for the Viscous Flow of CaO–SiO2–MnO–CaF2 Slags
The viscosity of the silicate melts is strongly dependent on the degree of polymerization, which is a function of temperature and composition. The relationship between them has generally been discussed by taking the activation energy for the viscous flow into account. The activation energy for the viscous flow of the silicate melts is obtained from the following Arrhenius equation:
|
η=
η
o
exp (
E
η
RT
)
| (1) |
where
η,
ηo, E
η, R and T are the viscosity, a pre-exponent constant, an activation energy, a gas constant, and an absolute temperature, respectively. Hence, it is possible to calculate E
η using a plot of ln
η vs. 1/T. The results are listed in
Table 2.
Table 2.The activation energy for the viscous flow of the CaO–SiO
2–MnO–CaF
2 (CaO/SiO
2 = 1.0) slags.
| Sample number | MnO | CaF2 | Eη (kJ/mol) |
|---|
| 4M-1 | 40 | 0 | 89.5 |
| 4M-2 | 40 | 5 | 79.4 |
| 4M-3 | 40 | 10 | 73.6 |
| 4M-4 | 40 | 15 | 75.2 |
| 1M-1 | 10 | 0 | 164.0 |
| 1M-2 | 10 | 5 | 139.8 |
| 1M-3 | 10 | 10 | 130.6 |
| 1M-4 | 10 | 15 | 95.9 |
The Arrhenius plot for the CaO–SiO2–MnO–CaF2 slags is shown in Fig. 8 as a function of 1/T and the contents of MnO and CaF2, respectively. Here, the viscosities of the partially crystallized melts in a non-Newtonian region are excluded, that is, only the viscosity of the melts that exhibit a Newtonian flow are taken into account. The viscosity, ln η of the melts linearly increases with increasing 1/T and the viscosity of the 40 mass% MnO system is unambiguously lower than that of 10 mass% MnO system at given temperature and CaF2 content.
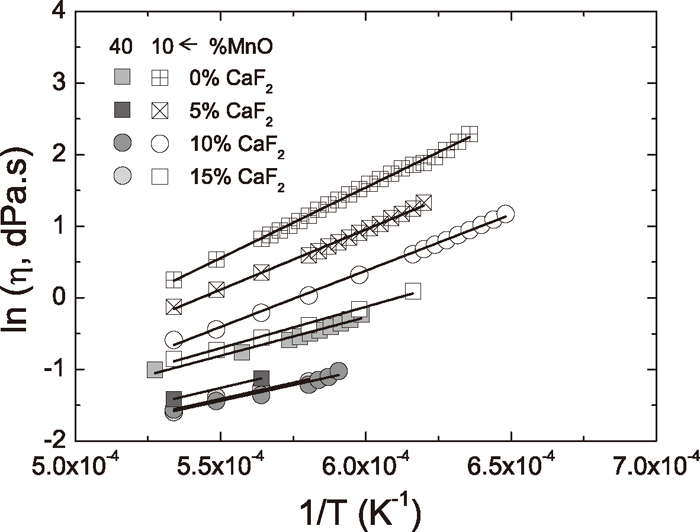
The slope of the line decreases with increasing CaF2 content in 10 mass% MnO system, whereas it is less discernible against CaF2 content in 40 mass% MnO system. This means that F– ions effectively contributed to the depolymerization of silicate networks in the former, but not in the latter. From the phase diagram of the CaO–SiO2–MnO ternary slag, the 10 mass% MnO system with C/S = 1.0 is on the pseudowollastonite (ps-CaSiO3) primary area. The main structural unit of (pseudo-)wollastonite (inosilicate or metasilicate subclass) melt is known as [SiO3]-chain structure,21,27,28,29,30,31) which can be further depolymerized into the more simple [Si2O6F]-dimers and/or [SiO3F]-monomers by addition of CaF2, for example, as follows:10,11,12,15)
|
2[SiO
3
]
2-
(chain) +
F
-
= [Si
2
O
6
F]
5-
(dimer)
| (2) |
|
[Si
2
O
6
F]
5-
(dimer)+
F
-
= 2[SiO
3
F]
3-
(monomer)
| (3) |
However, the 40 mass% MnO system with C/S = 1.0 is on the dicalcium silicate (Ca2SiO4) primary area in the CaO–SiO2–MnO phase diagram. It is well known that the orthosilicates (or nesosilicates) such as dicalcium silicate are the simplest of all the silicate subclasses and include all silicates where the [SiO4]-monomers are unbonded to other tetrahedrons.21,27,28,29,30,31) Thus, the [SiO4]-tetrahedrons are isolated and M2+ (M = Ca, Mn) cations form the [MO6]-octahedrons in orthosilicate melts from the viewpoint of structural similarity among silicate minerals and melts concluded by Mysen et al.21,32,33,34,35,36) The existence of not only [SiO4]-monomers but also [Si2O7]-dimers in orthosilicate structure was experimentally confirmed by previous researchers using Raman and infrared spectroscopic analyses.29,30)
Consequently, there were much less bond-breaking events occurred due to supply of F– ions when the almost silicates are [SiO4]-monomers and/or [Si2O7]-dimers. This provides us very important insights into the structural role of F– in silicate melts. Someone report that F– ions are very effective in a depolymerization of silicate network, while the others report that F– ions behave as just a diluent. This inconsistency in the role of F– ions is occurred from a distribution of silicate structural units as discussed above.
The activation energy for the viscous flow of silicate melts is plotted against the content of CaF2 in various fluorosilicate systems in Fig. 9. One can find that the activation energy ranges from about 40 to 170 kJ/mol according to slag systems and commonly decreases with increasing content of CaF2 regardless of slag systems. Also, the effect of CaF2 on the activation energy becomes less significant as the basicity (B = (CaO + FeO + MnO + MgO)/SiO2) increases. This is not only because the dominant fractions of silicates are depolymerized into the simpler forms such as [SiO4]-tetrahedrons and/or [Si2O7]-dimers due to network-modifying role of Ca2+, Fe2+, Mn2+ and Mg2+ ions before F– ions are working but also because the absolute amounts of silicates should be broken to flow are reduced as the basicity increases.
3.3. Structural Changes of Silicate Melts by CaF2 Addition; micro-Raman Spectra Analysis
Raman spectroscopy was originally used to probe the local anionic structure of silicates.21,32,37) The bands assigned to antisymmetric stretching of Si–O– (non–bridging oxygen; NBO) and Si–O0 (bridging oxygen; BO) bonds occur in the 850–1200 cm–1 region, whereas Si–O–Si bending modes are found between about 500 and 700 cm–1.21,32,38) The frequencies of the stretching modes decrease with decreasing degree of polymerization, viz. increasing NBO/Si. There are several types of units such as SiO2 (fully polymerized), Si2O5 (sheet), SiO3 (chain), Si2O7 (dimer), and SiO4 (monomer) groups.32,33,34,35,36,37,38,39,40,41,42) In the study of nuclear magnetic resonance (NMR) spectra of silicates,43,44) the stoichiometric notations for each unit were replaced by so–called Qn concept, wherein they are equivalent to Q4 (NBO/Si = 0), Q3 (NBO/Si = 1), Q2 (NBO/Si = 2), Q1 (NBO/Si = 3), and Q0 (NBO/Si = 4), respectively.
The Raman spectra of the CaO–SiO2–CaF2-10 mass% MnO system as a function of wavenumbers (Raman shifts) range from 700 to 1300 cm–1 are shown in Fig. 10. The intensity of high frequency Q3 (1050–1100 cm–1) band is very weak and it is not easy to catch the effect of CaF2 on an intensity change of this band. However, it seems that the relative intensity of the Q2 (970(±5) cm–1) band decreases with increasing CaF2 content and becomes week shoulder at 15 mass% CaF2 composition. Alternatively, the Q0 (850(±5) cm–1) and Q1 (910(±5) cm–1) bands increase in intensity by increasing the content of CaF2. The more quantitative analysis of structural changes by CaF2 addition is as follows.

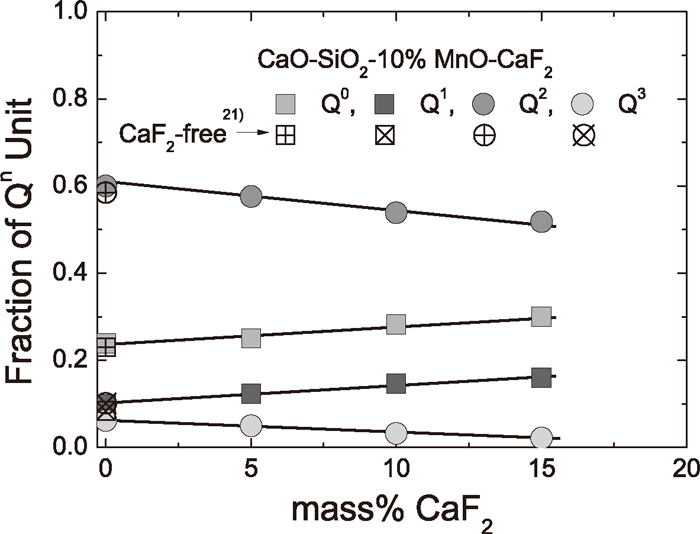
The relative fractions of the silicate anionic units obtained from a Gaussian deconvolution of Raman bands shown in Fig. 10 are listed in Table 3 and plotted against CaF2 content in Fig. 11. The details for the Gaussian deconvolution process are available in our previous works.21,22,23) The fraction of Q3 (Si2O5-sheet) unit is less than 10% and continuously decreases with increasing content of CaF2 and the fractions of Q0 (SiO4-monomer) and Q1 (Si2O7-dimer) units increase as the content of CaF2 increases.
Table 3.Composition of slag samples (mass%) and the peak area ratio obtained from a Gaussian deconvolution of Raman spectra.
| Sample number | MnO | CaF2 | Q0 | Q1 | Q2 | Q3 |
|---|
| 4M-1 | 40 | 0 | 0.337 | 0.329 | 0.324 | 0.011 |
| 4M-2 | 40 | 5 | 0.336 | 0.330 | 0.326 | 0.008 |
| 4M-3 | 40 | 10 | 0.336 | 0.327 | 0.329 | 0.008 |
| 4M-4 | 40 | 15 | 0.308 | 0.333 | 0.349 | 0.010 |
| 1M-1 | 10 | 0 | 0.239 | 0.099 | 0.580 | 0.082 |
| 1M-2 | 10 | 5 | 0.251 | 0.123 | 0.576 | 0.050 |
| 1M-3 | 10 | 10 | 0.282 | 0.147 | 0.539 | 0.032 |
| 1M-4 | 10 | 15 | 0.300 | 0.160 | 0.518 | 0.022 |
The CaO–SiO2-10 mass% MnO system is mainly composed of Q2 (SiO3-chain) structure (approximately 60%), which was previously discussed in Section 3.2 based on a structural similarity between silicate minerals and melts. The relative fraction of Q2 unit decreases as the content of CaF2 increases possibly based on the depolymerization reactions shown in Eqs. (2) and (3). In Fig. 11, the fractions of each Qn unit for the CaF2-free ternary system exhibit a good agreement with the previous measurements,21) indicating that the present Raman analysis is highly consistent.
The Raman spectra of the CaO–SiO2–CaF2-40 mass% MnO system as a function of wavenumbers (Raman shifts) range from 700 to 1300 cm–1 are shown in Fig. 12. The intensity of high frequency Q3 (1050–1100 cm–1) band is negligible through the composition range investigated. There is no remarkable change in the relative intensity of Q0 (850(±5) cm–1), Q1 (910(±5) cm–1), and Q2 (970(±5) cm–1) bands through the CaF2 content from 0 to 10 mass%, although the apparent height of Q2 band seems to slightly increase at 15 mass% CaF2. However, the more quantitative analysis of structural changes by CaF2 addition is as follows.
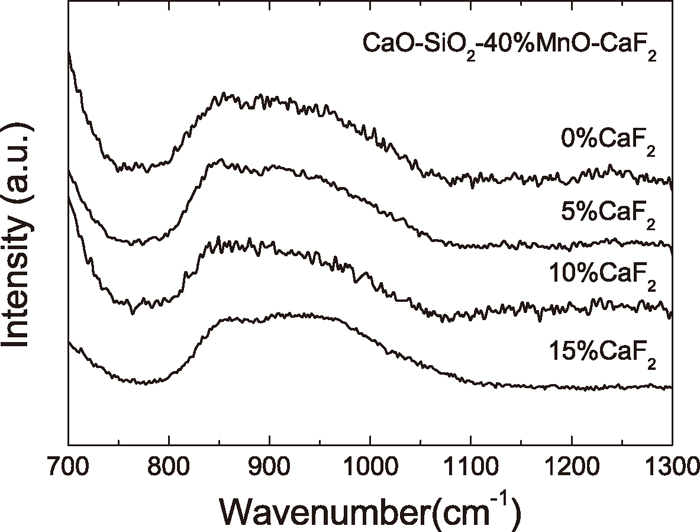
The relative fractions of the silicate anionic units obtained from a Gaussian deconvolution of Raman bands shown in Fig. 12 are listed in Table 2 and plotted against CaF2 content in Fig. 13. The fraction of Q3 (Si2O5-sheet) unit is negligible through the composition range investigated, i.e. C/S = 1.0 and MnO = 40 mass%, irrespective of CaF2 content. Also, it is very interesting that the relative fractions of Q0, Q1 and Q2 units are nearly the same and do not change as the content of CaF2 increases to 15 mass%.

The Q3/Q2 ratio, which was originally proposed as a quantitative polymerization index of silicates in our previous works,21,22,23) is plotted against CaF2 content in Fig. 14. The Q3/Q2 ratio continuously decreases with increasing CaF2 content in 10 mass% MnO system, whereas it does not change as CaF2 content increases in 40 mass% MnO system. This means that CaF2 effectively contributes to a depolymerization of silicate networks in the former, while it does not in the latter as discussed in Section 3.2.
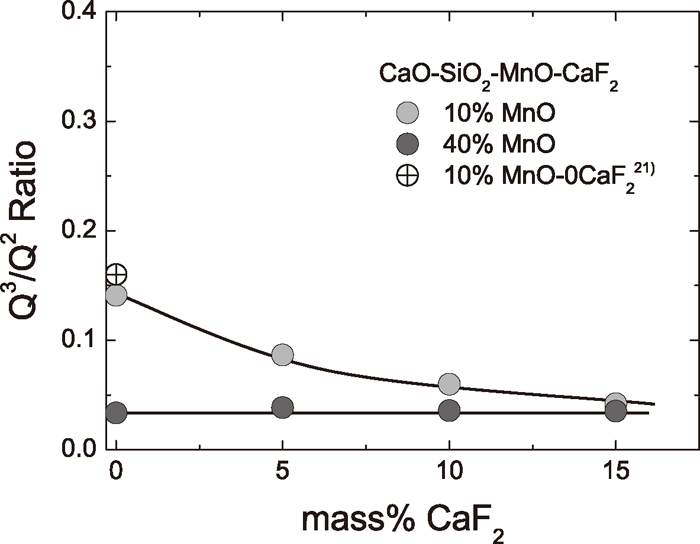
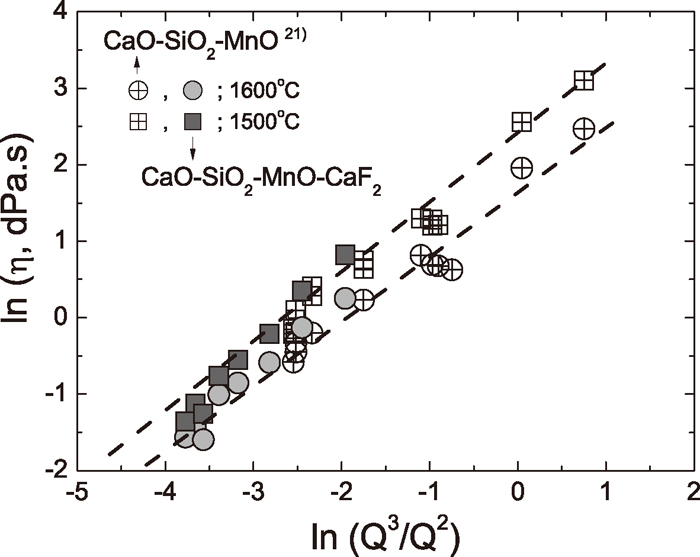
In our previous work,21) the viscosity of the CaO–SiO2–MnO slags, ln η, could be predicted as a linear function of polymerization index, ln (Q3/Q2), at 1873 and 1773 K. As shown in Fig. 15, the viscosities of the CaO–SiO2–MnO–CaF2 slags measured in the present study are also predictable using this relationship within some experimental scatters, indicating that the Q3/Q2 ratio is a good polymerization index whether the CaF2 is included or not. However, in Fig. 15, it is noticeable that the Q3/Q2 ratio of CaF2-containing (to 15 mass%) systems ranges from about 0.02 to 0.14, which is relatively lower than that of CaF2-free systems from about 0.08 to 2.01.
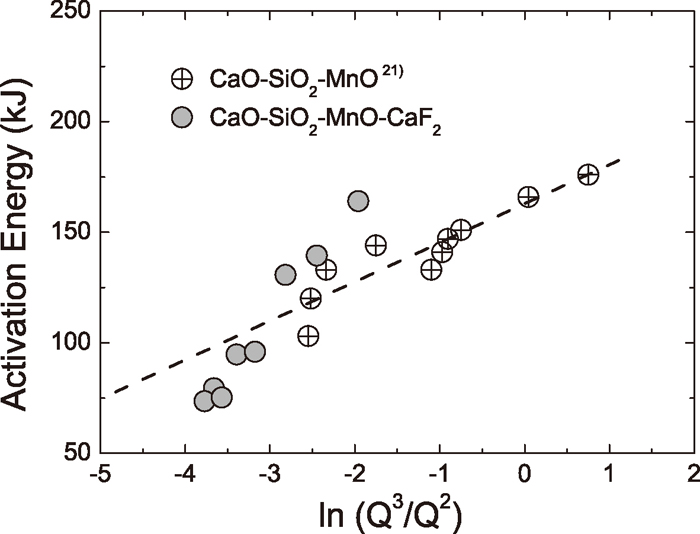
The activation energy for the viscous flow of silicate melts in a Newtonian flow region is shown in Fig. 16 as a function of ln (Q3/Q2). From our previous work,21) the activation energy for the CaO–SiO2–MnO slags was expressed as a linear function of ln (Q3/Q2) as follows.
|
E
η
(kJ)=17.6(±2.7)⋅ln
Q
3
Q
2
+162.7(±4.3)
(
r
2
=
0.85
)
| (4) |
As shown in
Fig. 16, the activation energy and a polymerization index in the CaO–SiO
2–MnO–CaF
2 slags exhibit a reasonable correspondence to
Eq. (4) within some experimental scatters. Consequently, the present experimental results for the viscosity measurement and the structural analysis for the CaO–SiO
2–MnO–CaF
2 slags using Raman spectroscopy are consistent with those of CaF
2-free ternary system, which was previously reported.
21)
4. Conclusions
The addition of CaF2 in the CaO–SiO2–MnO (CaO/SiO2 = 1.0) slag affected not only the critical (crystallization) temperature (TCR) but also the viscosity at high temperatures and its influence to slag properties were strongly dependent on the content of MnO in the slags. The TCR of the 10 mass% MnO system slightly decreased with increasing amount of CaF2 to 10 mass%, followed by a rebound at 15 mass% CaF2. The TCR of the 40 mass% MnO system did not change until CaF2 was added to 10 mass%, but sharply increased at 15 mass% CaF2. An increase in the TCR at 15 mass% CaF2 systems in both cases was confirmed to originate from a crystallization of cuspidine as primary phase using XRD analysis.
The viscosity of the slags continuously decreased by CaF2 addition in the 10 mass% MnO system, whereas the viscosity of the 40 mass% MnO system was very low, viz. lower than 0.1 Pa.s, even without CaF2 and it was not significantly affected by CaF2 addition at temperatures greater than 1773 K. The activation energy for the viscous flow of silicate melts decreased by CaF2 addition and its tendency became less significant in the more basic composition, i.e. in the 40 mass% MnO system, which was in good accordance to the experimental results for the various fluorosilicate melts measured by several authors.
The effect of CaF2 on the viscosity of the slags was quantitatively analyzed using micro-Raman spectra of quenched glass samples accompanying with a concept of silicate polymerization index, Q3/Q2 ratio. A polymerization index continuously decreased with increasing content of CaF2 in the 10 mass% MnO system, whereas it was not affected by CaF2 in the 40 mass% MnO system. Consequently, the bulk thermophysical property of the CaO–SiO2–MnO–CaF2 slags was quantitatively correlated to the structural information.
References
- 1) L. Segers, A. Fontana and R. Winand: Electrochim. Acta, 24 (1979), 213.
- 2) M. Kawahara, K. Mizoguchi and Y. Suginohara: Bull. Kyushu Inst. Technol., 43 (1981), 53.
- 3) T. S. Tribe, P. W. Kingston and W. F. Caley: Can. Metall. Q., 36 (1997), 95.
- 4) F. Shahbazian, Du Sichen, K. C. Mills and S. Seetharaman: Ironmaking Steelmaking, 26 (1999), 193.
- 5) T. Yasukouchi, K. Nakashima and K. Mori: Tetsu-to-Hagané, 85 (1999), 571.
- 6) F. Shahbazian, Du Sichen and S. Seetharaman: ISIJ Int., 39 (1999), 687.
- 7) F. Z. Ji: Metall. Mater. Trans. B, 32B (2001), 181.
- 8) F. Shahbazian: Scand. J. Metall., 30 (2001), 302.
- 9) J. H. Park, D. J. Min and H. S. Song: ISIJ Int., 42 (2002), 344.
- 10) J. H. Park, D. J. Min and H. S. Song: Metall. Mater. Trans. B, 33B (2002), 723.
- 11) J. H. Park, D. J. Min and H. S. Song: Metall. Mater. Trans. B, 35B (2004), 269.
- 12) J. H. Park and D. J. Min: J. Non-Cryst. Solids, 337 (2004), 150.
- 13) S. Sukenaga, N. Saito, K. Kawakami and K. Nakashima: ISIJ Int., 46 (2006), 352.
- 14) M. Hayashi, T. Watanabe, H. Nakada and K. Nagata: ISIJ Int., 46 (2006), 1805.
- 15) J. H. Park and D. J. Min: ISIJ Int., 47 (2007), 1368.
- 16) J. H. Park, H. Kim and D. J. Min: Metall. Mater. Trans. B, 39B (2008), 150.
- 17) Y. Miyabayashi, M. Nakamoto, T. Tanaka and T. Yamamoto: ISIJ Int., 49 (2009), 343.
- 18) H. Kim, W. H. Kim, J. H. Park and D. J. Min: Steel Res. Int., 81 (2010), 17.
- 19) H. S. Park, H. Kim and I. Sohn: Metall. Mater. Trans. B, 42B (2011), 324.
- 20) L. Wu, J. Gran and Du Sichen: Metall. Mater. Trans. B, 42B (2011), 928.
- 21) J. H. Park: ISIJ Int., 52 (2012), 1627.
- 22) J. H. Park: ISIJ Int., 52 (2012), 2303.
- 23) J. H. Park: J. Non-Cryst. Solids, 358 (2012), 3096.
- 24) O. Takeda, T. Okawara and Y. Sato: ISIJ Int., 52 (2012), 1544.
- 25) J. H. Park and D. J. Min: Steel Res. Int., 75 (2004), 807.
- 26) J. H. Park, M. O. Suk, I. H. Jung, M. Guo and B. Blanpain: Steel Res. Int., 81 (2010), 860.
- 27) A. Navrotsky: Physics and Chemistry of Earth Materials, Cambridge University Press, New York, NY, (1994).
- 28) C. A. Francis and P. H. Ribbe: Am. Mineral., 65 (1980), 1263.
- 29) Q. Williams, P. McMillan and T. F. Cooney: Phys. Chem. Miner., 16 (1989), 352.
- 30) T. F. Cooney and S. K. Sharma: J. Non-Cryst. Solids, 122 (1990), 10.
- 31) H. Toraya and S. Yamazaki: Acta Crystallogr. B, 58B (2002), 613.
- 32) B. O. Mysen and P. Richet: Silicate Glasses and Melts: Properties and Structure, Elsevier, Amsterdam, Netherlands, (2005).
- 33) D. Virgo, B. O. Mysen and I. Kushiro: Science, 208 (1980), 1371.
- 34) B. O. Mysen: Am. Mineral., 65 (1980), 690.
- 35) B. O. Mysen: Eur. J. Mineral., 15 (2003), 781.
- 36) B. O. Mysen: Earth Sci. Rev., 27 (1990), 281.
- 37) J. Etchepare: Study by Raman Spectroscopy of Crystalline and Glassy Diopside, in Amorphous Materials, ed. by R. W. Douglas and E. Ellis, Wiley–Interscience, New York, NY, (1972).
- 38) T. Furukawa, K. E. Fox and W. B. White: J. Chem. Phys., 75 (1981), 3226.
- 39) S. A. Brawer and W. B. White: J. Non-Cryst. Solids, 23 (1977), 261.
- 40) S. A. Brawer and W. B. White: J. Chem. Phys., 63 (1975), 2421.
- 41) P. McMillan: Am. Mineral., 69 (1984), 622.
- 42) Y. Iguchi, S. Kashio, T. Goto, Y. Nishina and T. Fuwa: Can. Metall. Q., 20 (1981), 51.
- 43) C. M. Schramm, B. H. W. S. DeJong and V. F. Parziale: J. Am. Chem. Soc., 106 (1984), 4396.
- 44) J. F. Stebbins, J. B. Murdoch, E. Schneider, I. S. E. Carmichael and A. Pines: Nature, 314 (1985), 250.