Regular Article
Decoupling Simulation of Thermal Processes in Coupled Combustion and Coking Chambers of a Coke Oven
2013 年 53 巻 6 号 p. 995-1001
詳細
2013 年 53 巻 6 号 p. 995-1001
Three-dimensional mathematical model describing simultaneous combustion, fluid flow, heat and mass transfer were established in coupled combustion and coking chambers of a coke oven. Since coupling numerical simulation was time-consuming and hard to get convergence, two kinds of decoupling methods were proposed and performed to simplify the simulation and improve the calculation efficiency. The parallel decoupling method separates the coupled transport phenomena into two independent processes existing in combustion and coking chambers, respectively, with necessary heat flux boundary condition. While the serial decoupling method is, first calculating the steady heat transfer with combustion and fluid flow in combustion chamber, and then using the obtained results as inputs to simulate the unsteady heat transfer from combustion chamber to coking chamber via the inter-wall. As far as the temperature evolution in coking chamber was concerned, these two decoupling numerical methods could supply alternative and efficient ways for numerical simulation of transport phenomena in coupled chambers of a coke oven. It is expected that this work is helpful for decoupling simulations of other similar complicated thermal transport processes in coupled geometry.
Metallurgical coke is a macroporous carbon material of high strength produced by carbonization of coking coals of specific rank or of coal blends at temperatures of between 900°C and 1100°C in the absence of air. About 90% of the coke produced from blends of coking coals is used to maintain the process of iron production in the blast furnace.1,2) Coking process has remained basically unchanged for over 100 years. Nowadays, regenerative coke oven is widely used all around the world and it contributes more than 90% of the total coke production.3,4)
Many efforts have been made to develop the models and methods to describe complex transport phenomena in the coke oven and the corresponding methods. First attention was paid to individual carbonization or combustion chamber. D. Q. Tian5) proposed a simple one-dimensional transient heat conduction model with constant physical properties in the coking chamber. Rohde6) improved this conduction model by taking into account the temperature-dependence of thermophysical properties and the effects of moisture evaporation and chemical reaction. D. Merrick et al.7,8) developed a series of mathematical models of the coking process. These models were used to predict the release of volatile matter, the physical properties of the coal/semi-coke/coke during carbonization, the charge temperature history and the effect of blend composition on coke strength and so on. Z. C. Guo et al.9) built computational fluid dynamic model for a coking process analysis using PHOENICS CFD package. The model simultaneously calculated the transient composition, temperatures of the gas and the solid phases, velocity of the gas phase and porosity and density of the semi-coke phase. R. Worberg et al.10,11) simulated heat transfer in a heating flue and the local-and time-depending heat conduction inside liner and binder brick walls of a combustion chamber. It revealed the temperature distribution of waste gas and wall in the combustion chamber. P. V. Barr et al.12) proposed a heat transfer model within the tall coke-oven flue using the zone method. Related radiation, convection and conduction were incorporated, and necessary flow and combustion field were supplied as input data. Above all, these single chamber models, either for carbonization or combustion chamber, were generally assumed to be one- or two-dimensional and required temperature boundary conditions (B.C.) on the basis of observed values.
To evaluate the effects of the adjacent chamber and improve the prediction of coke oven operation, coupling adjacent combustion and coking chambers was further pursued in simulation. K. L. Chen et al.13) first proposed a one-dimensional coupled heat transfer model from the flue in the combustion chamber to the inter-wall and coking chamber. K. Matsubara et al.14) also presented a one-dimensional coupled simulation model, including not only coking chamber, vertical and horizontal flue, but also regenerator with fuel flow rate supplied as inlet B.C.. By employing the zone method to compute radiation heat transfer and simplifying the coking process of coal as heat conduction, D. H. Zhao et al.15) built a one-dimensional model, while G. Q. Luo et al.16,17,18) introduced a two-dimensional model consisting of a couple of vertical flues and two adjacent chambers. They predicted flue temperature variation during a coking cycle and showed the same trend of concavity as experimental measurements, but less fluctuation in quantity. Recently, based on coupled coking and combustion chambers, a three-dimensional transient mathematical model was developed and solved by K. Jin et al.19) using CFX package. It described transport phenomena in a coupled geometry with a pair of flues in combustion chamber and two half coking chambers. This simulation was proven to be valid with good accuracy and it revealed the temperature-field evolution of coke bed.
The coupled models removed the requirement for the coke-side or gas-side temperature profile of the inter-wall (between adjacent chambers). However, direct coupling simulation of two- or three-dimensional adjacent chambers was not only time-consuming, but also hard to get convergence. Accordingly, two kinds of decoupling methods and relevant models were proposed in this paper to simplify the simulation and improve the calculation efficiency. Concerning the temperature evolution in coking chamber, the performance and accuracy of decoupling methods was primarily discussed and validated in details.
A coke oven battery comprises combustion chambers for causing combustion of a fuel gas, coking chambers for carbonizing a coal charge, regenerators for storing the remaining heat of a combustion waste gas and sole flues for guiding the combustion waste into a stack. The combustion and coking chambers are alternately arranged on the regenerators. Each combustion chamber comprises many flues where a fuel gas heated in the regenerators is burnt. A coal charge is heated and carbonized to the carbon coke in the coking chambers on the both sides of the combustion. For the purpose of repeating regeneration and preheating of the fuel gas and the air at a high efficiency, the flow direction of the combustion waste gases and the flow direction of the fuel gas and the air are switched over into the reverse direction at certain intervals in time.20)
Because of this structural periodicity, the three-dimensional coupled model consists of a pair of flues in the combustion chamber and two half coking chambers, as shown in Fig. 1.
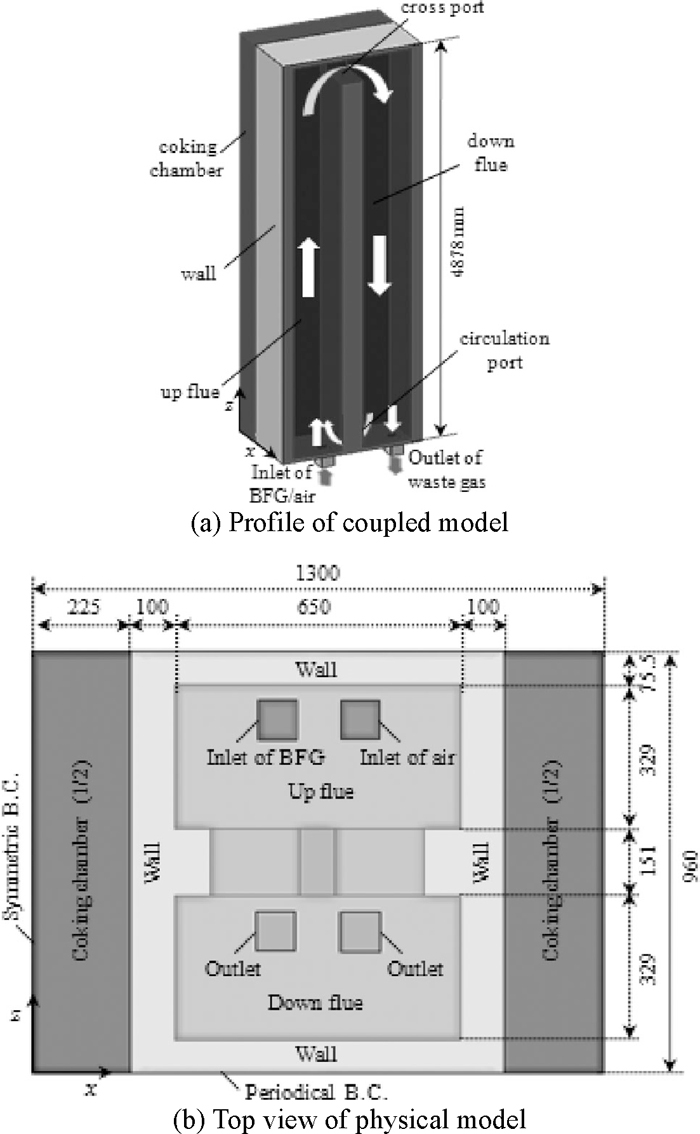
Physical model of coupled combustion and coking chambers.
• Continuity equation
| (1) |
• Momentum equation
| (2) |
• Standard k-ε model
| (3) |
| (4) |
• Energy equation
| (5) |
• Combustion model
| (6) |
• Radiation model
| (7) |
| (8) |
The following assumptions17) are introduced to simplify the model of coking chamber. (1) All moisture in the coal will evaporate, if and only if the temperature is equal to 100°C.8) (2) Effects of the volatile’s generation, release and decomposition, and the coal’s softening, melting and resolidification, were taken into account by temperature-dependent effective thermophysical parameters, such as effective thermal conductivity, effective specific heat and effective bulk density. (3) The shrinkage of coke bed was neglected. Thusly, the mathematical model of coking chamber could be built with heat conduction equation as follows.
• Heat conduction in the inter-wall between two chambers
| (9) |
• Heat conduction in coal-coke bed
| (10) |
The initial temperatures of waste gas, wall and coal were 1300°C, 1100°C and 20°C, respectively. The coking process lasted 18–20 h. The fuel gas was blast-furnace gas and its composition is listed in Table 1. The mass flux and temperature of fuel gas and air at the inlets in up flue were shown in Table 2. Waste gas at two outlets in down flue was of constant pressure. The boundary condition of the centre line of coking chamber was set as a symmetric B.C.. The top and bottom surfaces of flue were assumed to be adiabatic. The walls connecting next pair of flues were supposed to have periodical B.C.s. Temperature-dependent thermophysical properties of the coking coal and the chamber wall were shown in Table 3 and Eqs. (11), (12), (13), respectively.21)
| Composition | CO | CH4 | CO2 | H2 | O2 | H2O | N2 |
|---|---|---|---|---|---|---|---|
| Volume ratio/% | 26.78 | 0.19 | 10.52 | 2.58 | 0.29 | 4.36 | 55.28 |
| Composition | Mass flux /kg·s–1 | Temperature /°C | k /m2·s–2 | ε /m2·s–3 |
|---|---|---|---|---|
| BFG | 0.0274 | 1100 | 0.43 | 0.44 |
| Air | 0.0244 | 1100 | 0.38 | 0.39 |
| Temperature/°C | Density/kg·m–3 | Specific heat/J·kg–1·K–1 | Thermal conductivity/W·m–1·K–1 | Chemical reaction heat/J·kg–1 |
|---|---|---|---|---|
| 100 | 731 | 1435.6 | 0.122 | 0 |
| 150 | 726 | 1475.7 | 0.13 | –2672.5 |
| 200 | 721 | 1530.1 | 0.138 | –7785 |
| 250 | 716 | 1583.9 | 0.147 | –12620 |
| 300 | 711 | 1624.8 | 0.156 | –18182.5 |
| 350 | 703 | 1667.5 | 0.167 | –23905 |
| 400 | 690 | 1707 | 0.175 | –28870 |
| 450 | 680 | 1742.4 | 0.218 | –32742.5 |
| 500 | 683 | 1777.7 | 0.29 | –33282.5 |
| 550 | 722 | 1812.8 | 0.407 | –29175 |
| 600 | 777 | 1855.7 | 0.568 | –19977 |
| 650 | 862 | 1902.7 | 0.795 | 646.2 |
| 700 | 932 | 1948 | 1.15 | 11272.5 |
| 750 | 998 | 1989.8 | 1.55 | 27007.5 |
| 800 | 1031 | 2030.7 | 2.18 | 35597.5 |
| 850 | 1032 | 2078.8 | 3.06 | 39142.5 |
| 900 | 996 | 2130 | 4.29 | 39947.5 |
| 950 | 996 | 2174 | 5.99 | 35700 |
| 1000 | 996 | 2216 | 8.35 | 25325 |
| 1050 | 996 | 2258 | 11.6 | 4500 |
| 1100 | 996 | 2300 | 16.4 | 0 |
| 1150 | 996 | 2340 | 23.2 | 0 |
| 1200 | 996 | 2383 | 32.1 | 0 |
• Density of chamber wall
| (11) |
• Thermal conductivity of chamber wall
| (12) |
• Specific heat of chamber wall
| (13) |
The above models were solved numerically using FLUENT package. The spatial domain was divided into finite control volumes with structured non-uniform grids in Cartesian coordinates. The discretization of governing equations employed the central difference scheme for diffusion terms and the second-order difference scheme for advective terms. The SIMPLE series algorithm was applied to handle the pressure-velocity coupling. The calculation precision was less than 10–5 for relative error.
In the first decoupling numerical method, the coupled transport phenomena in combustion and carbonation chambers of coke oven were separated into two parallel processes: steady heat transfer with combustion and fluid flow in combustion chamber, and unsteady heat conduction in coking chamber. For either chamber, necessary gas-side boundary condition (B.C.) on the inter-wall was approximated as constant heat flux. The value of heat flux was obtained by heat balance calculation, based on plant measurements. In fact, this decoupling makes the simulation in coking chamber and the simulation in combustion chamber independent on each other. So, we call it ‘parallel decoupling method’, as shown in Fig. 2.
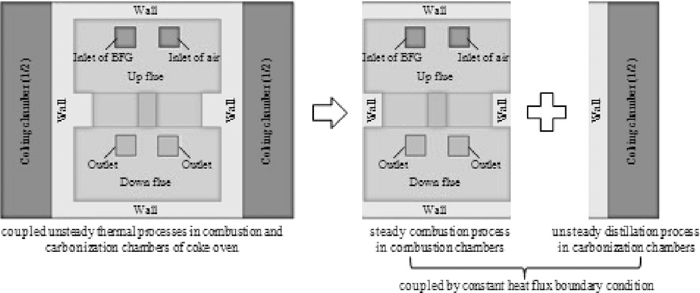
Model decomposition of the parallel decoupling method.
Heat balance analysis of carbonation or combustion chamber helps to determine the heat flux B.C. required for single chamber simulation. Here, heat balance of a coking chamber is demonstrated in Table 4. It is obtained that steady heat transfer rate from the combustion chamber to coking chamber is 59.481 kW. Correspondingly, the average heat flux is 6.352 kW·m–2 on the gas-side surface of the inter-wall between two chambers, i.e. surface facing to the combustion chamber.
| Input | Output | ||||
|---|---|---|---|---|---|
| Term | Value | Term | Value | ||
| kW | % | kW | % | ||
| sensible heat of dry coal | 0.715 | 1.18% | sensible heat of discharged coke | 29.941 | 49.54% |
| sensible heat of moisture | 0.242 | 0.40% | sensible heat of tar | 2.259 | 3.74% |
| heat transfer rate through the wall | 59.481 | 98.42% | sensible heat of crude benzene | 0.549 | 0.91% |
| sensible heat of ammonia | 0.116 | 0.19% | |||
| sensible heat of gas | 11.016 | 18.23% | |||
| sensible heat of vapour | 10.052 | 16.63% | |||
| heat lost | 6.505 | 10.76% | |||
| Total | 60.439 | 100.00% | Total | 60.439 | 100.00% |
A pair of up-and-down flues with the intersectional wall is set as computational domain and a three-dimensional model is established. The calculation grid number is 526344. The gas-side surface of chambers’ inter-wall was of constant heat flux B.C., already obtained in Section 3.1.
Comparisons between simulated temperature and measured data in the combustion chamber are listed in Table 5. We can see that the calculated results are consistent with the measured data.
| Positions | Simulation results/°C | Measured values/°C | Relative error/% |
|---|---|---|---|
| up flue | 1383.9 | — | — |
| cross port | 1371.1 | 1450.0 | 5.44% |
| down flue | 1322.5 | — | — |
| circulation port | 1308.7 | — | — |
| outlet | 1304.1 | 1300.0 | 0.32% |
A half coking chamber and wall were studied using Cartesian grids of 23×50 and 10×50, respectively, shown in Fig. 3. The gas-side surface of wall, i.e. surface facing to the combustion chamber, was of constant heat flux B.C.. The temperature difference along the length and height of the chamber was ignored, so the unsteady heat transfer in the chamber was simplified as a one-dimensional problem.
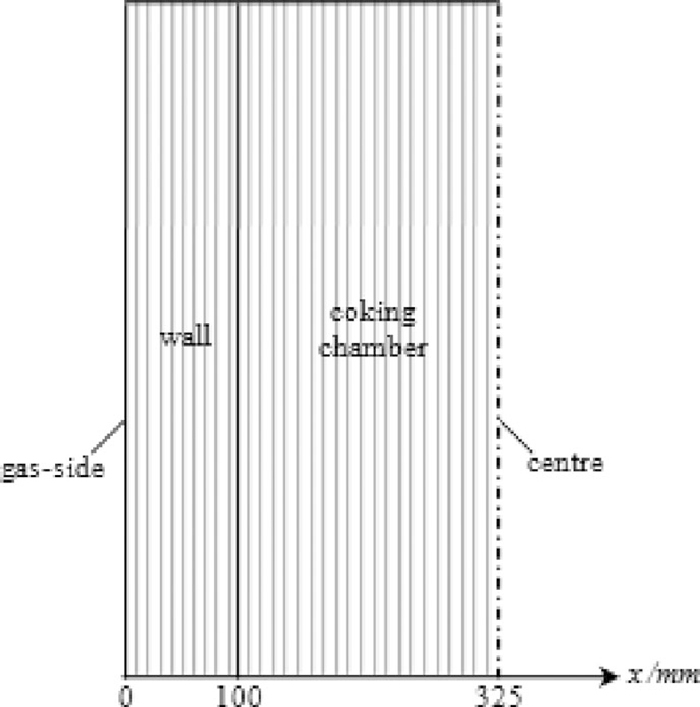
Geometric configuration of grid elements.
Figure 4 shows the temperature evolutions of coal/coke bed and inter-wall. At the very beginning, the temperatures of inter-wall between two chambers do not increase, but decrease because the inter-wall initially loses more heat to the low-temperature coal bed than it absorbs from the waste gas. The lowest temperature of inter-wall is about 800°C at the coke-side. Different from the inter-wall, the temperature of coal/coke bed rises all the way. However, the local temperatures of bed do not show an appreciable rise until the moisture finishes evaporation, which was assumed to occur only at 100°C in this paper. Accordingly, the central temperature of coke bed increases rapidly about 13 hours later. In 19 hours, the central temperature of coke bed rises up to 1035°C, which means the coke bed is matured for output according to the practice requirement that the final central temperature is among 950°C–1050°C. At this end, the gas-side temperature of inter-wall is almost 1246°C (in vivid contrast with measured value 1250°C).

Evolution of temperatures in the coking chamber and inter-wall with constant heat flux B.C.
In Fig. 5, parallel decoupling and directly coupling method19) are compared with each other. It is seen that the results of two methods coincide well with each other and the estimated coking finish time and those simulated temperature are in good agreement with the measurements data.22) This validates the proposed parallel decoupling method. The parallel decoupling method, however, is less time-consuming (about 10% of coupling calculation time), easier to be performed with a good accuracy and a faster convergence.
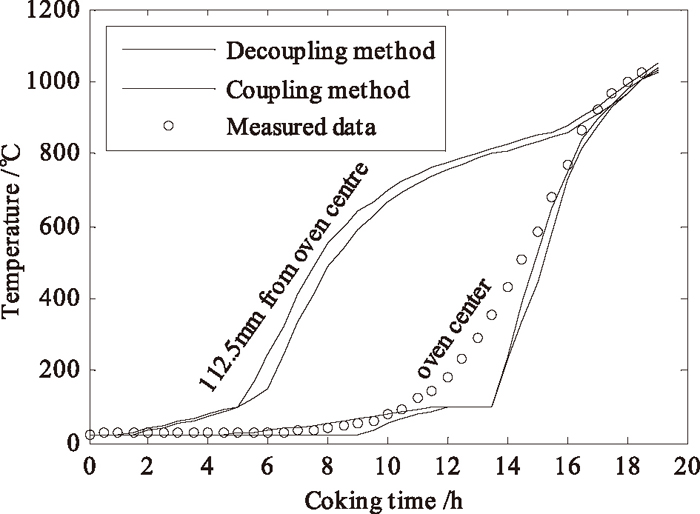
Comparison of coke temperatures simulated by parallel decoupling and coupling methods.
As far as the temperature evolution of coke is concerned, it is applicable to perform unsteady one-dimensional heat conduction simulation in coking chamber, with specified heat flux B.C. obtained from the corresponding heat balance calculation.
In the second method, the simultaneous transport phenomena in combustion and carbonation chambers were decoupled into two-step procedure in series: first steady heat transfer with combustion and fluid flow in combustion chamber, and then unsteady heat transfer from combustion chamber to coking chamber via the inter-wall. Except for the inlets and outlets, steady heat transfer in combustion chamber was simulated with thermal insulation B.C.s as a first step. Next, the simulated temperature, production rate, and thermophycial properties of the waste gas were input as inlet B.C.s to the unsteady heat transfer simulation in coupled geometry of combustion and coking chamber. Since the latter simulation inputs depended on the former simulation outputs, we call it ‘serial decoupling method’. In the latter simulation, the combustion reaction in the combustion chamber was not involved any more, as shown in Fig. 6.
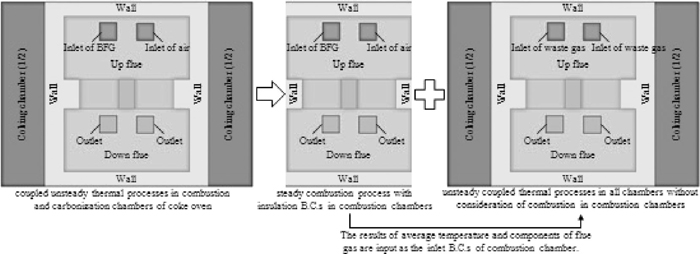
Model decomposition of the serial decoupling method.
A three-dimensional model of combustion chamber was built and boundary surfaces of the chamber were set to be thermally insulated. The production rate of waste gas was obtained as 0.0516 kg·s–1. The obtained temperature and thermophysical parameters of waste gas in the combustion chamber are given in Tables 6 and 7.
| Position | Up flue | Cross port | Down flue | Circulation port | Outlet | Maximum value | Mean value |
|---|---|---|---|---|---|---|---|
| Temperature / °C | 1869.7 | 1890.3 | 1871.7 | 1842.7 | 1846.6 | 1978.2 | 1870.7 |
| Temperature/°C | Density/kg·m–3 | Specific heat/J·kg–1·K–1 | Thermal conductivity/W·m–1·K–1 | Viscosity/Pa·s | Absorption coefficient/m–1 |
|---|---|---|---|---|---|
| 1100 | 0.215 | 1300.0 | 0.130 | 6.15e-05 | 0.08 |
| 1900 | 0.146 | 1355.0 | 0.184 | 8.37e-05 | 0.08 |
There is some relation between the theoretical combustion temperature (t) and the preheating temperature of fuel gas and air. The following formula comes from the combustion heat balance.20)
| (14) |
If the preheating temperature of fuel gas and air is 1100°C, the theoretical combustion temperature will be 1950°C. This is coincident with the simulated maximum temperature, 1978.2°C in Table 6. Hence, the simulated result in combustion chamber is regarded as reasonable and applicable in the following simulation.
4.2. Unsteady Heat Transfer in Coupled Combustion and Coking ChambersA three-dimensional model was built and solved using FLUENT package. The above temperatures and production rate of waste gas were taken as the B.C.s of two inlets. That is, at either inlet, mass flow and temperature of waste gas were 0.0258 kg·s–1 and 1870.7°C at either inlet, respectively. The waste gas was of constant pressure at two outlets.
We would like to emphasize that the combustion reaction in combustion chamber was not involved in this simulation. This could be seen as a quasi-steady state, which was finally proven time-saving contribution and no influence on the accuracy of calculation.
Figure 7 shows the evolution of coke bed average temperature in coking chamber and waste gas average temperature at outlets in combustion chamber. The central temperature of coke bed achieves 1020°C at the 19th hours. At the same time, the gas-side temperature of inter-wall in the combustion chamber is 1241°C (measured value is about 1250°C), while the average temperature of waste gas at flue outlets is 1280°C (measured value is about 1300°C). The second decoupling method was also proven to be less time-consuming (about 30% of coupling calculation time) and effective in prediction.
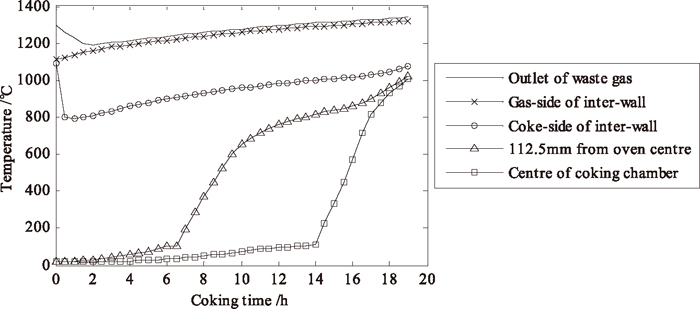
Evolution of coke bed temperatures and waste gas temperature at outlets.
Figure 8 illustrates the evolution of average heat flux in the gas-side surface of inter-wall between two chambers. We can see that the average heat flux increases firstly and then decreases with the coking time, which is contrary to the temperature evolution. From Fig. 8, the average heat flux over time is obtained (6398 W·m–2), which agrees well with the calculated value of coupled method (6193 W·m–2) and the value of heat balance method in Section 3.1 (6352 W·m–2).
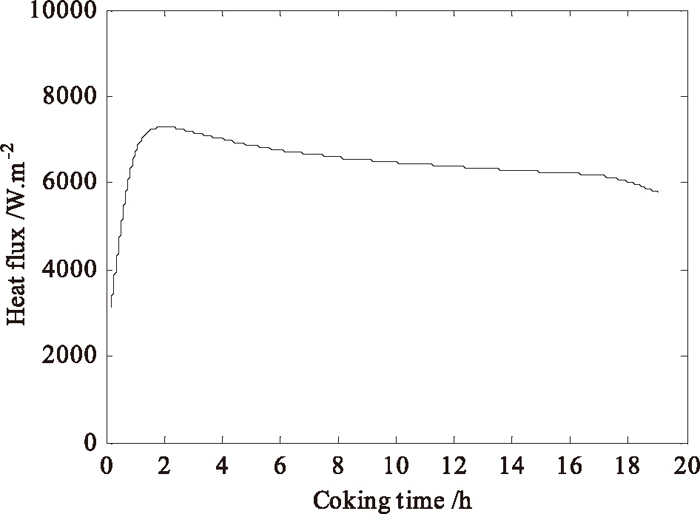
Evolution of heat flux in the gas-side surface of inter-wall.
Comparing the above two decoupling methods, we found that the parallel method is more intuitive and time-saving, while the serial method removes the requirement for the heat flux of the inter-wall.
Since coupling numerical simulation was time-consuming and difficult to converge, two kinds of decoupling mathematical models and corresponding methods were alternatively proposed, to describe simultaneous combustion, fluid flow, heat and mass transfer in combustion and coking chambers of a coke oven. The parallel decoupling method separated the coupled transport phenomena into two relatively independent processes: steady heat transfer with combustion and fluid flow in combustion chamber, and unsteady heat conduction in coking chamber. Meanwhile, the serial decoupling method performed two-step simulations in series: first steady heat transfer with combustion and fluid flow in combustion chamber, and then unsteady heat transfer from combustion chamber to coking chamber through the inter-wall. The former simulation supplied the required input to the latter simulation. The feasibility and accuracy of both decoupling methods were mainly discussed and validated concerning the temperature evolution in the coking chamber. The results of these two methods have few discrepancies and are in good agreement with the measurements data. The parallel method is more intuitive and time-saving, while the serial method discards the requirement for the heat flux of the inter-wall.
The authors are grateful for the support from the National High-tech Research and Development Program of China (2009AA063301).