Abstract
The effect of iron oxide on coals and Hyper-coal (HPC) during caking temperature was investigated. To reveal the effect of the iron oxide reduction reaction on the thermoplastic properties, iron oxide reduction ratios were calculated from titration and gas analysis, and the thermoplastic properties of coal or HPC with and without iron oxide were estimated using thermogravimetric analysis and the Gieseler test. In addition, to investigate the mechanism of the change in the thermoplastic properties of HPC, the reduction ratios calculated from the titration and gas analysis were compared, and the crystal structure of HPC was analyzed using transmission electron microscopy (TEM). As a result, the iron oxide reduction reaction took place in the thermoplastic range, and the weight loss of samples with iron oxide addition increased while the fluidity decreased. On the basis of gas analysis, it was found that the reduction ratio was mainly composed of oxygen derived from H2O vapor. This result suggested that hydrogen atoms generated from the thermoplastic components of the HPC were involved in the reduction reaction. Thus, the polymerization rate of HPC was promoted near iron particles in the thermoplastic range, and the crystal structure of HPC with iron oxide addition was different between near and far from the iron particles. We, therefore, revealed that the reduction reaction by hydrogen atoms from HPC occurred in the thermoplastic range, and that the polymerization rate of HPC with iron oxide addition was increased due to decomposition of the thermoplastic components of the HPC.
1. Introduction
Coke serves as a heat source, as a reducing agent, and as a support skeleton that is permeable to the liquids and gases in a blast furnace.1,2) To effectively operate a blast furnace, high strength and reactivity coke is desired. Ferro-coke, which is a mixture of coal and iron ore, has been studied as a highly reactive coke because ferro-coke has high gasification reactivity.3,4) Thus, the use of reducing agents such as coke and pulverized coal can be decreased with ferro-coke.5,6)
Nomura et al.7) reported that while the gasification reactivity of coke improved because of iron ore addition, the dilatation of the coal decreased due to iron ore addition. Yamazaki et al.8) also reported that the strength of ferro-coke was reduced because of a decrease in the adhesiveness of the coal particles in the presence of iron ore.
The effect of the addition of Hyper-coal (HPC) on low-rank coal has been investigated as a method for improving coke strength.9) HPC is a completely ashless coal that is obtained by a gravitational separation of the solvents from coal-liquefied oil, which includes ash and unreacted products.10) Okuyama et al.11) reported that HPC exhibited a low-softening point and high fluidity, and the fluidity of low-rank coal as well as the coke strength increased because of HPC addition. Thus, when HPC is blended to ferro-coke before carbonization, the strength of ferro-coke can be improved due to increasing the adhesiveness of coal particles.
Uchida et al.12) reported that although the strength of ferro-coke decreased because the iron particles inhibited coal particles adhesion, the strength of ferro-coke with added HPC increased because the coal particle adhesion was improved. Kannari et al.13) reported that the fluidity of coking coal with added Fe2O3 decreased, because the toluene-insoluble and pyridine-soluble fractions of the coking coal were decomposed by the Fe2O3. Barking et al.14) also suggested that the thermoplastic properties of coal decreased owing to the oxygen included in the iron oxide. For these reasons, it is necessary to establish the guidelines for the preparation of HPC with thermoplastic properties that are ideal for improving the strength of ferro-coke when it is utilized as an additive and to quantitatively determine the cause of changing in the thermoplastic properties of HPC with iron oxide addition.
In the present study, changes in the thermoplastic properties of different coals due to the iron oxide reduction reaction were investigated. To reveal the effects of the reduction reaction on thermoplastic properties, reduction ratios were calculated via titrations and gas analyses, and the thermoplastic properties of coal or HPC with and without iron oxide were estimated using thermogravimetric analyses and the Gieseler test. In addition, to investigate the mechanism resulting in the changes in the thermoplastic properties of HPC, the reduction ratios calculated from the titration and gas analysis were compared. The crystal structure of HPC was also analyzed using transmission electron microscopy (TEM).
2. Experimental
2.1. Materials
The characteristics of the Donaldson coal, which is a fine, slightly-caking coal, and the HPC that is extracted from coal, are shown in Table 1. The fluidity of each raw material, as determined using the Gieseler test, is listed in Table 2. The HPC possessed extremely high fluidity compared with the Donaldson coal. The particle sizes of the raw materials are shown in Table 3. Iron oxide (Wako, Fe2O3: 95.0%), and alumina (Wako, Al2O3: 97.0%) are used. The blending ratios of the samples are shown in Table 4. At each blending ratio, after filling a 25 mm diameter mold with the materials, room temperature compression was performed at 98 MPa for the HPC (samples D and E) and iron oxide (sample G), and at 392 MPa for the Donaldson coal (samples A and B), in order to form tablets. The tablets were carbonized by heating from room temperature to 1000°C at 5°C/min, held for 30 min at a constant temperature, and then cooled under a nitrogen atmosphere. The tablets were used for the titrations, thermogravimetric analyses, gas analyses, and TEM analyses.
Table 1. Characterization of coals used.
|
Moisture [mass%] |
Ash [mass%] |
VM |
C |
H |
N |
S |
Odiff. |
H/C |
| [mass%](daf basis) |
| Donaldson coal | 3.4 | 7.6 | 40.2 | 80.4 | 5.6 | 1.8 | 0.7 | 11.5 | 0.84 |
| HPC | 0.3 | 0.4 | 41.2 | 86.6 | 5.4 | 1.9 | 0.6 | 5.5 | 0.75 |
Table 2. The data of Gieseler plastometry.
| Initial softening temperature [°C] | Maximum fluidity temperature [°C] | Resolidification temperature [°C] | log10MF [ddpm] |
|---|
| Donaldson coal | 408 | 430–436 | 451 | 0.78 |
| HPC | 242 | 351–436 | 476 | > 4.8 |
Table 3. Particle size of coals for each experiments.
| Experimental | HPC [μm] | Don-B [μm] | Fe2O3 [μm] | Al2O3 [μm] |
|---|
| Titration | < 150 | < 3000 | < 150 | |
| Thermo gravimetry and gas analysis | < 150 | < 1000 | < 150 | |
| Gieseler plastometry | < 150 | < 150 | < 44 | < 44 |
Table 4. The blending ratio of each sample.
| Sample | Don-B | HPC | Fe2O3 | Al2O3 |
|---|
| A | 100 | 0 | 0 | 0 |
| B | 70 | 0 | 30 | 0 |
| C | 70 | 0 | 0 | 30 |
| D | 0 | 100 | 0 | 0 |
| E | 0 | 70 | 30 | 0 |
| F | 0 | 70 | 0 | 30 |
| G | 0 | 0 | 100 | 0 |
The reduction ratios of iron oxide were calculated from the valence of iron as determined via titration (JIS M 8212 and M 8213) for samples B and E. The reduction ratio,
R
Fe
Titration
[%], is defined as:
|
R
Fe
Titration
={
1-(
n
Oxygen
n
Oxygen
0
)
}×100,
| (1) |
where
n
Oxygen
0
[mg] is the initial weight of the oxygen included in the iron oxide, and
nOxygen [mg] is the weight of oxygen included in the iron oxide at the caking temperature.
2.3. Thermogravimetric Analysis
Thermogravimetric analyses (TGA) were performed using a TG/DTA 220 (Seiko Instruments Inc.). Samples A, B, D, E, and G were compressed at the same condition as described in section 2.1. Approximately 1 mg tablets were heated from room temperature to 1000°C at 5°C/min under a nitrogen flow of 50 ml/min. To evaluate the weight loss of HPC or Donaldson coal, which is affected by the reduction reaction, the weight loss of HPC or Donaldson coal with iron oxide addition, ΔWMeasured [mass%] is defined the measured values of samples B and E respectively. Furthermore, it is assumed the corrected relative weight loss of HPC or Donaldson coal, and iron oxide, ΔWCorrected [mass%], which is not affected by the reduction reaction, and is therefore calculated using the measured values of samples A, D, and G, as follows:
|
Δ
W
Corrected
=0.7×(
100-ΔW
)
+0.3×(
100-Δ
W
Iron oxide
)
,
| (2) |
where Δ
W [mass%] is weight loss of the coal or HPC, Δ
WIron oxide [mass%] is the weight loss of the iron oxide. 70% of the weight loss of samples A or D, and 30% of the weight loss of sample G are used for the same blending ratios of samples B and E. The difference between Δ
WCorrected [mass%] and Δ
WCorrected [mass%] shows the effect of the reduction reaction on the weight loss of samples.
2.4. Gieseler Test
The Gieseler test was conducted for samples A-F with the materials shown in Table 3. The fluidity was evaluated in terms of the physical effects of a mixing impeller and the chemical effects on the thermoplastic properties. In this study, we used alumina to estimate physical effects, and then chemical effects were estimated by the distinction of fluidity between the samples with iron oxide and alumina addition.
2.5. Gas Analysis
The yields of low-molecular weight gases (CO, CO2, CH4, and H2) were measured using a gas chromatograph (Varian, 490-GC micro-GC) during the caking temperature, and the yield of H2O during the caking temperature was measured using a Karl Fischer moisture meter. Samples D and E were compressed under the same conditions as described in section 2.1. Approximately 1 mg of the samples were analyzed from room temperature to 1000°C with a constant heating rate of 5°C/min under a nitrogen flow of 50 ml/min.
To clarify the mechanism of the iron oxide reduction reaction, the thermoplastic components of the HPC, which are decreased by the reduction reaction, are evaluated using the iron oxide reduction ratio which is calculated from the gas analysis (
R
Fe
Gas
[%]). The reduction ratio is expressed as
|
R
Fe
Gas
=
Δ
W
Iron oxide
O
W
0,Iron oxide
O
×100,
| (3) |
where
Δ
W
Iron oxide
O
[mass%] is the yield of oxygen which is generated from the iron oxide,
W
0,Iron oxide
O
[mass%] is the initial assumed weight ratio of oxygen included in the iron oxide.
Δ
W
Iron oxide
O
[mass%] is included in the yields of oxygen estimated from gas formation profile measured for sample E,
Δ
W
Gas(HPC with iron oxide)
O
[mass%]. In this study, all weight loss is based on the initial weight of sample E.
Δ
W
Gas(HPC with iron oxide)
O
is expressed as
Eq. (4), because the oxygen in the low molecular gases generated during the reduction reaction of iron oxide contains oxygen of three types: oxygen that is generated from iron oxide, oxygen that is generated from HPC gas, and oxygen that is generated from the crystallized water in the iron oxide.
|
Δ
W
Gas(HPC with iron oxide)
O
=Δ
W
Iron oxide
O
+Δ
W
HPC
O
+Δ
W
Crystal water
O
,
| (4) |
where
Δ
W
HPC
O
[mass%] is the yield of oxygen which is generated from the HPC, and
Δ
W
Crystal water
O
[mass%] is the yield of oxygen which is generated from the crystallized water in the iron oxide.
To calculate
Δ
W
Iron oxide
O
[mass%], the yields of oxygen which is generated from the HPC (
Δ
W
HPC
O
[mass%]) and the weight of oxygen which is generated from the crystallized water in the iron oxide (
Δ
W
Crystal water
O
[mass%]) are subtracted from
Δ
W
Gas(HPC with iron oxide)
O
[mass%], because
Δ
W
Crystal water
O
[mass%] and
Δ
W
HPC
O
[mass%] are not generated by the reduction reaction. We assume the corrected yields for the oxygen gas generated from the HPC and the crystallized water in the iron oxide,
Δ
W
Gas(HPC)
O
[mass%] as in session 2.3.
Δ
W
Gas(HPC)
O
is derived using 70% of the yields of oxygen on sample D (
Δ
W
HPC
O
[mass%]), and 30% of the yields of oxygen on sample G (
Δ
W
Crystal water
O
[mass%]). In this case,
Δ
W
Crystal water
O
is considered to be the weight loss of sample G that is measured by the thermogravimetric analysis.
2.6. Crystal Structure Analysis
There are two possible types of crystal structures for HPC, the one that was affected and the other that was not affected by the reduction reaction. The sample E for a crystal analysis was conditioned using an ethanol suspension, and was examined using TEM (JEOL, JEM-2010F) at 200 kV.
3. Results and Discussion
3.1. Reduction Ratio Calculated by Titration
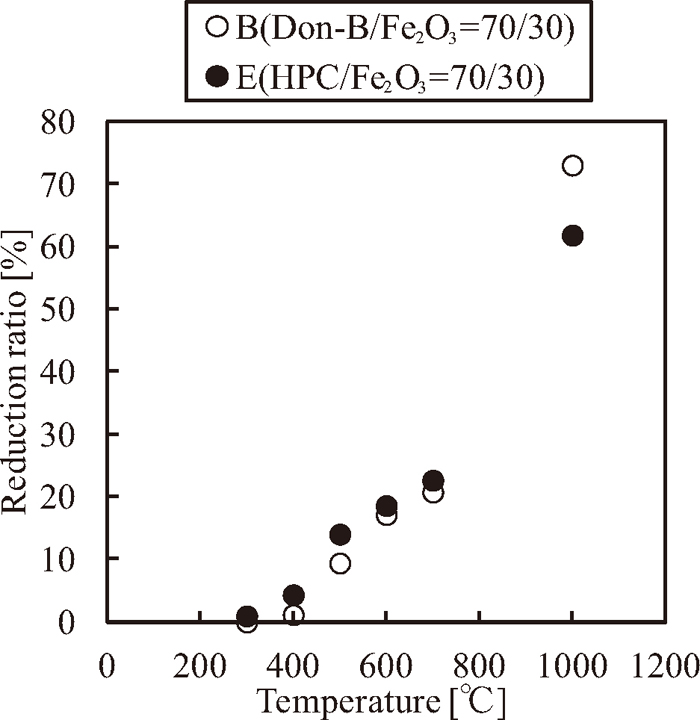
Figure 1 shows the values of
R
Fe
Titration
calculated from the titration results for samples B and E. In the thermoplastic range, the reduction reaction of iron oxide takes place, and the value of
R
Fe
Titration
slightly increase. Notably, the value of
R
Fe
Titration
for the HPC with iron oxide addition (i.e., sample E) is higher than that of the Donaldson coal with iron oxide addition (i.e., sample B) from 300 to 700°C. This result suggests that the thermoplastic components of the HPC promote the rate of the iron oxide reduction reaction. On the other hand,
R
Fe
Titration
increases highly after 700°C for each sample. This phenomenon can be caused by a direct reduction reaction. Yamamoto et al.15) reported that the reduction ratio of iron ore at 1000°C was approximately 90%. The reduction ratios for samples B and E at 1000°C, however, are less than 90%, because they are affected by a reoxidation reaction. The reoxidation reaction occurred after the samples were carbonized. Thus, these results are considered as inaccurate values.
Therefore, this study focuses on the thermoplastic range in order to clarify the effects of the reduction reaction on the thermoplastic properties of coal, which are related to the coke strength.
3.2. Themogravimetric Analysis
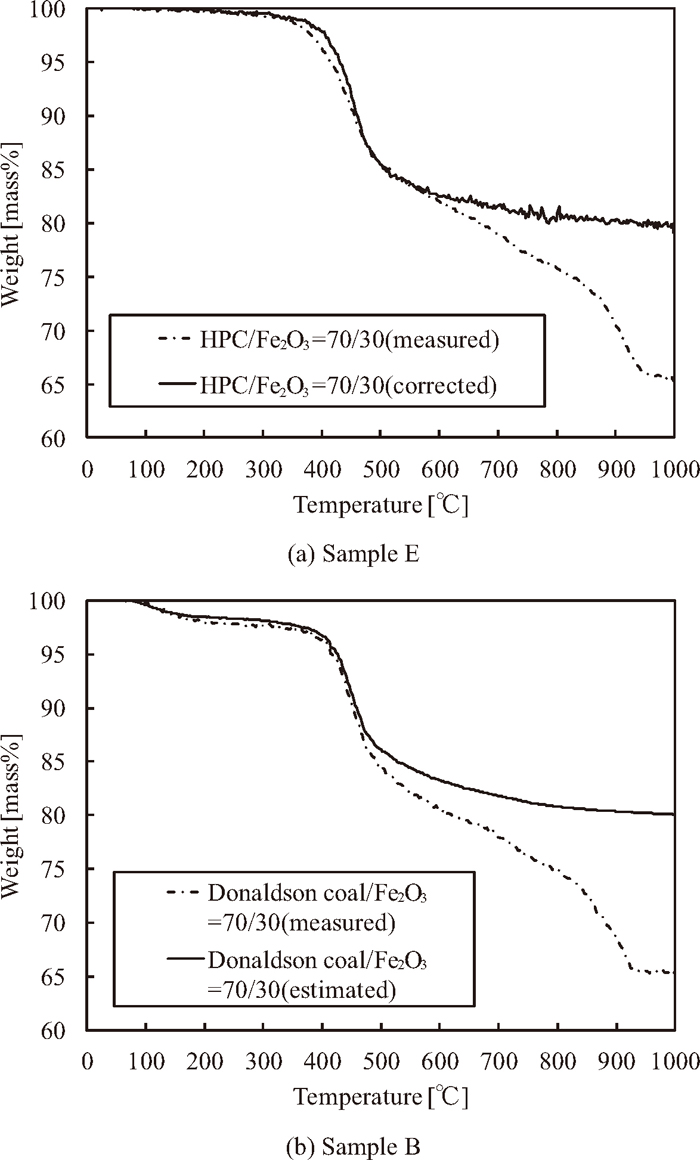
Figures 2(a) and (b) show the measured and corrected weight loss curves of samples E and B, respectively. In the figures, it can be seen that both of the weight loss increase above the resolidification temperature. This result can indicate that the direct reduction reaction occurs, and thus the coke matrix decreases. On the other hand, in the thermoplasitic range, the measured weight loss of sample E is promoted in comparison to corrected value of sample E, ΔWCorrected [mass%]. This behavior suggests that the thermoplastic components decrease as a result of the iron oxide reduction reaction because the sample E is rich in thermoplastic components, while the sample B is not.
3.3. Gieseler Test
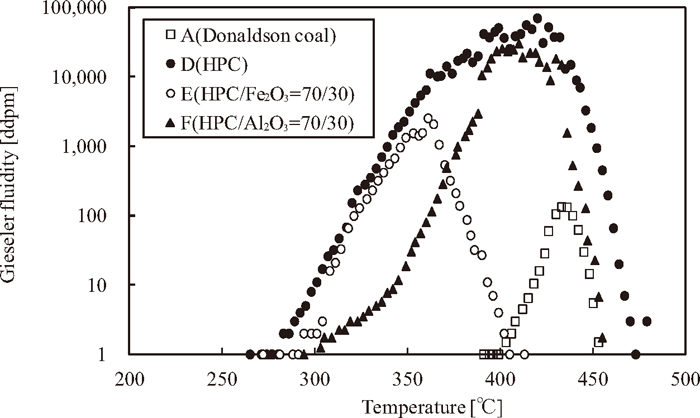
Figure 3 shows the variation of the Gieseler fluidity in the thermoplastic range for samples A-F, where samples B and C do not show the fluidity.
The effects of iron oxide and alumina on the fluidity of the samples were considered. In the Gieseler test, the higher the effect of friction arises on the mixing impeller due to an additive substance (iron ore or alumina), the lower is the fluidity. This phenomenon is defined as the physical effect. On the other hand, the more the amount of thermoplastic components is decreased due to the iron oxide reduction reaction, the lower the fluidity becomes. This phenomenon is defined as the chemical effect.
In sample A, the fluidity of the Donaldson coal is low, because Donaldson coal contains negligible thermoplastic components. Samples B and C do not show fluidity at all, because that the ratio of the thermoplastic components for each sample decrease and the physical effect arise because of blending of the additive substances.
In samples D and E, the fluidity exhibits nearly the same gradient from the initial softening point up to 350°C. The gradient for sample F in the same temperature range, however, is lower than those of samples D and E. In this paper, the physical effect of alumina on the mixing impeller is higher than that of iron oxide in the same blending ratio because the density of alumina is lower than that of iron oxide. As a result, the gradient of fluidity decreases.
In addition, the resolidification point for sample E is lower than that of sample D. In sample E, both the physical and chemical effects are observed. On the other hand, in sample F, although the resolidification point is lower than that of sample D, only the physical effect is noted. The difference in the resolidification points for samples E and F indicates that the thermoplastic components of the HPC are resolidificated as a result of the reduction reaction, and, therefore, the resolidification temperature decreases because of the reduction reaction of the iron oxide.
3.4. Gas analysis
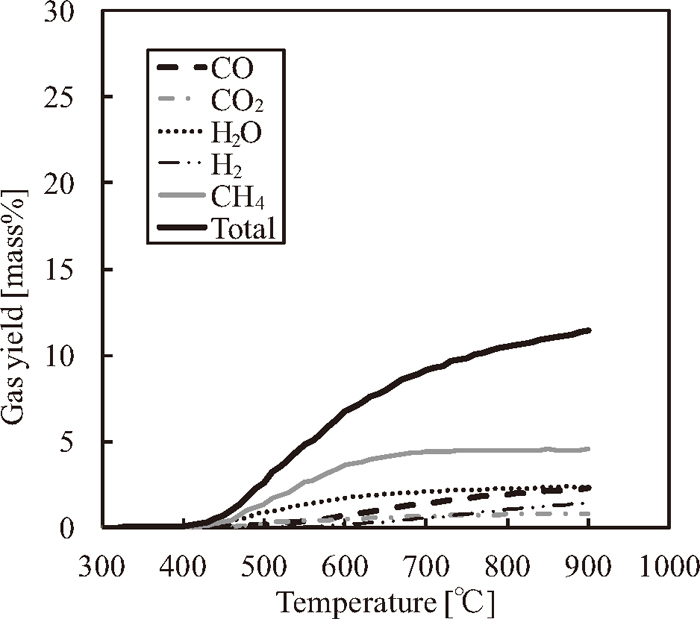
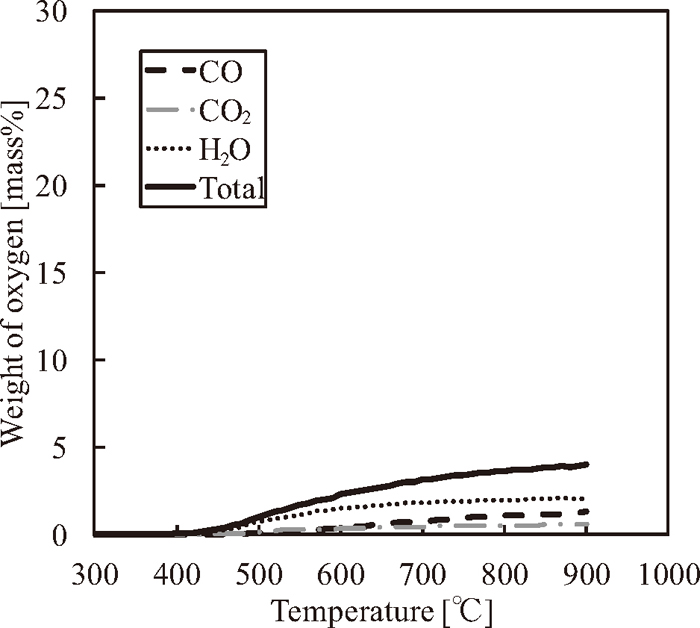
Figure 4 shows the gas yield of sample E, and Fig. 5 shows the admixture gas yields for samples D and G (70 mass% in sample D and 30 mass% in sample G). These results indicate that the gas yields increase because of the iron oxide reduction reaction. In terms of the weight of oxygen, the weight of oxygen generated from sample E (
Δ
W
Gas(HPC with iron oxide)
O
[mass%]) is included in the gas yields shown in Fig. 4, and is also separately shown in Fig. 6. In a similar manner, the weight of oxygen generated from the 70 mass% in sample D and the 30 mass% in sample G (
Δ
W
Gas(HPC)
O
[mass%]) is included in the admixture gas yield shown in Fig. 5, and the weight of oxygen generated from samples D and G (
Δ
W
Gas(HPC)
O
[mass%]) is shown in Fig. 7. The weight of oxygen generated from the iron oxide (
Δ
W
Iron oxide
O
[mass%]) is calculated from the difference between
Δ
W
Gas(HPC with iron oxide)
O
and
Δ
W
Gas(HPC)
O
, and then the iron oxide reduction reaction is calculated from the gas analysis using Eq. (3). The mechanism of the iron oxide reduction reaction was investigated by comparing the iron oxide reduction reaction ratios calculated from the gas analysis and the titration.
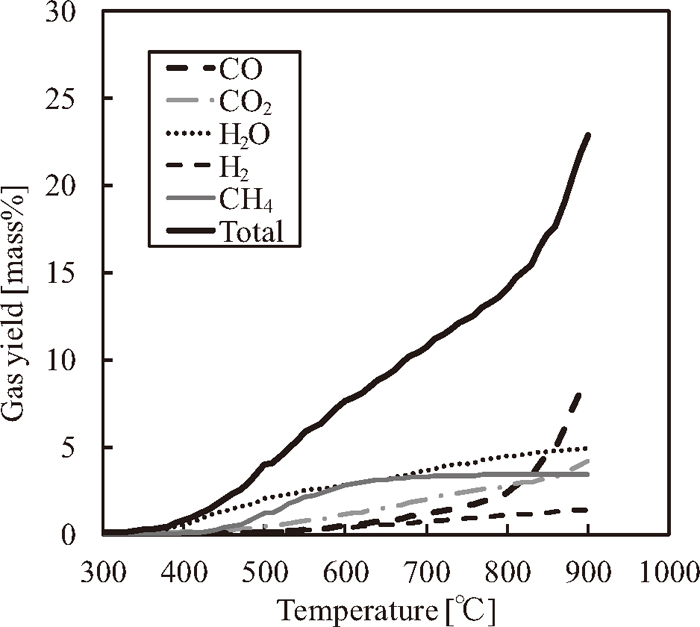
Figure 8 shows the behaviors of the reduction ratios that are calculated from the titration and gas analysis during the caking temperature. Although both of the reduction ratios correspond to each other from 300 to 1000°C, the reduction ratio determined from the titration at 1000°C is lower than that determined from the gas analysis at 900°C. This result is because of the fact that the reduction ratio calculated from the titration at 1000°C includes the effect of the reoxidation reaction of pure iron particles. However, in the thermoplastic range, pure iron particles do not exist, and thus the reduction ratio from the titration does not include the effect of the reoxidation. Therefore, the focus of the analysis is on the behavior of the reduction reaction in the thermoplastic range.

Figure 9 shows the behaviors of the reduction ratios calculated from the titration and the gas analysis over the range from 300 to 500°C. The reduction ratio from the titration included the weight of oxygen generated from the iron oxide because of the reduction reaction. On the other hand, the reduction ratio from the gas analysis is calculated from the low-molecular weight gases and H2O, and it does not include the weight of oxygen from the iron oxide that remained in the thermoplastic components of the HPC. In general, the oxygen ratio for low-rank coal is higher than that of caking coal, and the fluidity of low-rank coal is lower than that of caking coal.16) In the present study, therefore, the fluidity can be decreased by the oxygen from the iron oxide in the thermoplastic components of the HPC. Hence, the weight of the oxygen from the iron oxide in the thermoplastic components of the HPC is investigated. The difference between
R
Fe
Titration
and
R
Fe
Gas
indicates the weight of the oxygen that remained in the thermoplastic components of the HPC.
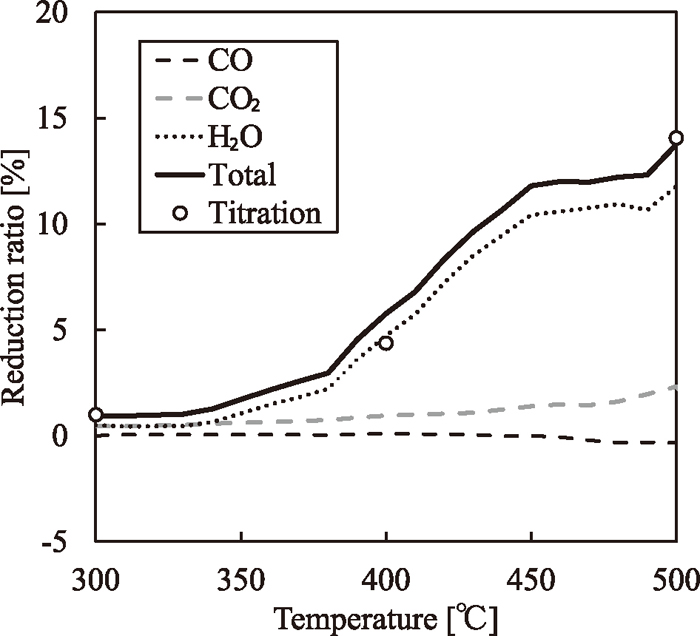
In Fig. 9, the reduction ratio determined on the basis of the titration results is nearly equal to that determined on the basis of the gas analysis. This result suggests that there is little oxygen generated from the iron oxide in the thermoplastic components of the HPC, and that the oxygen generated from the iron oxide reacts with the thermoplastic components of the HPC. Furthermore, the reduction ratio determined on the basis of gas analysis is mainly composed of the oxygen derived from H2O vapor, which suggested that the reduction reaction occurred as a result of the presence of hydrogen atoms generated from the thermoplastic components of the HPC. Therefore, the polymerization reaction rate is promoted by consuming the thermoplastic components, and in particular, the hydrogen atoms.
3.5. Crystal Structure Analysis
Figure 10 shows TEM images of sample E. Figure 10(a) shows a part of the crystal structure that is far from the iron particles, while Fig. 10(b) shows a part of crystal structure near the iron particles. In Fig. 10(a), the carbon crystal is formed horizontally, and a laminated structure arises. On the other hand, in Fig. 10(b), the carbon crystal is randomly formed, and an amorphous structure arises. These differences result from the iron oxide reduction reaction. As demonstrated above, the reduction reaction in the thermoplastic range proceeds through consumption of hydrogen atoms generated from the thermoplastic materials in the HPC. Thus, the polymerization rate for the HPC is promoted near the iron particles in the thermoplastic range, as discussed in section 3.4. As a result, the differences in the crystal structures occurred above the resolidification temperature. The crystal structure far from the iron ore is clearly developed, because this part is not affected by the reduction reaction, while the crystal structure near the iron particles is not developed because this part is affected by the reduction reaction.

On the basis of the above results, it can be concluded that, in the thermoplastic range, the thermoplastic properties of the HPC with iron oxide addition are changed by the reduction reaction through consumption of the thermoplastic components of the HPC. Furthermore, the polymerization reaction rate for HPC is promoted near the iron oxide, and thus the thermoplastic component of the HPC cannot contribute to coal particle adhesion. In order to prepare high strength ferro-coke, therefore, hydrogen atom-rich HPC is considered to be an ideal binder, because the hydrogen atoms of the HPC decrease the effect of the reduction reaction on the thermoplastic properties, which relate to the strength of the ferro-coke.
4. Conclusion
In this study, we evaluated the thermoplastic properties of Hyper-coal (HPC) that was extracted from coal with iron oxide addition using titration, the Gieseler test, the thermogravimetric measurements, and the gas analysis. Moreover, the coke crystal structure using transmission electron microscope (TEM) was evaluated. The following results were obtained:
(1) The iron oxide reduction reaction takes place in the thermoplastic range and the weight loss of HPC and coal with iron oxide addition increases while the fluidity decreases because of the iron oxide reduction reaction. This result indicates that the thermoplastic components decrease with the reduction reaction.
(2) The reduction ratio which is calculated from the gas analysis results is mainly composed of oxygen derived from H2O vapor, which suggests that the reduction reaction proceeds via reaction of the hydrogen atoms generated from the thermoplastic components of the HPC.
(3) The polymerization reaction rate of HPC is promoted near the iron particles in the thermoplastic range. Hence, the crystal structure far from the iron particles is different from the crystal structure near the iron particles. Specifically, the crystal structure far from the iron ore is clearly developed, because this part is not affected by the reduction reaction, while the crystal structure near the iron particles is not developed, because it is affected the reduction reaction.
We reveal that the iron oxide reduction reaction by hydrogen atoms proceeds in the thermoplastic range, and the polymerization reaction ratio of HPC with iron oxide addition is increased because of the decomposition of the thermoplastic components in the HPC.
Acknowledgments
We would like to express our sincere appreciation for the permission to use some of the results found in “Elucidation of the Mechanism for Developing Strength of New Binders.” The latter study was carried out on consignment from Kobe Steel, Ltd. as part of “Project to Develop Technology for an innovative Iron-making Process for Efficient Use of Resources” carried out with grand funding from the New Energy and Industrial Technology Development Organization (NEDO).
Symbols
n
Oxygen
0
: initial weight of oxygen included in iron oxide [mg]
nOxygen: weight of oxygen included in iron oxide [mg]
R
Fe
Titration
: reduction ratio calculated from the titration [%]
R
Fe
Gas
: reduction ratio calculated from the gas analysis [%]
W
0,Iron oxide
O
: initial weight of oxygen in iron oxide [mass%]
ΔW: weight loss of samples [mass%]
ΔWCorrected: corrected relative weight of samples [mass%]
Δ
W
Crystal water
O
: yields of oxygen generated from the crystallized water in the iron oxide [mass%]
ΔWIron oxide: weight loss of iron oxide [mass%]
Δ
W
Gas(HPC)
O
: corrected yields for the oxygen gas generated from the HPC and crystallized water in the iron oxide [mass%]
Δ
W
Gas(HPC with iron oxide)
O
: yields of oxygen estimated from gas formation profile measured for HPC with iron oxide addition [mass%]
Δ
W
HPC
O
: yields of oxygen generated from HPC [mass%]
Δ
W
Iron oxide
O
: yields of oxygen generated from iron oxide by the iron oxide reduction reaction [mass%]
ΔWMeasure: measured weight of samples [mass%]
References
- 1) I. Shimoyama: Tetsu-to-Hagané, 96 (2010), 209.
- 2) M. Shimizu and M. Naito: Tetsu-to-Hagané, 92 (2006), 694.
- 3) M. Naito, A. Okamoto, K. Yamaguchi, T. Yamaguichi and Y. Inoue: Tetsu-to-Hagané, 87 (2001), 357.
- 4) K. Higuchi, S. Nomura, K. Kunimoto, H. Yokoyama and M. Naito: Tetsu-to-Hagané, 97 (2012), 517.
- 5) M. Naito, S. Nomura and K. Kato: Tetsu-to-Hagané, 96 (2010), 201.
- 6) T. Yamamoto, T. Sato, H. Fujimoto, T. Anyashiki, K. Fukuda, M. Sato, K. Takeda and T. Ariyama: Tetsu-to-Hagané, 97 (2011), 501.
- 7) S. Nomura, H. Terashima, E. Sato and M. Naito: Tetsu-to-Hagané, 92 (2006), 849.
- 8) Y. Yamazaki, H. Hayashizaki, K. Ueoka, K. Hiraki, Y. Matsushita, H. Aoki and T. Miura: Tetsu-to-Hagané, 96 (2010), 536.
- 9) T. Takanohashi, T. Shishido, H. Kawashima and I. Sato: Fuel, 87 (2008), 592.
- 10) T. Shishido, N. Okuyama, M. Hamaguchi, N. Komatsu, K. Matsudaira and M. Nishimura: The 43th Coal Scientific Meeting, The Japan Institute of Energy, Tokyo, (2006), 128.
- 11) N. Okuyama, T. Shigehisa, Y. Nishibata, K. Matsudaira and M. Nishimura: Tetsu-to-Hagané, 92 (2006), 213.
- 12) A. Uchida, T. Kanai, Y. Yamazaki, K. Hiraki, Y. Saito, H. Aoki, N. Komatsu, N. Okuyama and M. Hamaguchi: ISIJ Int., 53 (2013), 403.
- 13) N. Kannari, K. Takakusagi, J. Ozaki, Y. Harada, D. Anraku and H. Fujimoto: Tetsu-to-Hagané, 96 (2010), 249.
- 14) H. Barking and C. Eymann: Brennst.-Chemie, 37 (1956), 129.
- 15) T. Yamamoto, T. Sato, H. Fuzimoto, T. Anyashiki, K. Fukuda, M. Sato, K. Takeda and T. Ariyama: Tetsu-to-Hagané, 97 (2011), 501.
- 16) M. Sugano, S. Karino, M. Katoh, K. Hirano, K. Mashimo, K. Uebo and K. Masaki: Tetsu-to-Hagané, 96 (2010), 230.