Regular Article
Damage Pattern Recognition and Feature Extraction of MgO–C Refractory
2013 年 53 巻 7 号 p. 1280-1285
詳細
2013 年 53 巻 7 号 p. 1280-1285
The determination of the damage mode and the quantitative description of the damage of the refractory are the subjects of this paper. Through the three-point bending tests, a magnesia-carbon refractory has been investigated using an Acoustic Emission (AE) unsupervised pattern recognition procedure and a frequency-energy coupled analysis. By means of coefficient analysis of the wavelet energy spectrum, the damage is divided into three periods. Based on the periods, time-frequency analysis is used to extract the damage characteristics and the centroid energy carried by the centroid frequency is put forward in the explanation of the extent of the damage. Finally, the time history plot of the centroid frequency is produced. It shows the similarity of that of the energy which indicates that the extent of the damage could be explained by the centroid energy carried by the centroid frequency brought forward.
Refractory materials are widely used in the iron and steel making process, especially in the building of superstructures and side walls of fusion furnaces. An adequate handling in refractory material manufacturing is a key to successful production of the refractory eventually leading to successful practice in iron and steel making processes. In this view point, it is quite important to understand damage pattern during manufacturing process which helps an appropriate operation for refractory producers. So far, magnesia-carbon products are especially used as ladle blocks for the fusion of highly corrosive steel melted at very high temperature, due to their high corrosion resistance and their low generation of steel defects generation.1) The presence of this high amount of magnesia-carbon in the refractory can be responsible for micro damage occurrence during the repeated loading step after melt casting (annealing), exhibiting highly nonlinear behavior. In fact, the heterogeneity of industrial refractory materials results from their multiphase composition involving aggregates of different sizes, bonding phases and various additives. The grains arrangement, the shape of aggregates and the micro structural defects such as porosity and cracks, make difficult the prediction of the mechanical behaviors.
In the preparation process of the refractory materials, according to the difference of the binders, the making process is divided into two kinds of sintering and baking processes. The magnesium carbon refractory materials are mainly produced by the baking process. In fact, the purpose of this process is to make the bond carbonization (polymerization). In the magnesium carbon refractory materials, the binder is the organic compound of resin. The carbonization will be inspired during 100–200°C to form carbon framework, whose strength would be strong enough for the requirements of high temperature environment under 1600°C. The material workers have done a thorough research on chemical composition, whereas the study on nonlinear mechanical performance is in relatively laggard status. While the mechanical behavior is mostly well known, their damage and time-to-failure mechanisms still require a better understanding. A number of studies on the evolution of the mechanical properties of the refractory materials related to different thermal treatments corresponding to their conditions of use are implemented in experimental ways, but for brittle solids the dominant mechanism is associated with crack damage and the governing property is influenced by the temperature as well as the load conditions such as loading mode and load velocity. Furthermore, the elastic properties (Young’s modulus) exhibit highly nonlinear damage not only for the reason that of the mismatch of coefficient of thermal expansion (CTE) happens in the interface, but also for the chemical phase transformations which is far beyond mono-damage.2,3,4,5,6,7) Set aside the temperature factor for the moment, it might be a more feasible way to study the micro damaging mechanism from the point of view of micromechanics in advance in virtue of AE experimental characterization. In the case of room temperature it is effective and convenient to design and conduct the test as you need in the interpretation of the determinant, for instance for the discrepancies of the Young’s modulus under different loading conditions.8) The difficulty is increased because these refractory materials present great contrasts of mechanical behavior and properties. Some answers are proposed to find the true properties to introduce in that analysis, but much effort was put on the design of the test method rather than on the data analysis of the damage mechanism. Besides, conventional data collection method lacks the further description for the micro damage mechanism of the refractory, which only offers limited depiction without an accurate explanation of the evolution of the damage. Therefore, in succession on the basis of previous studies, it is in dire need of finding a more appropriate way to investigate the damage. One of the aims of this paper is to identify the micro damage mechanisms occurring in refractory materials in a non-destructive way in order to express the nonlinear behavior in a numerical approach. Thus, AE, which represents the generation of transient ultrasonic waves in a material under load, is a useful tool that can be used in situ for material micro damage monitoring at a very local scale. Any generated AE signal contains useful information on the damage mechanism. One of the main issues of AE is to discriminate the different damage mechanisms from the detected AE signals. Most studies so far have used AE descriptors such as the amplitude and the energy of the signal to characterize the development of damage.9,10,11,12,13,14) Each signal can be associated to a pattern composed of multiple relevant descriptors. Then the patterns can be divided into clusters representative of damage mechanisms according to their similarity by the use of multivariable data analyses based on pattern recognition algorithms.15) However, descriptor-based AE techniques often focus on time features which are not totally relevant for characterizing the AE waveforms especially for complex materials.
At first, static three-point bending tests are performed under the monitor of the AE sensor. By means of coefficient analysis of the wavelet energy spectrum, the damage is divided into three periods. The traditional signal analysis methods might cause the loss or average of important information in the signal transform process, which could be readily solved after the frequency domain analysis method. Within the numerous signal analysis methods, wavelet transform method has good local characteristic in time and frequency domain respectively, which is suitable for the analysis of AE signal. Therefore, the wavelet transform method is one of the most widely used methods in composite material at present.16) Suzuki17) imposed Fast Fourier Transform (FFT), short-time Fourier Transform and wavelet analysis in the study of the micro damage of the composite material in 1996, which indicated that the wavelet analysis could bring more useful information about the damage. Ni and Iwamoto18) thought that the microscopic failure forms of fiber fracture, micro crack mechanism and the relationship between various damage forms could be more clearly identified by the wavelet analysis. Ni studied the AE damage characteristics of carbon fiber reinforced composite material through wavelet transform, who also obtained a few satisfactory results in the analysis of the different frequency range signal in order to reveal the failure mode and the interactions within the fiber and matrix of the material. The typical acoustic emission signal caused by the damage of the refractory is analyzed by wavelet transform in this work: through the study of wavelet energy spectrum coefficient and the energy distribution, the acoustic emission source signal characteristics are extracted and the different damage patterns with the characteristics shown from them are distinguished.
Based on the damage periods divided, a frequency analysis of AE transients coupled with a signal energy investigation makes it possible to identify load domains related to micro damage occurrence during the damage period.19) Since AE signals in composite materials are not stationary, time-frequency analysis has been first studied by the use of a short-time Fourier Transform (STFT) as in the paper20) where frequency bands, evolving in time, characteristic of each damage mechanism are determined during tensile test on carbon/epoxy materials. Thus, waveform processing of AE signals based on time-scale or time-frequency analysis appears to be a promising signal processing technique to discriminate the micro damage mechanisms. The typical signal is processed by FFT, the characteristic frequency-centroid frequency is defined in the frequency domain and the energy carried by the centroid frequency is used to depict the extent of the damage.
At last, the time history plot of the centroid frequency is produced. It shows the similarity of that of the energy which indicates that the extent of the damage could be explained by the centroid energy carried by the centroid frequency brought forward. Based on the AE experiment, the nonlinear mechanical property of refractory material is studied in the method of signal process: the damage pattern is recognized by means of coefficient analysis of the wavelet energy spectrum, and then the damage characteristics are extracted through the time-frequency analysis method according to the classification results and validated by the time history plot.
The industrial refractory materials tested in the study is composed of magnesia aggregates and a binder (phenolic resin or pitch) containing in some cases graphite and/or additional metallic elements (aluminium, silicon). Figure 1 shows an example of such microstructure. The magnesia aggregates are formed by sintering of crystallites with weak interfaces. The size of magnesia grains vary from less than one half millimeters to five millimeters. The other compound (SiO2, Al2O3) impurities are scattered in the carbon binder.
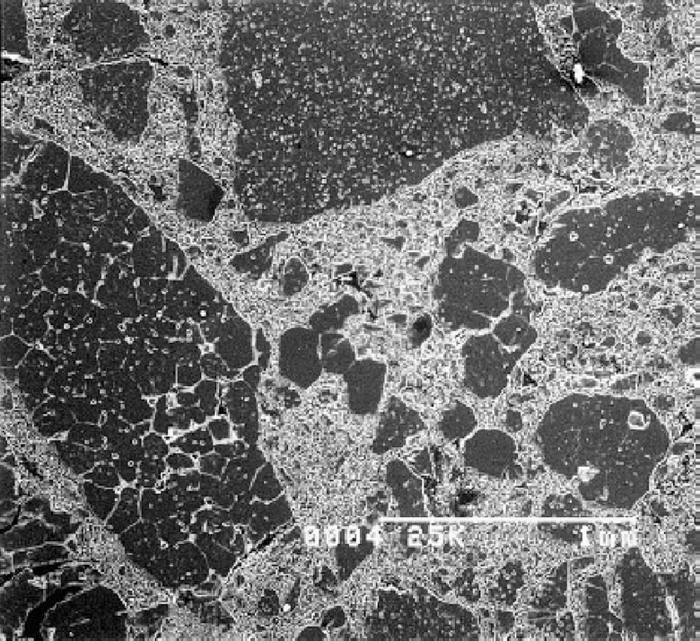
Typical microstructure of magnesia carbon refractory.
The components are mixed and shaped into bricks at low temperature (20–50°C) and under high pressure (150 MPa around). Then the bricks undergo heat treatment (100–200°C) to start the polymerization of resin8) and to eliminate residual water and phenols. Table 1 provides the composition of the materials after the heat treatment.
| Chemical composition, % (weight) | Phase composition, % (volume) | ||||
|---|---|---|---|---|---|
| MgO | C | SiO2 | Al3O3 | Aggregate phase | Continuous phase |
| 82.95 | 13.07 | 0.72 | 0.61 | 65 | 35 |
Static three point bending tests are performed using a HMOR/STRAIN loading machine. The crosshead speed of the machine is fixed at 0.05 mm/min. The tests are executed on three specimens of each configuration in order to ensure the accuracy of the results (Fig. 2).
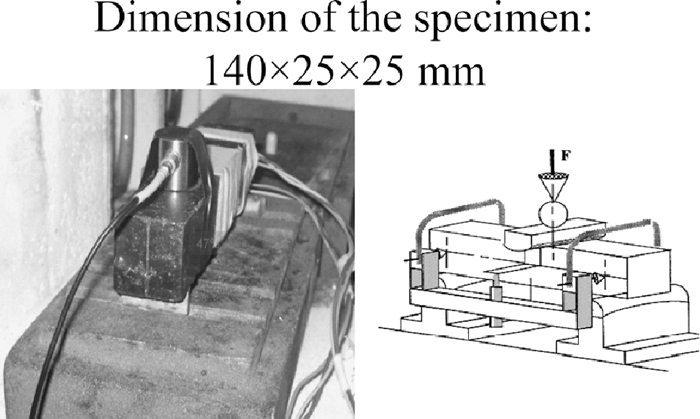
Experimental setup for three point bend test at room temperature. The left is the physical diagram and the right is the schematic one. The AE sensor is fixed on the specimen through the adhesive tape. The pressure actuating pressure head is imposed on the middle of the specimen.
AE is defined as phenomena whereby transient elastic waves are generated by the rapid release of energy from localized sources within a material (or structure). The AE, which represents the generation of transient ultrasonic waves due to damage development within the material under load, is an efficient technique for structural health monitoring. When a material is subjected to solicitations (such as mechanical, thermal, etc.), acoustic emission can be generated by a variety of sources, including crack nucleation and propagation, multiple dislocation slip, twinning, grain boundary sliding, Barkhausen effect (realignment or growth of magnetic domains), phase transformations in alloys, debonding of grain in composite materials or fracture of inclusions in alloys.2) This technique has been used either at the laboratory level or industrial scale. Usually, this technique is applied at room temperature as a non-destructive characterization technique in order to follow in real-time the evolution of the damage of a material subjected to mechanical loading.2) Here, the application of AE technique aims to characterize in situ for material micro damage monitoring at a very local scale.
The device of acquisition (Fig. 3) is composed of a wide band (175 kHz–1 MHz) sensor (PAC MICROPHONEμ80), a preamplifier (EPA 1220A) and an acquisition card associated with a computer (AEDSP-32/16 MISTRAS digital system from Physical Acoustics Corporation). The AE sensor is a major element of the chain of acquisition because it collects the whole of the signals induced by the elastic waves created within the material whose amplitudes are higher than a fixed threshold in order to amplify and to record them. This system records the waveform and the main feature parameters well known in AE study such as count, hit, rise time, duration of hit, count to peak, amplitude (in dB). Figure 4 presents different AE features extracted from the signal waveform.
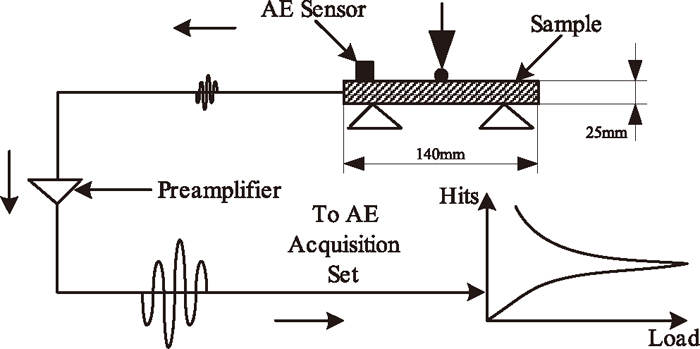
Experimental setup used for acoustic emission measurements.
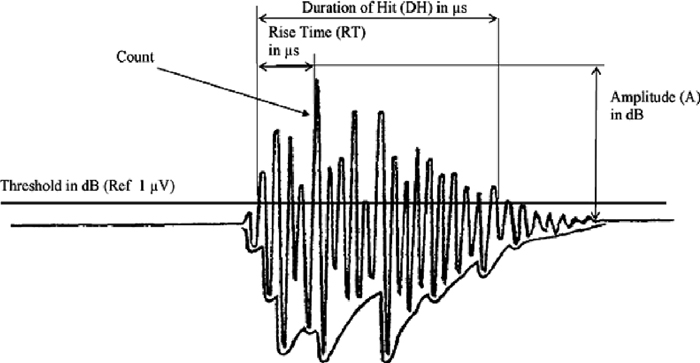
Typical AE features extracted from the recorded signal (hit).
The basic principle of the wavelet transform is by finding a set of wavelet basis functions and processing the signal after some forms of decomposition. Set f(t)∈L2(R), and the continuous wavelet transform of the function f(t) on the wavelet basis function ψ(t) is as follows:
| (1) |
When the signal is processed by the wavelet transform, a and b should be discrete, which is called discrete wavelet transform. Through the method the signal could be decomposed into approximation signal and the details of the signal, the approximation signal reflects to the low frequency components of the signal and the detail signal is the high ones. The signal is decomposed into a tree structure, which is as follows:
| (2) |
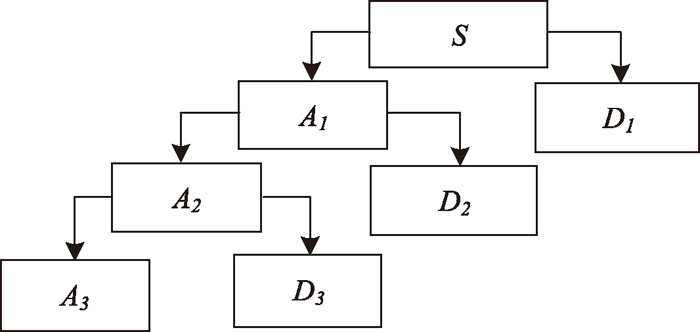
The structure of the three scale wavelet decomposition.
The signal is decomposed into different scales by the wavelet analysis and each scale component represents the different frequency range. The information on different decomposition scales could be reflected by the energy of different scales. Therefore, each component of the energy of wavelet decomposition is defined as follows:
| (3) |
| (4) |
The total energy of the signal is defined as:
| (5) |
The coefficient of the wavelet characteristic spectrum of the low and high frequency signal is denoted by
| (6) |
| (7) |
Several time-based descriptors are calculated by the acquisition system for each AE event (Fig. 4): the amplitude, the energy, the duration, the rise time, the number of times the amplitude of the event goes beyond the given amplitude threshold (called counts), etc. Only the amplitude of the signal is measured in real time by the data acquisition system. All the other descriptors are calculated from the waveforms and are very dependent on the amplitude threshold.
However, descriptor-based acoustic emission methodologies often focus on time features, which are not sufficient to fully characterized AE from complex materials. Most studies only use amplitude and the energy of the signal to characterize damage propagation.14) It has been shown by the paper18) that overall frequency content of AE signals is almost unchanged while the amplitude is greatly attenuated with long distance propagation. Thus several studies using short-time Fourier Transform (STFT) and continuous wavelet transform (CWT) procedures21,22) were performed to discriminate damage mechanisms in composites. A frequency analysis using the centroid frequency (fc), i.e. a sum of magnitude times frequency spectrum divided by a sum of magnitude as equivalent to the first moment of inertia is performed here Eq. (8). This frequency parameter is thus a frequency barycentre of the whole recorded signal.
| (8) |
With f the frequency obtained for each point S (f) of the FFT representation. Frequency contents are seriously influenced by the characteristics of the material. Therefore, the calculus of the maximum of the energy spectral density (peak frequency) does not bring enough information. Thereby, the centroid frequency will be preferred here to characterize frequency components of the signal. The frequency evolution will be used in conjunction with cumulative signal energy analysis of the AE signals to advance microstructure hypothesis.
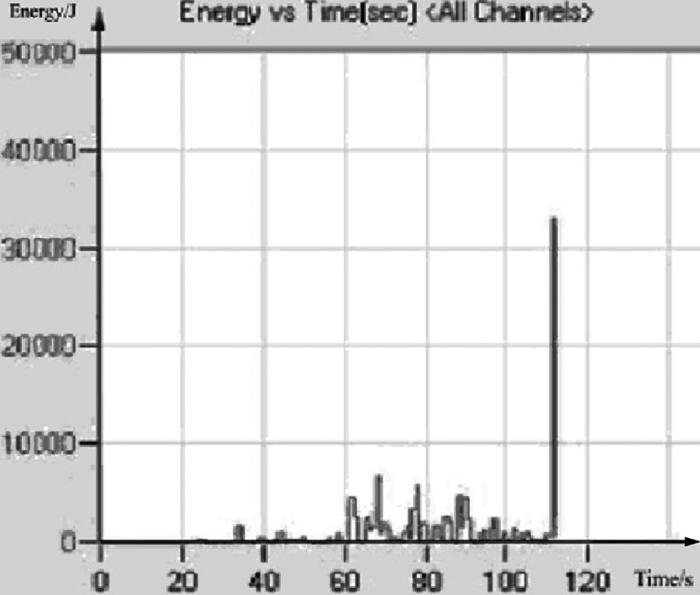
6.2. The Divide of the Damage PatternThe time history plot of the energy of the signal detected is shown in Fig. 6. According to Fig. 6, the time history plot of the accumulative energy of the signal is shown in Fig. 7. The damage process could be generally divided into 4 stages based on Fig. 6:
The time history plot of the energy of the signal.
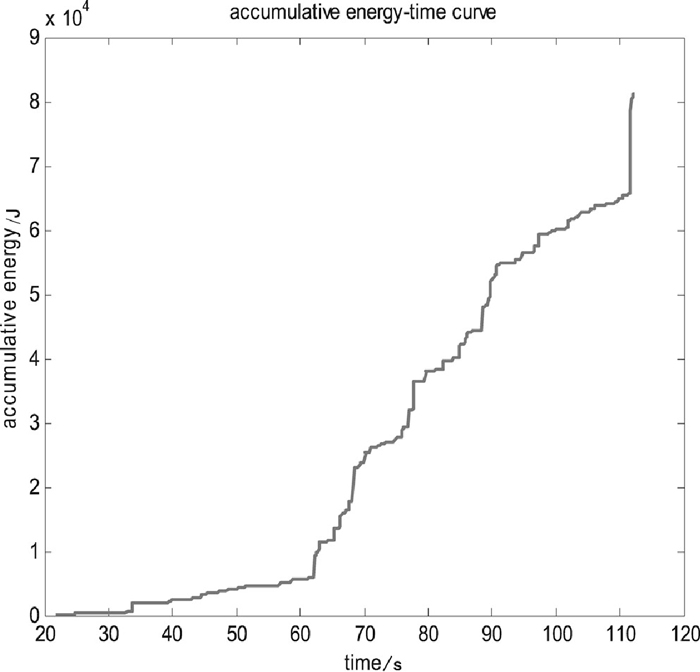
The time history plot of the accumulative energy of the signal.
The first stage is the initial of the damage (0–20 s). It could be seen from the figure that the energy remains still 0–20 s, the energy appears small fluctuation after 20 s, which indicate that there is few damage and AE hits inside the material and energy released by the damage in this period of time;
The second stage is the slow development of the damage (20–60 s). Compared to the first stage, the time history plot of the energy appears apparent fluctuation, which means with the increment of the load, the damage inside the material begins to accumulate and expand, and the energy also begins to increase and tend to be stable;
The third stage is the gradually aggravated stage of the damage (60–100 s). With the continuously rise of the load, the damage inside the material further increased, the plot exhibits large fluctuation and the energy released goes up apparently;
The fourth stage is the rapidly aggravated stage of the damage (100–120 s). In this period of time, both the AE hits and the energy go up rapidly.
On the preliminary classification base on the energy, more typical signals are studied: First the signals are decomposed by the wavelet transform, and then the signals are analyzed by the method of the coefficient of the wavelet characteristic spectrum. The db8 basis wavelet is depicted and the decomposition scale J=7. The signals are decomposed through 7 layer scales and 8 frequency domains are obtained with the sampling frequency of fs=1 MHz, each frequency domain is shown as follows:
| (9) |
| (10) |
The typical signal of the four stage periods are analyzed by the method upwards and the percentage of each energy of scale in total energy is computed from Eqs. (3), (4), (5), (6), (7), the coefficient table of the wavelet characteristic spectrum is shown as follow:
In addition, according to the characteristic energy parameter computed, the histograms are made in order to expressed clearly the percentage of each scale energy, which is shown in Fig. 8.
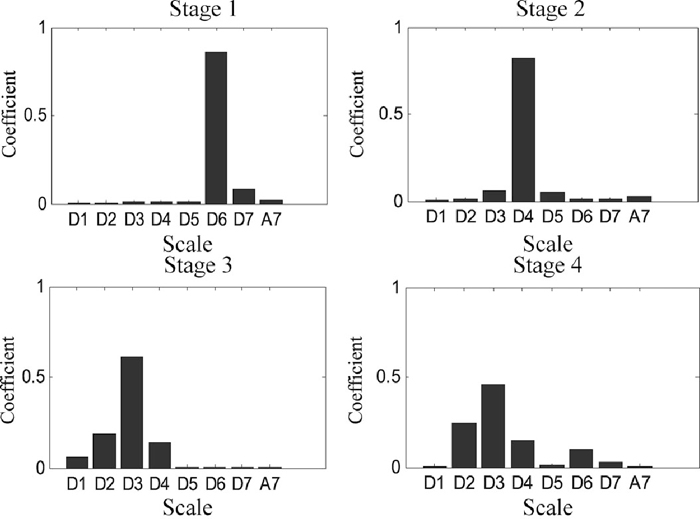
The histograms of the coefficient table of the wavelet characteristic spectrum.
Combined Table 2 with Figs. 7 and 8, the damage could be updated into three stages through the whole loading process:
| Scale | D1 | D2 | D3 | D4 | D5 | D6 | D7 | A7 |
|---|---|---|---|---|---|---|---|---|
| Frequency domain/kHz | 250–500 | 125–250 | 62.5–125 | 31–62.5 | 15.6–31 | 7.8–15.6 | 3.9–7.8 | 0–3.9 |
| First stage/% | 0.06 | 0.07 | 1.52 | 1.20 | 1.09 | 85.70 | 8.65 | 1.71 |
| Second stage/% | 0.32 | 1.15 | 5.89 | 81.63 | 5.57 | 1.54 | 1.20 | 2.70 |
| Third stage/% | 5.94 | 18.45 | 60.83 | 14.07 | 0.32 | 0.10 | 0.07 | 0.22 |
| Fourth stage/% | 0.44 | 24.75 | 46.08 | 14.60 | 1.33 | 9.73 | 2.48 | 0.59 |
In the first stage, the energy caused by the initial damage is mainly centralized in D6 and D7 scales, which account for the 94% of the total energy in this stage. The energy is highly centralized in the low frequency, which indicates that the characteristic damage signals are distributed 7–15 kHz. According to Eq. (8), the centroid frequency is 10.8892 kHz;
In the second stage, with the increment of the load, the energy is in consistent slow development. It could be seen from Table 2, the energy of the original second and third stages are mainly distributed in D3 and D4 scales, which accounts for more than 70% of the total energy respectively and the centroid frequency is 43.9836 kHz. Because of the similar characteristic frequency and energy, the former two stages could be combined to one stage;
In the third stage, the damage develops near to destruction. The high frequency signals are detected and the energy distribution is different from the former two stages apparently, which spreads multi-frequency: the high frequency signals centralized in D2 account for 25% of the total energy, and the frequency of D3 and D4 scales still exists and accounts for 60% of the total energy. The frequency of D6 scale accounts for 10% of the total energy. The frequency distribution ranges widely from 7 KHz to 125 kHz and the centroid frequency is 98.3972 kHz.
6.3. Analysis of Energy Corresponds to FrequencyIn order to investigate the relationship between energy and frequency, the time history plot of the centroid frequency is produced which is shown below:
Compared Figs. 9 with 6, it shows the similarity of that of the energy which indicates that the extent of the damage could be explained by the centroid energy carried by the centroid frequency brought forward.
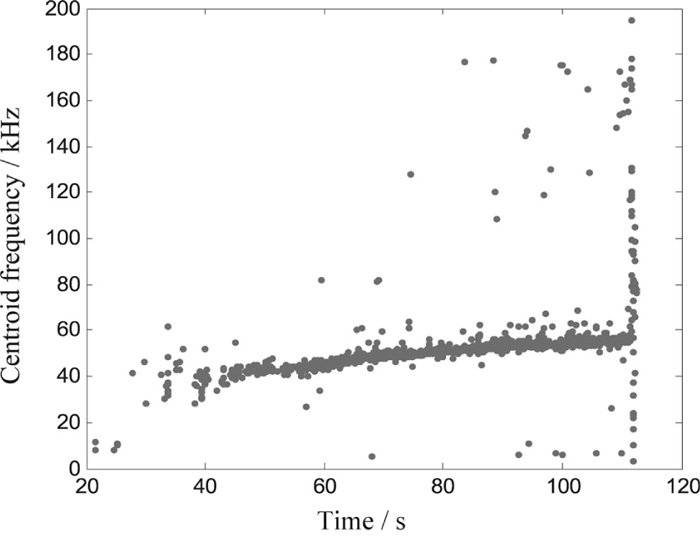
The time history plot of the centroid frequency.
According to the periods divided, the time and frequency span widely for some damage forms. It is in urgent need to find a kind of characteristic parameter which could not only characterize the damage mode but also the extent of the damage. On the basis of the periods divided, the centroid frequency could be used to characterize the mode of the damage. Since the extent of the damage could be characterized by energy, but the energy spans widely and could not identify the energy representative as a description of the extent seen from Fig. 6. However, compared Figs. 9 with 6, it shows the similarity of the distribution of the centroid frequency with the energy which indicates that the extent of the damage could be explained by the energy brought forward, which means that the energy could also react the energy center. The parameters put forward here could be prepared for the damage mechanical model of refractory.
Static three-point bending tests are performed under the monitor of the AE sensor. By means of coefficient analysis of the wavelet energy spectrum, the damage is divided into three periods. The energy of the first two stages is mainly centralized in single low frequency band range, which means no apparent damage happens in the stages. When the damage enters the third stage, the crack in the matrix has begun to expand into the interface, which is accompanied with the high frequency of 62–125 kHz. Seen from the energy distribution of the third stage, the energy also accounts for the low frequency of 31–62 kHz and 9–16 kHz, which indicates that besides the damage of interface, there is still damage of the matrix and the gradually aggravation of damage of this stage results from the overlap of the damage.
Based on the classified results, time-frequency analysis is used to extract the damage characteristics and the centroid energy carried by the centroid frequency is put forward in the explanation of the extent of the damage. At the same time, the waveform overlap is figured out according to the study of the amplitude of power spectrum and the characteristic frequency: the time period of the first stage is 0–20 s, the frequency band is 7–15 kHz and the centroid frequency is 10.8892 kHz; the time period of the second stage is 20–100 s, the frequency band is 30–60 kHz and the centroid frequency is 43.9837 kHz; the time period of the third stage is 100–120 s, the frequency band is 7–15 kHz, 30–60 KHz and 100–120 kHz respectively and the centroid frequency is 98.3972 kHz, which is mainly centralized in the high frequency part and the combined damage maintains to the end.
Finally, the time history plot of the centroid frequency is produced. It shows the similarity of that of the energy which indicates that the extent of the damage could be explained by the centroid energy carried by the centroid frequency brought forward.
The authors would like to thank the National Natural Science Foundation of China (51075310), the Research Fund for the Doctoral Program of Higher Education of China(20114219110003), the Hubei Province Natural Science Fund Project (2012FFA022) and Program for New Century Excellent Talents in University of Ministry of Education of China (NCET-12-0715) for the financial support.