Abstract
Fatigue failure tests were firstly carried out. The material constant derived from S-N curve was evaluated and compared with previous study. The compliance method was subsequently used to evaluate the fracture toughness of MgO–C brick and the relationship between the stress factor and crack growth rate. In order to use this method, the effects of brick carbon content on the crack growth rate and crack growth rate in high temperature were investigated.
As a result, it was found that the crack growth rate increased when the carbon content in brick decreased. This result was confirmed by X-ray CT scans, which revealed large cracks in bricks with a lower carbon content, even in the middle of fatigue failure tests.
Furthermore, the material constants obtained from fatigue failure test and K-V diagram were compared. A material constant was derived by evaluating the relationship between the crack growth rate and stress intensity factor, and the result was found to agree with the value derived from fatigue failure tests. This result confirms that that material constant derived from fatigue failure tests is the inherent property of the material and corresponds to the variation of crack growth rate with changes in stress factor. The effects of carbon content in MgO–C brick on the crack growth behaviour and fatigue failure mechanism were also investigated.
1. Introduction
Damage to refractories used in iron-making and steel-making equipment such as converters or steel-making ladles is often caused by mechanical processes like thermal spalling and mechanical spalling. In steel-making vessels, thermal spalling damage can occur not only immediately in new linings, but also after a long period of use. It thus seems that this type of damage is caused not by thermal gradients (i.e., thermal shock fracture), but by the growth of cracks generated by cyclical changes of stress as the vessel is repeatedly filled with molten metal end emptied again.
It is therefore important to clarify the relation between the long-term thermal cycling and fracture of refractories. To this end, it is necessary to investigate the fatigue failure behaviour and crack propagation behaviour of refractories.1)
In previous studies, the authors considered spalling from the viewpoint of fracture mechanics, and investigated the fatigue failure of MgO–C bricks and Al2O3–SiO2 bricks.2,3) In particular, it was found that the fatigue failure of MgO–C bricks is unaffected by atmospheric temperature, and that the fatigue failure life under the same acting stress ratio decreases as the carbon content in brick decreases. Based on an investigation into the relationship between fatigue failure and thermal spalling, it was also found that resistance to dynamic fatigue failure is one factor that can provide excellent resistance to thermal spalling. However, the mechanism of fatigue failure in brick, and in particular, the variation of fatigue failure behaviour with carbon content, is still unclear.
To clarify these differences, it is necessary to compare and evaluate the physical properties pertaining to the occurrence of fractures and the propagation of cracks in materials subjected to cyclical stresses. This can be achieved by evaluating fracture mechanics data such as the fracture toughness and the relationship between the stress intensity factor and crack growth rate (i.e., K-V diagram). However, although a lot of fracture mechanics data has been reported for fine ceramics, there is not much data available for refractory materials.4,5,6,7,8,9,10,11,12,13,14)
In this study, in order to clarify the crack growth behaviour and fracture behaviour under cyclical loads, we used the compliance method to determine the fracture toughness of MgO–C bricks and the relationship between crack growth rate and stress intensity factor (K-V diagram). We also subjected the same samples to fatigue failure tests by applying cyclical compressive stresses and estimating the S-N curves. Values of the numerical index n′ were derived from these S-N curves. These values were then compared with corresponding values obtained from K-V diagrams.
We also discuss the mechanism of fatigue failure behaviour of refractory materials based on the crack propagation behaviour in MgO–C bricks according to the experimental result of this study.
2. Experimental Procedure
2.1. Fatigue Failure Test
The fatigue failure of MgO–C brick was evaluated by the same method as used previously by the authors,2) so the experimental procedure is not described in detail here. The experimental conditions are summarized in Table 1. MgO-10%C, MgO-15%C and MgO-20%C bricks were used as the samples. In the MgO–C bricks, a phenol resin system organic material is used as a binder generally. If the MgO–C bricks are heated under the condition used in steelmaking furnace (temperature: 1273–1973 K, CO gas rich atmosphere), volatilisation of the binder material occurs and the properties of the brick change from those of the initial brick. In this study, the sample bricks were prepared by heat treatment at a temperature of 1623 K with a holding time of 3 hours in a SiC sagger filled in coke powder in order to simulate the conditions inside an actual furnace and prevent carbon loss by oxidation during heating. Compressive loads were applied to 30 mm cubic samples, while the upper limit of loading was varied from 70% to 100% of compressive strength (which is equivalent to the modulus of rupture under compressive stress). The lower limit of compressive loading was kept at a constant value of 10% of compressive strength. All the experiments were carried out at room temperature. In some of the experiments, a strain gauge was used to measure changes of strain in the horizontal direction (perpendicular to the loading direction) during cyclical compressive loading. Besides, the situation of crack generation inside of MgO–C sample was observed by using X-ray CT scan at the time when the fatigue failure was suspended before the fracture occurred. The observation of whole sample scanning was carried out with a condition of irradiation X-ray voltage: 90 kV, current: 110 μA. After that, three-dimensional scanning images were divided into over 300 pieces of two-dimensional images at 0.09 mm interval, and the position of crack in the brick was confirmed by observing each image one by one.
Table 1. Experimental conditions of fatigue failure test.
| (Materials condition) |
|
| Sample | MgO-20%C(Compressive strength: 24.5 MPa) |
| MgO-15%C (Compressive strength: 16.6 MPa) |
| MgO-10%C (Compressive strength: 15.1 MPa) |
| Heat treatment in a reducing atmosphere at 1623 K for 3 hours |
| (Loading condition) | |
| Shape of sample | 30 mm cubic (30 mm × 30 mm × 30 mm) |
| Loading direction | compressive direction |
| Loading frequency | 0.05 Hz (20 sec/cycle) |
| Atmosphere temperature | 298 K (room temperature) |
| Value of load Upper limit | 70%–100% of compressive crushing stress |
| lower limit | 10% of compressive crushing stress |
Figure 1 shows a schematic diagram of the experimental method used to estimate the fracture toughness and K-V diagram. Bending tests were carried out using a single-edged notched beam (SENB) specimen. These tests were performed using four-point bending mainly. The experimental conditions are summarized in Table 2. This test was performed by using MgO-10%C, MgO-15%C and MgO-20%C bricks which were the same as the samples in the fatigue failure test. Samples for bending test were also prepared by heat treatment at a temperature of 1623 K with a holding time of 3 hours in the coke-filled sagger in order to simulate the situation in steelmaking furnace and prevent from oxidation loss of carbon during heating. The width of sample was 14 mm, the height of sample was 16 mm and length of sample was 200 mm. The outer span was 160 mm and inner span was 80 mm. A single edged notch was introduced in each sample with the constant width of 1 mm and uniform depth. Then the notch depth was varied so as to have the ratio of notch to sample height between 0.1 and 0.35 while maintaining a constant height of the sample.15,16) The loading speed was kept constant at 0.05 mm/min. The experiments were performed at room temperature mainly. While as, some of the experiments with MgO-20%C brick were also conducted at high temperature (1473 K). some experiments at a high temperature were carried out by the following method; a sample was set in the electric resistance furnace and heated to 1473 K. After that, the bending test was carried out in the atmosphere at 1473 K. The test at 1473 K was performed using 3-point bending due to the limitation in the experimental apparatus.

Table 2. Experimental conditions of bending test.
| Terms | Conditions | |
|---|
| Testing samples | MgO-10%C
MgO-15%C
MgO-20%C | Heat treatment in a reducing atmosphere at 1623 K for 3 hours |
| Outer span | 160 mm | |
| Inner span | 80 mm | |
| Height of sample | 16 mm | |
| Width of sample | 14 mm | |
| Notch depth:a | 2–5 mm | |
| Notch width:b | 1 mm | |
| Loading speed | 0.05 mm/min. | |
| Ambient temperature | 298 K (Room temperature), 1473 K |
3. Experimental Results
3.1. Fatigue Failure Test
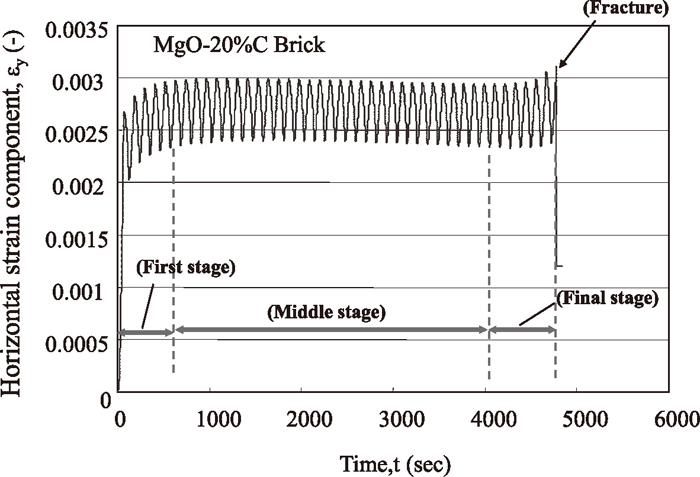
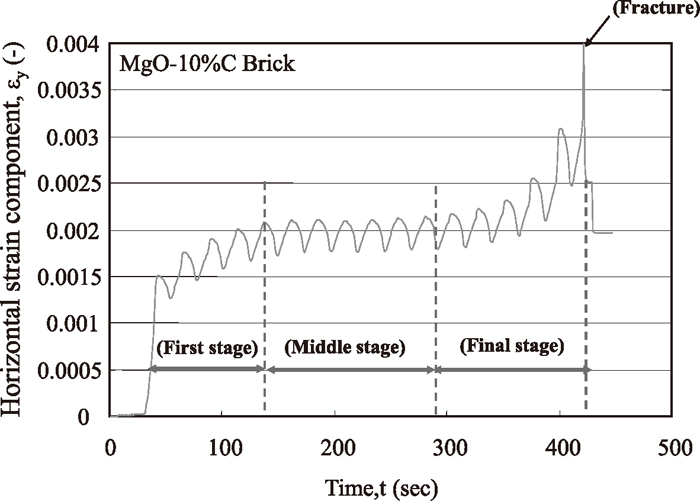
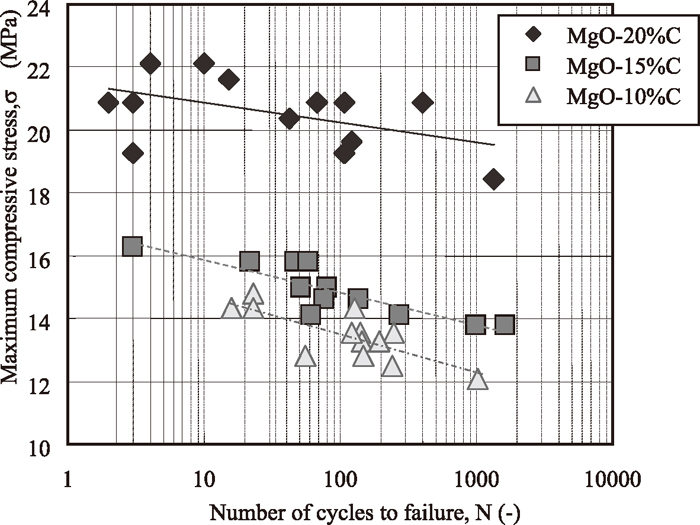
Figure 2 shows the relationship between the maximum compressive stress and the number of cycles to failure (i.e., the S-N curve) for bricks with compositions of MgO-10%C, MgO-15%C and MgO-20%C respectively. The slope of this curve becomes increasingly negative as the carbon content decreases. In other words, fatigue failure of bricks with a lower carbon content occurs after fewer load cycles, even at lower stresses. Figures 3 and 4 show how the changes of horizontal strain in MgO-20%C and MgO-10%C when subjected to cyclical compressive stress. This horizontal tensile strain was caused by Poisson’s effect in both cases. As discussed in a previous report, the strain behaviour in fatigue failure tests can be divided into three regions — a first stage in which the strains generated by the deformation gradually increase, a middle stage in which the strains increase at a much slower rate, and a final stage in which the strains increase again until the point of fracture. For bricks with a composition of MgO-20%C, the strain remained more or less constant during the middle stage, while for MgO-10%C bricks, the strain increased gradually as the number of cycles increased.
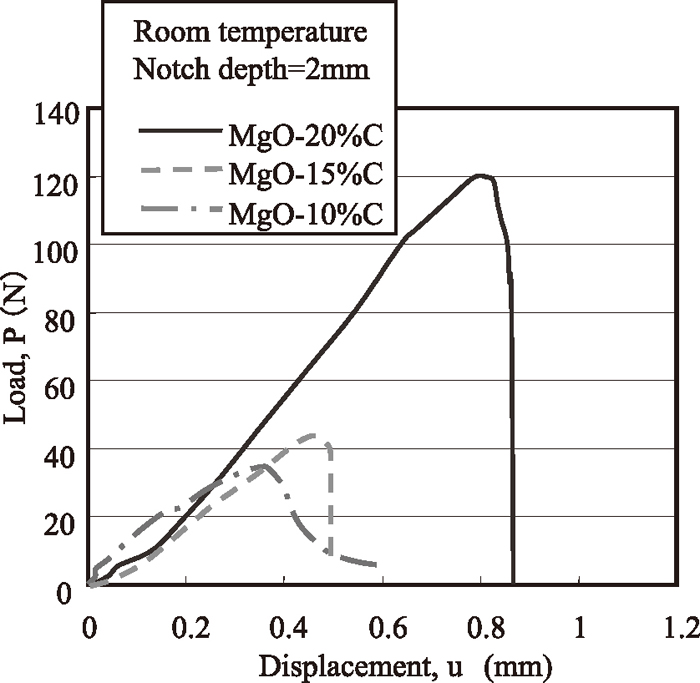
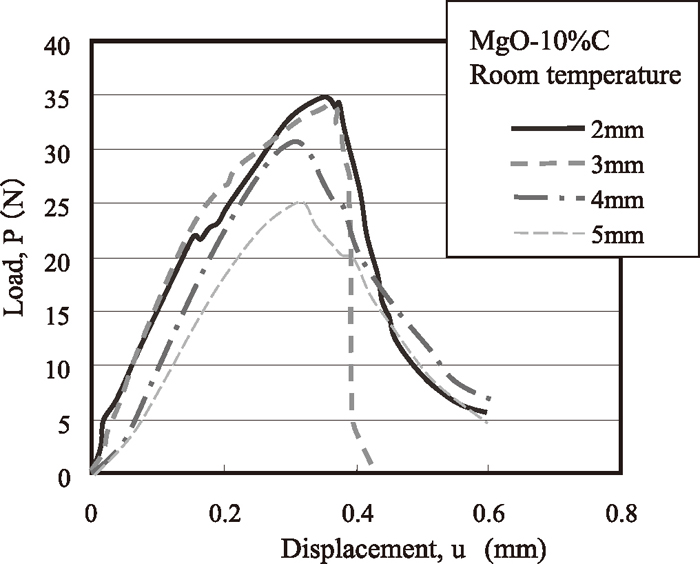
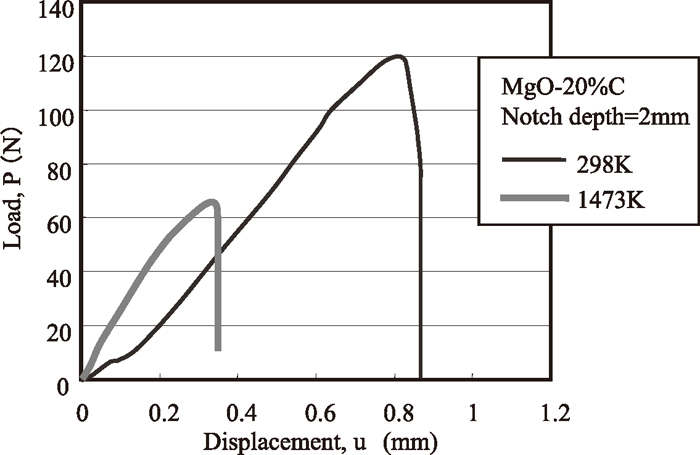
As an example of the experimental result, Fig. 5 shows the load-displacement curves at the centre of brick samples with various carbon contents, and Fig. 6 shows the load-displacement curves obtained with various different notch depths. Figure 7 compares the load-displacement curves obtained at high temperature and room temperature. From Fig. 5, it can be seen that the maximum load and the gradient of the linear part of the load-displacement curve both decrease as the carbon content of the brick decreases. From Fig. 6, it can be seen that the initial gradient of the load-displacement curve decreases when the depth of notch increases. And as shown in Fig. 7, the maximum load decreases at high temperature. We analysed the fracture mechanics based on these results.
4. Discussion
4.1. Determination of Material Index from Fatigue Failure Test
The observation of the samples after fracture showed that cracks progressed in the direction perpendicular to the loading phase, and the morphology of fracture was similar to the authors’ previous study. From this result, the fracture mode of these bricks in this experiment was regarded as mode I, according to Irwin’s linear elastic theory.17) Paris’s law can be applied to crack progress behaviour as shown in Eq. (1).18) Extracting Eq. (1), the relationship between the acting stress differential Δσ and the number of loading cycles until fracture N can be obtained as Eq. (2).
|
da
dt
=C
(
K
I
K
IC
)
n'
,
da
dN
=C
(
Δ
K
I
K
IC
)
n'
| (1) |
|
logΔσ=-
1
n'
logN
+
1
n'
log[
2
K
IC
n'
C⋅Y
π
n'
2
⋅(
n'-2
)
(
a
0
-
n'-2
2
-
a
c
-
n'-2
2
)
]
| (2) |
where
n′ is the aforementioned material constant, which depends on the experimental conditions, atmosphere and temperature. According to
Eq. (1), physical implication of material constant
n′ can be considered as the degree of sensitivity to changes in the growth of the crack and in the stress intensity factor. And this material constant is also related with the dynamic fatigue failure. It has been clarified that the material with a high value of n’ shows high resistance to dynamic fatigue failure and dynamic thermal fatigue.
2,19) The value of
n′ was determined from fatigue failure tests, assuming that the relation of
Eq. (2) holds for each plot in
Fig. 2.
Table 3 lists the material constants obtained from the fatigue failure tests. Besides, the material constant which the authors have evaluated from the results of fatigue failure test of MgO–C brick previously is also shown in
Table 3. The material constant which was obtained in this study resulted in slightly lower value than in the previous work. It was thought that this was attributed to the difference of the material condition such as particle distribution, additives and so on. On the other hand, the value of
n′ increases as the carbon content in brick increases. It was confirmed that this tendency agreed with the results of an earlier study by the authors.
2)Table 3. Values of numerical index
n′ derived from fatigue failure tests, compared with previous study by Hino
et al.
2) | Temperature | Material constant n′ obtaind from fatigue failure test | Material constant n′ obtaind by Hino et al.2) |
|---|
| MgO-10%C | (298 K) | 22.1 | 29.8 |
| MgO-15%C | (298 K) | 27.5 | 35.3 |
| MgO-20%C | (298 K) | 42.2 | 52.4 |
The fracture toughness of MgO–C bricks was understood by using Eqs. (3) and (4) from JIS R 1668 (Testing method for fracture toughness of porous fine ceramics)20) based on the maximum value of each load-displacement curve in Figs. 5,6,7.
|
K
1C
=
3
P
max
(
L-l
)
2B
W
2
πa
⋅f(
a
/
W
)
| (3) |
|
f(
a
/
W
)
=
2W
πa
⋅tan(
πa
2W
)
⋅
0.923+0.199
(
1-sin(
πa
2W
)
)
4
cos(
πa
2W
)
| (4) |
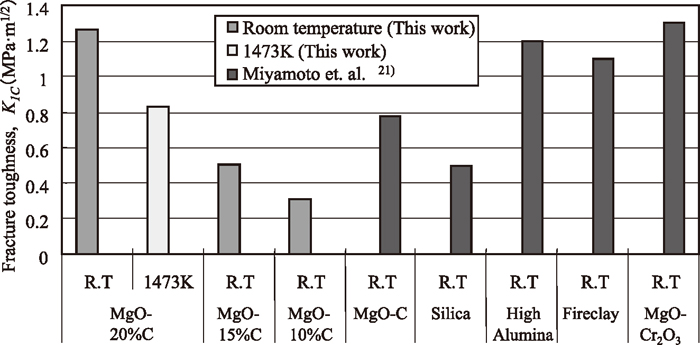
Figure 8 shows the fracture toughness values obtained in this study. From a comparison of the values obtained under various conditions, the fracture toughness decreases as the carbon content in brick decreases. Also, by comparing the values obtained with MgO-20%C at room temperature and at high temperature (1473 K), it can be seen that the fracture toughness is lower at high temperature. Overall, the fracture toughness values obtained in this study are similar to the values reported by Miyamoto et al.21) Hence, it can be regarded that the value of fracture toughness is valid.
4.3. Evaluation of Crack Growth Behaviour
In the SENB bending tests performed in this study, a tensile stress acts so as to increase the width of the notch in the lower surface of the test specimen. Therefore, the fracture mode of materials in these tests can be considered as mode I.22,23,24) The crack propagation behaviour was evaluated by the compliance method.23)
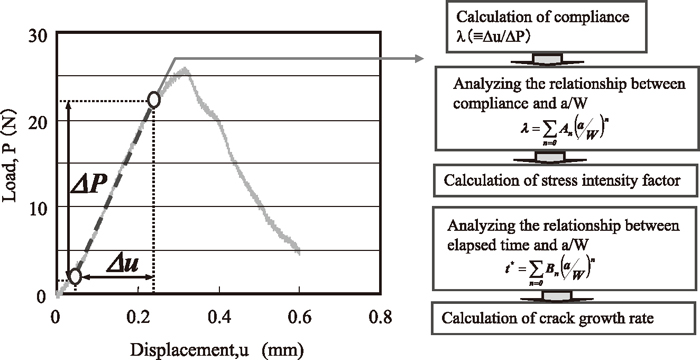
Figure 9 shows the analytical procedure of compliance method. Generally, the compliance stands for the physical property which expresses the degree of deformation when some loads are apllied to the material. Load-displacement curves showed approximately linear relationship at the initial stage and curving behaviour near the peak load. The compliance value, λ, which corresponds to the reciprocal of the load-displacement curve gradient (in the linear relation area), can be defined in terms of the change of load ΔP and the change of displacement Δu, as shown in Eq. (5). A polynomial approximation curve can then be obtained by regression analysis from the value of λ and the relative crack length, which is a dimensionless quantity defined as the notch depth divided by the height of the sample as shown in Eq. (6). The change in compliance was calculated according to the differentiation formula of Eq. (7). The stress intensity factor can be calculated from Eq. (9) by substituting the value of the compliance change and the static modulus of elasticity shown in Eq. (8).
|
λ=
∑
n=0
A
n
⋅(
a
/
W
)
n
| (6) |
|
∂λ
∂a
=
∂
∂(
a
/
W
)
λ(
a
/
W
)
⋅
∂(
a
/
W
)
∂a
|
a
/
W
=
1
W
∂
∂(
a
/
W
)
λ(
a
/
W
)
|
a
/
w
=
1
W
∑
n=0
n⋅
A
n
⋅(
a
/
W
)
n-1
|
a
/
w
| (7) |
|
E=
(
L-l
)
2
(
2l+L
)
4B
W
3
⋅Δu
⋅ΔP
| (8) |
|
K
1
=
E
2B
⋅
∂λ
∂a
⋅P
| (9) |
As an example of the experimental results, Fig. 10 shows the relationship between the compliance and relative crack length, a/W in MgO-10%C brick at room temperature. In the fracture mechanics of ceramic materials, the relationship between the relative crack length and physical quantities (e.g., compliance, or the correction coefficient of the stress intensity factor) is generally expressed by polynomial approximation curve.25,26,27) In this work, regression analysis was performed with the 4th order polynomial shown in Eq. (10). Table 4 lists the coefficients of each MgO–C brick obtained in this regression analysis.
|
λ(
a
/
W
)
=
A
0
+
A
1
(
a
/
W
)
+
A
2
(
a
/
W
)
2
+
A
3
(
a
/
W
)
3
+
A
4
(
a
/
W
)
4
| (10) |
Table 4. Regression curve coefficients for the relation between compliance
λ and relative crack length
a/
W.
| A0 | A1 | A2 | A3 | A4 |
|---|
| MgO-20%C brick (This work ) | 5.071 | –12.6 | 132.5 | –472.97 | 1031 |
| MgO-15%C brick (This work ) | 9.545 | –23.8 | 249.44 | –816.75 | 1293 |
| MgO-10%C brick (This work ) | 6.602 | –16.5 | 172.53 | –615.75 | 1223 |
The changes in compliance corresponding to each of these a/W values can be derived from the differential coefficients of the regression curve by using Eqs. (7) and (10). Also, the stress intensity factor for mode I can be determined by substituting these results into Eqs. (8) and (9).
On the other hand, the notch of SENB specimen that is evaluated in this study can be assumed as a pre-introduced crack. During an experiment, when a crack started to grow at the inner tip of the notch deviation from the linear relation of load-displacement took place. Thereby, the time before the deviation was evaluated, as the crack growth rate corresponding to the pre-introduced length of crack of the a/W. The elapsed time t* of the compliance evaluation section (corresponding to the interval between the start of the test and the maximum point of linear region) can be computed from the displacement magnitude and loading speed. The elapsed time can be calculated using a simple equation expressed by Eq. (11).
When the compliance value is expressed in terms of the relative crack length as in Eq. (10), the elapsed time of the compliance evaluation section can also be regarded as a function of the relative crack length. Figure 11 shows the result of analysing the relation between the elapsed time and relative crack length in the same manner as in the analysis of the relation between compliance and relative crack length in case of MgO-10%C. The curve in this figure shows the result of a polynomial regression analysis. This function is expressed as Eq. (12). The value of a/W which corresponded to the elapsed time in each condition was derived from Eq. (12), and its differential coefficient was calculated using Eq. (13). The crack growth rate can be calculated from the reciprocal of this differential coefficient as shown in Eq. (14).
|
t*(
a
/
W
)
=
∑
n=0
B
n
⋅
(
a
/
W
)
n
| (12) |
|
(
dt
da
)
|
t=
t
*
=
dt
d(
a
/
W
)
⋅
d(
a
/
W
)
da
|
a
/
W
=
1
W
dt
d(
a
/
W
)
|
a
/
W
=
1
W
{
∑
n=0
n⋅
B
n
⋅
(
a
/
W
)
n-1
}
|
a
/
W
| (13) |
|
da
dt
=
(
dt
da
)
-1
|
t=
t
*
=
1
1
W
{
∑
n=0
n⋅
B
n
⋅
(
a
/
W
)
n-1
}
|
a
/
W
| (14) |
The relationship between the stress intensity factor and crack growth rate in MgO–C bricks (i.e., the K-V diagram) can be evaluated based on this analysis. Tables 5 and 6 list the stress intensity factor and fracture toughness obtained in this study, respectively. Figure 12 shows the K-V diagrams of MgO-10%C, MgO-15%C and MgO-20%C at room temperature, and Fig. 13 compares the K-V diagrams of MgO-20%C brick at room temperature and high temperature.
Table 5. Values of fracture toughness and stress intensity at room temperature.
| Brick | Ambient temperature | Fracture toughness, KIC (MPa·m1/2) | Stress intensity factor for Mode I,KI (MPa·m1/2) | Crack growth rate (m/s) |
|---|
| MgO-10%C | R. T. (298 K) | 0.36 | 0.10 | 9.39 × 10⁻⁶ |
| 0.41 | 0.10 | 9.74 × 10⁻⁶ |
| 0.32 | 0.09 | 1.28 × 10⁻⁵ |
| 0.26 | 0.07 | 1.30 × 10⁻⁵ |
| 0.24 | 0.07 | 1.32 × 10⁻⁵ |
| 0.35 | 0.11 | 9.70 × 10⁻⁴ |
| 0.26 | 0.18 | 3.83 × 10⁻³ |
| 0.28 | 0.19 | 7.20 × 10⁻³ |
| 0.26 | 0.19 | 7.21 × 10⁻³ |
| 0.32 | 0.24 | 1.09 × 10⁻² |
| 0.36 | 0.31 | 1.44 × 10⁻² |
| 0.26 | 0.14 | 2.43 × 10⁻² |
| MgO-15%C | R. T. (298 K) | 0.54 | 0.24 | 1.22 × 10⁻⁵ |
| 0.48 | 0.22 | 1.31 × 10⁻⁵ |
| 0.57 | 0.23 | 1.95 × 10⁻⁵ |
| 0.38 | 0.37 | 2.33 × 10⁻² |
| 0.53 | 0.44 | 1.21 × 10⁻² |
| 0.54 | 0.29 | 1.71 × 10⁻² |
| 0.48 | 0.31 | 1.07 × 10⁻² |
| 0.54 | 0.41 | 8.39 × 10⁻³ |
| 0.63 | 0.51 | 1.47 × 10⁻² |
| 0.56 | 0.52 | 7.58 × 10⁻³ |
| 0.64 | 0.50 | 5.08 × 10⁻³ |
| MgO-20%C | R. T. (298 K) | 1.22 | 0.64 | 1.74 × 10⁻⁷ |
| 1.18 | 0.62 | 1.74 × 10⁻⁷ |
| 1.29 | 0.68 | 2.08 × 10⁻⁷ |
| 1.33 | 0.71 | 2.22 × 10⁻⁷ |
| 1.32 | 0.70 | 2.30 × 10⁻⁷ |
| 1.37 | 0.73 | 2.23 × 10⁻⁷ |
| 1.25 | 0.66 | 2.73 × 10⁻⁷ |
| 1.22 | 0.65 | 2.77 × 10⁻⁷ |
| 1.36 | 0.71 | 2.07 × 10⁻⁷ |
| 1.35 | 0.73 | 1.99 × 10⁻⁷ |
| 1.03 | 0.55 | 2.78 × 10⁻⁷ |
| 1.25 | 0.97 | 8.65 × 10⁻³ |
| 1.18 | 1.05 | 9.53 × 10⁻³ |
| 1.36 | 1.25 | 8.76 × 10⁻³ |
| 1.29 | 0.99 | 3.69 × 10⁻³ |
| 1.33 | 1.08 | 8.41 × 10⁻³ |
| 1.32 | 0.90 | 5.75 × 10⁻³ |
| 1.03 | 0.69 | 5.69 × 10⁻³ |
| 1.25 | 1.05 | 1.17 × 10⁻² |
Table 6. Values of fracture toughness and stress intensity at high temperature.
| Brick | Ambient temperature | Fracture toughness, KIC (MPa·m1/2) | Stress intensity factor for Mode I,KI (MPa·m1/2) | Crack growth rate (m/s) |
|---|
| MgO-20%C | 1473 K | 0.88 | 0.43 | 1.23 × 10⁻⁵ |
| 0.73 | 0.35 | 1.60 × 10⁻⁵ |
| 0.59 | 0.28 | 1.97 × 10⁻⁵ |
| 0.46 | 0.23 | 1.99 × 10⁻⁵ |
| 1.33 | 0.66 | 2.00 × 10⁻⁵ |
| 0.40 | 0.21 | 2.51 × 10⁻⁵ |
| 0.90 | 0.48 | 1.02 × 10⁻² |
| 0.59 | 0.34 | 1.82 × 10⁻² |
| 0.90 | 0.72 | 8.02 × 10⁻² |
| 0.46 | 0.38 | 8.13 × 10⁻² |
| 0.32 | 0.29 | 4.20 × 10⁻² |
| 0.92 | 0.87 | 6.21 × 10⁻² |
| 1.33 | 1.33 | 2.30 × 10⁻² |

In general, the behaviour of crack growth rates in inorganic materials can be divided into three regions. In region 1, a process zone associated with a chemical reaction (e.g., formation of hydrates or corrosion of the microstructure) forms at the tip of the crack. In region 2, the hydrates or other reaction products diffuse to the crack tip. And in region 3, the crack growth rate is governed by complex factors including mechanical and chemical actions. It has also been found that the crack growth rate increases with increasing stress intensity factor in region 1, stabilizes at a constant value in region 2, and then increases again in region 3. (In this study, we only evaluated the crack growth rate as far as region 2.)
It has been reported that region 1 is the region that affects fatigue failure. The relationship between the stress intensity factor and crack growth rate is expressed by Paris’ law,23,24) which is shown in Eq. (1). According to this equation, the slope of the lines in Figs. 12 and 13 corresponds to the material index n, which depends on the experimental conditions, atmosphere, temperature and so on. We therefore compared the material indexes under various conditions. Furthermore, the method of analysis that the crack growth rate could be derived from the bending test of SENB in this study included an assumption. Therefore, in order to confirm the validity of analysis of this study, the linear fitting has been made in region 1 and the value of material constant in each condition was determined. Moreover, the degree of deviation between the material constant derived from K-V diagram and that derived from fatigue failure test was compared.
According to Fig. 12, the effect of carbon content in brick on crack growth rate is such that the crack growth rate in region 1 increases when the carbon content decreases under the same stress intensity ratio (defined as the ratio of stress intensity to the fracture toughness). Also, the ratio of the crack growth rate to the stress intensity ratio, which corresponds to the logarithm of the gradient, decreases as the carbon content decreases. The crack growth rate in region 2 was unrelated to the carbon content, and remained constant.
On the other hand, with regard to the effect of ambient temperature on crack growth rate, Fig. 13 shows that with the same stress intensity ratio, a faster crack growth rate in region 1 is obtained at high temperature. However, the ratio of crack growth rate to stress intensity ratio at high temperature was the same as that at room temperature. The material index n was derived from the slope of these graphs. Table 7 lists the values of the numerical index n obtained from this evaluation of crack growth rates. The material constant of MgO-C brick obtained from the fatigue test results shown in Table 2 was mostly in agreement with the value derived from the crack growth rates in bending tests shown in Table 7. This reconfirms the view that the material constant n obtained from fatigue testing is the inherent property of the material and corresponds to the susceptibility of the material’s crack growth rate. Further, validity is also proved as for above mentioned assumption of deviation of n values to which the notch of SENB is applied.
Table 7. Values of numerical index
n derived from K-V diagram.
| Temperature | Numerical index n obtaind from K-V diagram | Numerical index n obtaind from fatigue failure test |
|---|
| MgO-10%C | (298 K) | 18.4 | 22.1 |
| MgO-15%C | (298 K) | 27.6 | 27.5 |
| MgO-20%C | (298 K) | 43.4 | 42.2 |
| (1473 K) | 39.2 | |
Figures 14 and 15 show X-ray CT scan images of MgO-20%C and MgO-10%C bricks in the middle and final stages, respectively. In MgO-20%C brick, no large cracks are observed until the final stage. On the other hand, there were some observable cracks even in the middle stage in MgO-10%C brick, and the propagation and branching of relatively large cracks were also observed in the final stage.
Based on these results, the fatigue failure mechanism of MgO–C brick is considered to be as follows.
When brick is subjected to cyclical loading, the stress intensity factor KI also increases in relation to the magnitude of loading. At the same time, the crack growth rate also increases according to Paris’ law, so that the crack length a increases. This causes the stress intensity factor to increase again. It is expected that repetition of this process will cause extreme crack propagation, ultimately leading to fracture.
Figure 16 shows a schematic illustration of the effects of carbon content in MgO–C brick on crack growth behaviour. The arrows in this figure serve as an abstract illustration of how the crack growth rate increases at each loading cycle. From this figure, though the increase of crack growth rate is relatively small in bricks with a low carbon content such as MgO-10%C due to the lower value of the material constant n, the crack growth rate itself is large compared with other materials having the same value of K1/K1C. It can thus be said that this material tends to form relatively large cracks at low loads. On the other hand, in bricks with a higher carbon content such as MgO-20%C, although the higher value of n means that the crack growth rate increases at a faster rate under cyclical loading, the crack growth rate itself is very small compared with other materials having the same K1/K1C. Therefore, in this sort of material, the crack growth rate increases for higher values of K1.

We also considered the effect of ambient temperature on crack growth rate. From Fig. 13, the crack growth rate was slightly larger at 1473 K than at room temperature with the same value of K1/K1C. It is inferred that cracks propagate more easily at high temperature due to the occurrence of small cracks and strains due to the thermal expansion of the constituent brick particles. Also, there was no large difference in the values of the numerical constant n obtained from the K-V diagram at room temperature and at high temperature. This agrees with the trend previously observed by the authors in fatigue failure tests at room temperature and high temperature.2) Hence, this numerical constant n, which represents the sensitivity of crack growth rate, can be regarded as a constant that does not vary with temperature.
In general, MgO–C bricks consist of flake graphite and periclase particle (aggregates and matrix). These materials are known to be stable, and do not undergo phase transformation or form a liquid phase even at 1473 K. In a previous study by the authors, it became clear that the numerical constant n increases at high temperature in systems that form a liquid phase at high temperature, such as Al2O3–SiO2 refractories.3) In the MgO–C system studied here, it is inferred that the constant value of numerical constant n is due to the high-temperature stability of the constituent materials.
However, it is inferred that the carbon in MgO–C acts plays a role in resisting crack propagation under stress. On the other hand, the reduction of crack growth rate through the absorption of stress by graphite cannot be ruled out. Further investigation is needed to clarify the fracture mechanism of refractories through the collection of more fracture mechanics data, such as the estimation of R-curves.
5. Summary
We have evaluated the fracture mechanics of MgO–C refractories, such as their fracture toughness and the relationship between crack growth rates and stress intensity factors (i.e., K-V diagrams). We have also investigated the effects of carbon content and ambient temperature on crack propagation. Our results can be summarized as follows:
(1) The fatigue failure tests were carried out and the material constant in each condition was evaluated. The material constant obtained in this study was slightly lower than that in previous study. It is thought that the difference is attributed to the material condition.
(2) The fracture toughness of MgO–C bricks decreases as the carbon content decreases, and the fracture toughness of MgO–C brick is lower at high temperature (1473 K) than at room temperature.
(3) We used the compliance method to evaluate the K-V diagram of MgO–C brick. The crack growth rate increases with decreasing the carbon content in the bricks. The slope of K-V diagram (i.e., material constant n) decreases with decreasing the carbon content in bricks. Furthermore, the material constant n obtained from the K-V diagram is not influenced by ambient temperature.
(4) The material constant obtained by evaluating the relationship between crack growth rate and stress intensity factor was in agreement with the value derived from fatigue failure tests. This result confirms that material constant derived from fatigue failure tests corresponds to the sensitivity to changes in the crack growth rate. Further, validity is also proved as for the assumption of deviation of n values to which the notch of SENB is applied.
(5) In non-invasive inspection by X-ray CT scans, no large cracks were observed until just before fracture in fatigue failure tests of bricks with a higher carbon content. On the other hand, in tests of bricks with a lower carbon content, large cracks were observed even in the middle of the tests.
(6) We investigated how the carbon content of MgO–C bricks affects their crack growth behaviour from the point of crack propagation, and inferred the fatigue failure mechanism.
Nomenclature
P: Load (N)
Pmax: Maximum load (N)
L: Outer span (m)
l: Inner span (m)
B: Width of SENB testing sample (m)
W: Height of SENB testing sample (m)
a: Depth of notch in SENB sample (m)
KIC: Fracture toughness (MPa·m0.5)
KI: Stress intensity factor (MPa·m0.5)
λ: Compliance (m/N)
Δu: Displacement (m)
ΔP: The amount of load change (N)
E: Static elastic modulus (N/m2)
t*: Elapsed time during evaluation of compliance (sec)
r: Stroke speed of crosshead (m/sec)
An (0 ≤ n ≤ 4): Constants and coefficients of regression curve (m/N)
Bn Constants and coefficients of regression curve (sec)
C: Material constant (m/s)
n: Numerical index of material (–)
n′: Numerical index of material derived from S-N curve (–)
a0: Initial crack length (m)
ac: Crack length at the fracture occurred (m)
Y: Geometrical factor (–)
References
- 1) Y. Xaozang, K. Gotoh, T. Miki, Y. Kiyota, T. Takeuchi, H. Takeuchi, Y. Hino, A. Kasai, N. Sakaguchi, Y. Ohsugi, A. Wada, S. Nishizawa, K. Okita, T. Ueda, Y. Sato and K. Matsumoto: CAMP-ISIJ, 23 (2010), 891.
- 2) Y. Hino and Y. Kiyota: ISIJ Int., 51 (2011), 1809.
- 3) Y. Hino and Y. Kiyota: ISIJ Int., 52 (2012), 1045.
- 4) H. Tokunaga, K. Ikeda, K. Kaizu and H. Kinoshita: JSME-Annual Meeting, JSME, Tokyo, (2006), 1, 1009.
- 5) K. Yoshizumi, K. Ikeda, H. Kinoshita, K. Kaizu, A. Yoshikawa and H. Tokunaga: JSME-Kyushu Division Meeting, No.088-1, JSME Kyushu-Branch, Fukuoka, (2008), 139.
- 6) H. N. Ko: J. Soc. Mater. Sci., Jpn., 39 (1990), 1385.
- 7) H. N. Ko: J. Soc. Mater. Sci., Jpn., 42 (1993), No. 481, 1207.
- 8) T. Shimoyama, T. Goto, M. Kikukawa, T. Kanemoto and K. Endo: Hukui University of Technology Kenkyu-Kiyouh, 30 (2000), 157.
- 9) T. Shimoyama, T. Goto, T. Kanemoto, K. Endo and Y. Manabe: Hukui University of Technology Kenkyu-Kiyouh, 31 (2001), 125.
- 10) G. Jin, A. Honjoh and H. Awaji: J. Cerm. Soc. Jpn., 108 (2000), 6, 614.
- 11) T. Yamada, T. Hoshide and H. Furuya: J. Soc. Mater. Sci. Jpn., 33 (1984), 364, 28.
- 12) T. Kawakubo and K. Komeya: J. Soc. Mater. Sci. Jpn., 34 (1985), No. 387, 92.
- 13) M. Kikukawa, T. Shimoyama, K. Satoh and K. Torimoto: J. Soc. Mater. Sci. Jpn., 46 (1997), No. 10, 1189.
- 14) M. Iiyama, T. Numata, M. Imabeppu, T. Sumikame and T. Miwa: Tetsu-to-Hagané, 73 (1987), No. 4, S74.
- 15) ASTM International, ASTM C 1421-10: Standard Test Methods for Determination of Fracture Toughness of Advanced Ceramics at Ambient Temperature, ASTM International, USA, (2009).
- 16) Y. Matsumoto, F. Wakai, M. Okada and H. Okuda: Yogyo-kyokai-shi, 90 (1982), No. 5, 227.
- 17) G. R. Irwin: Handbuch der Physik, vol 6, Springer Verlag, Berlin, (1958), 551.
- 18) T. Fett, G. Martin, D. Munt and G. Thun: J. Mater. Sci., 26 (1991), 3220.
- 19) J. P. Singh, K. Nihara and D. P. H. Hasselman: J. Mater. Sci., 16 (1981), 2789.
- 20) Handbook of JIS R1668, Testing method for fracture toughness of porous fine ceramics, JIS, Tokyo, (2005),917.
- 21) M. Miyamoto, T. Onoue and K. Narita: Tetsu-to-Hagané, 69 (1983), S95.
- 22) W. D. Kingery, H. K. Bowen and D. R. Uhlmann: Introduction to Ceramics, 2nd ed., A Wiley-Interscience Publication (John Wiley & Sons, Inc.), New York, (1960), 787.
- 23) T. Nishida and E. Yasuda: Ceramics-no-Rikigakutekitokusei-hyouka (The Evaluation of Mechanical Property of Ceramics), Nikkankogyo-Shinbunsya, Tokyo, (1987), 205.
- 24) H. Okamura: Senkei-hakairikigakunyuumon (Introduction to Linear Fracture Mechanics), Baifukan, Tokyo, (1976), 133.
- 25) Y. Yamauchi, T. Miyajima, S. Ito and K. Kubo: J. Ceram. Soc. Jpn., 102 (1994), No. 4, 364.
- 26) T. Ogasawara, Y. Mabuchi and N. Hirosaki: J. Ceram. Soc. Jpn., 101 (1993), No. 10, 1153.
- 27) R. O. Ritchie and R. H. Dauskardt: J. Ceram. Soc. Jpn., 99 (1991), No. 10, 1047.