Regular Article
Influence of CaO Source on the Formation Behavior of Calcium Ferrite in Solid State
2013 年 53 巻 9 号 p. 1571-1579
詳細
2013 年 53 巻 9 号 p. 1571-1579
Calcium hydroxide and Calcium carbonate were used as CaO source to investigate the formation behavior of calcium ferrite in solid state below 1200°C. The density change of CaO–Fe2O3 samples with temperature were in-situ and off-line determined, with linear shrinkage rate test for mixed powders at a heating rate of 10°C/min and with Archimedes method for the pellets isothermal roasted at various temperatures and time, respectively. Phase composition of roasted samples was determined with X-ray powder diffraction method, and TG-DSC analysis was used to understand the decomposition behavior and formation of calcium ferrites in different heating rates. As a result, the formation of Ca2Fe2O5 could occur much earlier when calcium hydroxide was used as raw material; however, the formation rates of CaFe2O4 tend to be faster when calcium carbonate was used when the temperature is higher than 1100°C. In addition, the formation of Ca2Fe2O5 was supposed to be prior to CaFe2O4 in this study when the temperature is lower than 900°C.
Iron ore sintering process produces the major component of blast furnace burden in the Asian Countries, and therefore the high-quality sinter is critical for efficient blast furnace operation.1) The properties of sinter, mainly include reducibility, mechanical strength and reduction degradation, are influenced by most of its composition and structure of bonding phases. There were intensive researches aiming at the understanding of high quality sinter, and one phase has been recognized as most important factor to optimize its properties, which is usually known as ‘SFCA’ standing for silico-ferrite of calcium and aluminum.
A considerable amount of previous work were focused on the structure characterization,2) formation mechanism,3,4) stability,5,6) and properties of calcium ferrite bonding phases.7,8) Pownceby et al. investigated the stability and solid solution limits of SFCA,5,6) and also the phase relationship of Fe-rich part of Fe2O3–Al2O3–CaO–SiO2 (FACS) system at 1240–1300°C with the oxygen partial pressures of 5×10⁻³ atm.9) Other researchers carried out the work on the influence of the oxygen partial pressure on final sinter phases.10) Besides, it was also a major concern for the structure and texture of bonding phases among the previous publications. Loo et al. reported that factors influencing the structure of SFCA include the chemical composition, sinter basicity, and the maximum sintering temperature.11) In particular, massive attention has been given to the influence of Al2O3 on the formation of SFCA during sintering process due to the background that the sources of iron ore have changed worldwidely in recent years.12,13,14)
However, few work has been published about the influence of different sources of some components on the formation of calcium ferrites below 1200°C. During the sintering process, additives such as lime, calcite, olivine, and dolomite are typically used to form low temperature melts with ferrites. These additives usually decompose first with increasing temperature and then react with hematite or other ferrites to generate initial melts. Pownceby et al. determined the reaction sequences involved in the formation of SFCA by using in-situ X-ray diffraction (XRD) technique. Their study indicated that the formation of SFCA is dominated by the solid-state reactions, mainly in the CaO–Fe2O3 system.3) However, the influence of dehydration and decarbonation reactions involved in the heating process was not discussed. Kasai et al. used differential thermal analysis (DTA) technique to examine the assimilation behavior of different iron ores with limestone of various size ranges.15) The research shows that the existing state of Al2O3 would influence the endothermic peak which relative to incongruent melting of SFCA. This implies that the different source of aluminum may result in different composition of SFCA. Moreover, Jeon et al. reported that different intermediate calcium ferrite phases of CaFe2O4 and CaFe3O5 are formed prior to the Ca2Fe2O5 formation when Fe2O3 and Fe3O4 are used as a starting iron oxide, respectively.16)
The objective of this study is to investigate the influence of CaO source on the formation of Calcium ferrites by solid-state reaction(<1200°C). Two sources of CaO existing in the form of Ca(OH)2 and CaCO3 are compared in regard to the thermal change and variation of density of samples. Thermal change was determined with Thermo-Gravimetry and Differential Scanning Calorimetry (TG-DSC), while the density of roasted samples was examined for the samples obtained from two heating regime, heating at a constant heating rate from room temperature and isothermal roasting at various heating time, by using thermal dilatometer and Archimedes method, respectively.
The raw materials used in this study are all analytically pure (AP) chemical reagents (Kenong Chemical Co. Inc®), except for the Ca(OH)2 which is obtained by slaking the lime. The chemical reagent of CaO was first slaked with excessive water and then dried for 4 h at 120°C before grinding into powders. The size distribution of experimental raw materials is measured by using screen method and the results are shown in Table 1. For samples preparation, different source of CaO were mixed with Fe2O3 in a mole ratio of 1:1. The XRD patterns of two kinds of mixed powders were determined by using D/MAX 3C (Cu Kα) as shown in Fig. 1.
| Size range | <0.05 mm | 0.05–0.10 mm | >0.10 mm |
|---|---|---|---|
| Fe2O3 | 17.49 | 67.85 | 14.66 |
| Ca(OH)2 | 41.47 | 29.32 | 29.21 |
| CaCO3 | 2.70 | 33.32 | 63.98 |
| CaO | 2.50 | 78.04 | 19.46 |
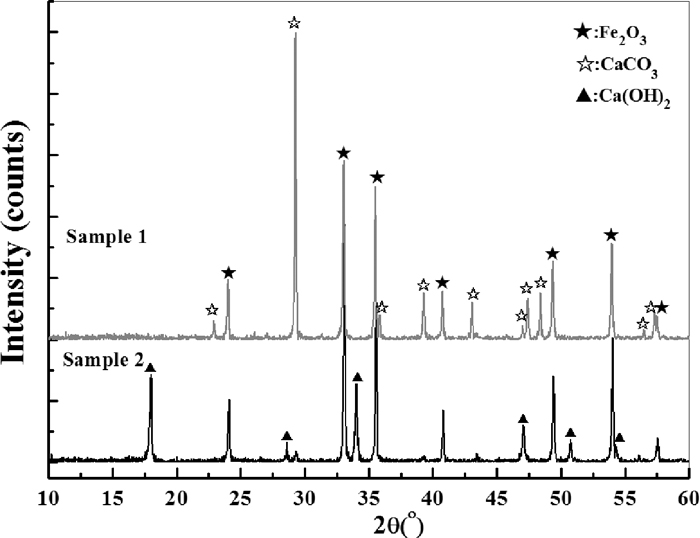
The phase composition of original mixed samples.
Water and paraffin were used to determine the density of samples after isothermal roasting process. Their densities were measured for three times and the average values are 0.995 g·cm–3 and 0.908 g·cm–3, respectively.
2.2. Experimental ProcedureAll the tests and experiments reported in this study were carried out in air. The relative linear shrinkage rate of mixed samples during the formation process of calcium ferrites in solid-state were determined with thermal expansion tests. Mixed powders (CaO+Fe2O3, CaCO3+Fe2O3, Ca(OH)2+ Fe2O3) were pressed into columns with a diameter of 6 mm and a length of 21–25 mm in a stainless module under a pressure of 3 MPa. The columns were then determined with the thermal dilatometer (NETZSCH DIL 402C) at a heating rate of 10°C/min from room temperature to 980°C.
As for the TG-DSC tests, mixed powders were directly used as test samples. All the tests were carried out with NETZSCH STA 449C TG-DSC thermal analyzer with a heating rate of 10, 20, and 30°C/min from room temperature to 1200°C, individually.
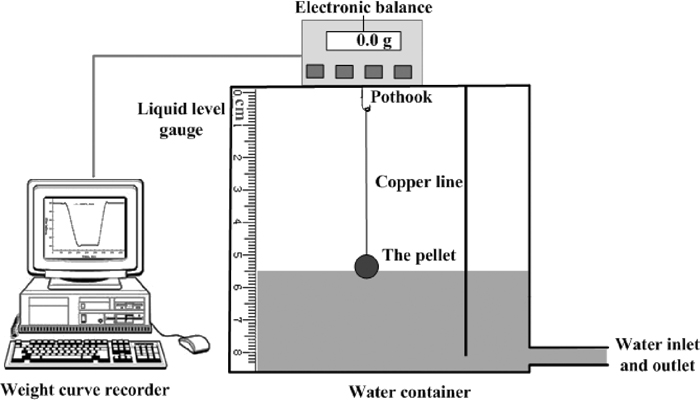
Pellets were used for isothermal roasting process, two kinds of mixed powders (CaCO3+Fe2O3, Ca(OH)2+Fe2O3) were pelletized at pressure of 15 MPa to a pellet shape cylinder with a diameter of 30 mm and a maximum thickness of 15 mm in 20 g weight for each. As water was added during the pelletizing process, the pellets were then baked for 3 h at 120°C before the roasting process. Different roasting temperatures and time were chosen to understand the reaction progress, the experimental scheme is shown as Table 2. A resistance furnace was used for the experiments, the furnace was heated to the desired temperature in advance and then the pellets were put in and placed on some pieces of MgO crucible (99% purity). It took about 30–90 s for the furnace temperature to rise back, and then the timekeeping schedule followed. Both green pellets and roasted samples were measured with a designed apparatus to determine their densities by using the Archimedes method, the experimental apparatus is shown in Fig. 2. In particular, the density of green pellets was measured for three times by using three pellets to get the average value. Paraffin was used to protect the pellet from water during the test, the solid paraffin was first melted to liquid in a beaker and then cooled down in air, the pellet tied with copper line was then immersed into the liquid paraffin quickly when it began of frozen. The pellet wrapped with solid paraffin was then hanged to the electronic balance. The water flowed in slowly until the pellet was completely covered, and ran off later after the data of balance got stable. Thus, a mass curve was measured by the computer connecting to the electronic balance. The volume of the copper line (a diameter of 0.17 mm) immersed in water was neglected in this research.
| Roasting Temperature (°C) | Roasting time (min) | ||||||
|---|---|---|---|---|---|---|---|
| 900 | 5 | 10 | 20 | 30 | 45 | 60 | 90 |
| 1000 | 5 | 10 | 20 | 30 | 45 | 60 | 90 |
| 1100 | 5 | 10 | 20 | 30 | 45 | 60 | 90 |
| 1150 | 5 | 10 | 20 | 30 | 45 | 60 | 90 |
| 1200 | 5 | 10 | 20 | 30 | 45 | 60 | 90 |
Experimental scheme of density measurement with Archimedes method.
The apparent density of pellet was then calculated with the following formula.
| (1) |
Where, ρpellet, ρwater, ρpara f fin, m0, m1, m2,
The outer wrapped paraffin was removed from the pellet to confirm that no water penetrated in during the measurement by checking whether there was a weight change after putting it in air for 6 h. The pellet was then milled into powders (more than 90 wt% below 0.74 μm, with screen method) and its XRD patterns were determined using D/MAX 3C (Cu Kα), with scan speed of 2°/min.
Figure 3 compares the shrinkage of the samples with a heating rate of 10°C/min up to 980°C in terms of three kinds of CaO sources. As illustrated in Fig. 3, an obvious peak around 300°C is observed for sample with Ca(OH)2, which could be explained by the dehydration process. This process is also visible for the sample with CaO which peaked at about 420°C as it may absorbed moisture from the air. A slight expansion was seen until around 735°C and the sample began to shrink, which implying that the apparent reaction of CaO and Fe2O3 occurred. Linear expansion was observed for the sample with CaCO3, it could be supposed that the decarbonation process was incomplete and still in dominate over the formation of calcium ferrites in the temperature range investigated. From a theoretical thermodynamics’ view, the possible reactions during the test are shown as follows:
| (2) |
| (3) |
| (4) |
| (5) |
| (6) |
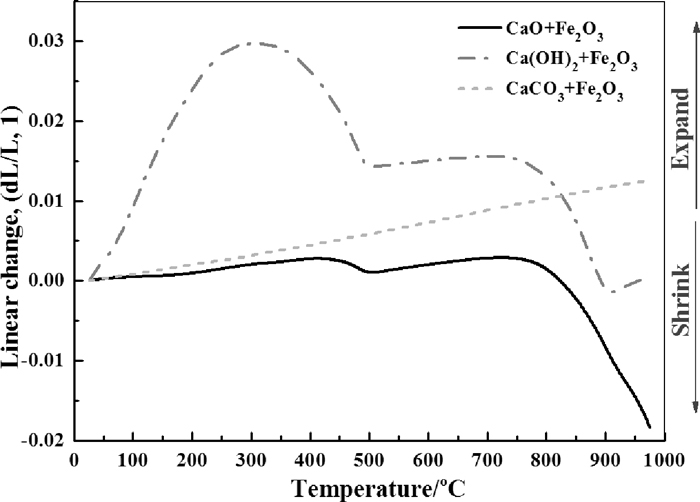
The relationship between linear shrinkage rate and temperature.
In order to discuss the thermodynamic preferences of these reactions, Fig. 4 was carried out as reference, which is calculated with Factsage 6.1 by supposing all the reactants and reaction products were in standard state.17) It can be seen that according to thermodynamics, the decomposition of CaCO3 and Ca(OH)2 could happen above 861°C and 525°C, respectively. Once the CaO was liberated, it would combine with the surrounding Fe2O3. However, as the decomposition process was influenced by the partial pressure of gaseous resultant as well as actual dynamic conditions, the calculation would deviate from the experimental results.
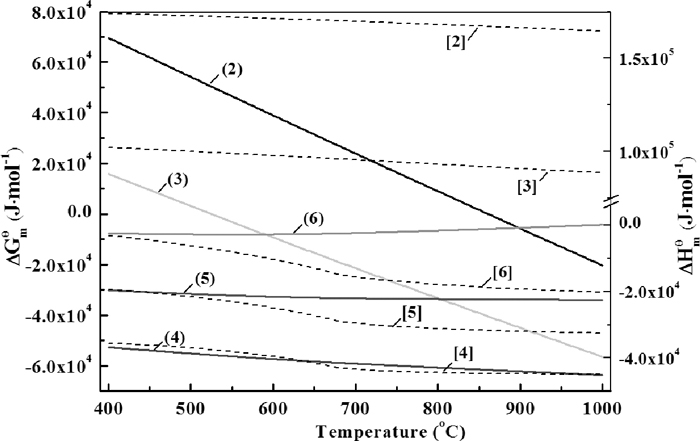
The thermodynamic preference and enthalpy change of reaction(2)–(6), with solid lines for free energy change and dash lines for enthalpy change, respectively.
Suppose the samples were homogeneously mixed and the decomposition reactions as well as the formation of calcium ferrites were isotropous, then the relationship between relative density and the linear shrinkage rate could be described with following formula:18)
| (7) |
Where, the ρ0 denotes original density of sample (g/cm3), ρ represents the density of sample at any period of time during the test (g/cm3), L0 stands for the original length of sample (mm), and dL refers to the length change of sample during the test. Thus, the ρ/ρ0 and dL/L0 are defined as the relative density and linear shrinkage rate, respectively.
Figure 5 shows the relationship between relative density and temperature, it can be seen that the density of sample with Ca(OH)2 varied dramatically with the temperature range investigated. The largest density drop observed is about 9.9%, such a change may influence the permeability of local environment, which in turn may influence the oxygen partial pressure locally. As the dehydration of Ca(OH)2 happens far more earlier than the decomposition of lime carbonate, the re-increase of density also be found to begin in a lower temperature for the sample with Ca(OH)2. Furthermore, it was observed that the relative density of sample with Ca(OH)2 surpassed that with CaCO3 at approximately 830°C under the experimental conditions in this study. The turning points of obvious increase of relative density, which implying the sintering behavior, are very close for the samples with CaO and Ca(OH)2 at 746°C and 732°C, respectively.
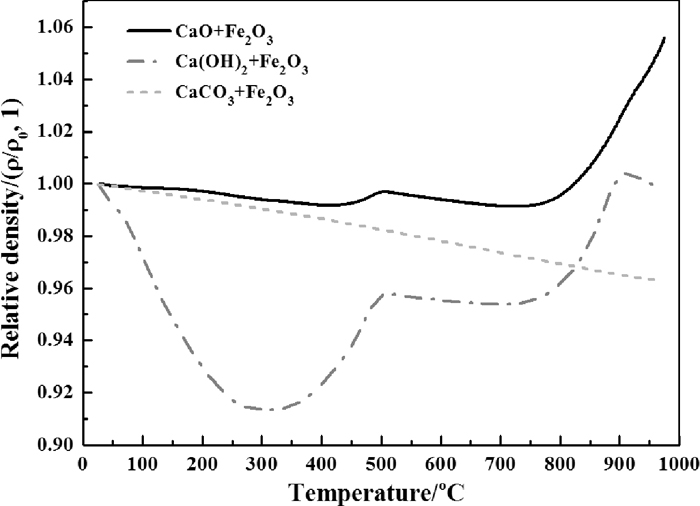
The relationship of relative density and temperature.
TG-DSC curves of the mixed powders with Ca(OH)2 and CaCO3 at different heating rates are shown in Figs. 6 and 7, respectively. The first endothermic peaks, which corresponding to decomposition process, shift to higher temperatures with the increasing heating rate. Thereafter, continuous endothermic behavior (since T>465°C in case of Ca(OH)2 was added and at a heating rate of 10°C/min) is observed indicating that calcium ferrites were formed right after the decomposition process. As shown in Table 3, as the heat capacity of either CF(CaFe2O4) or C2F(Ca2Fe2O5) is much larger than that of calcium oxide and ferric oxide,19) the continuous formation of CF and C2F would increase the whole capacity of the mixed samples. It was found that the TG curves of the samples with Ca(OH)2 have a step shape between the temperature range of about 450–750°C. This could be explained by the impurity of CaCO3 in the samples.

TG-DSC curves of the mixed powders with Ca(OH)2 at different heating rates. Note: the mark “o” on the TG curves was used to represent the finish point of decomposition process.
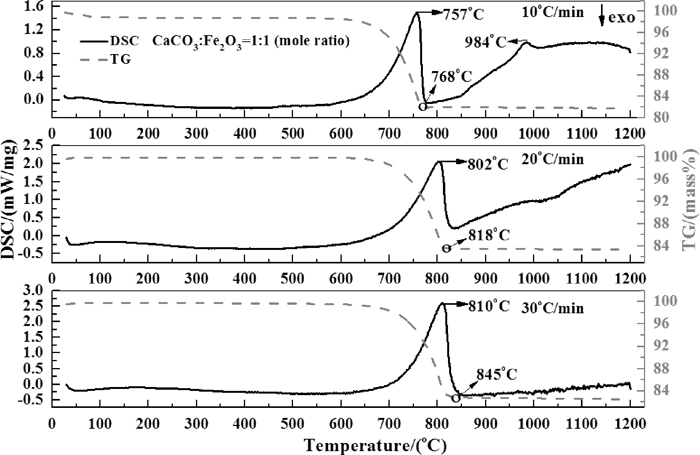
TG-DSC curves of the mixed powders with CaCO3 at different heating rates. Note: the mark “o” on the TG curves was used to represent the finish point of decomposition process.
| Phase | Fe2O3 | CaFe2O4 (CF) | Ca2Fe2O5 (C2F) | CaO |
|---|---|---|---|---|
| Cp range/cal·(g·K)–1 | 31.37–34.17 | 40.90–60.43 | 51.44–72.52 | 11.73–13.28 |
However, when heating rates increased to 30°C/min, the obvious endothermic behavior after the decomposition process nearly disappear. One reason is the formation of CF and C2F were limited to some extent in such a relatively short heating time. Another reason is the influence of heating rate on the decomposition process. According to the mass change curves, it is clear that the time for whole decomposition process was delayed by the increasing heating rate (see the mark of “o” on the TG curves in Figs. 6 and 7).
Figure 8 compares the TG-DSC curves of samples with different CaO source at a heating rate of 10°C/min. It is noticeable that a small peak at around 985°C on DSC curves were found for both of the two samples. This implies that new phase was formed during this period. Scarlett et al. had reported that the C2F and CF were observed to form at approximately 750°C and 1000°C, respectively (C refers to CaO and F refers to Fe2O3).3) It should be noted that they used a different heating scheme in their study (10°C per minute to 600°C, then at 5°C per minute to approximately 1260°C under a flowing atmosphere of high-purity air). Their recent work indicated that the occurrence of CF was firstly found at about 968–979°C (varied with the addition of Al2O3) by using a heating rate of 20°C/min from 25°C to 600°C and 10°C/min from 600°C to 1350°C under a continuous gas flow of N2 and O2 (pO2=5×10⁻³ atm).1) Therefore, the authors suppose that the peaks around 985°C may correspond to the formation of CF from C2F and Fe2O3. It can be seen from Fig. 4 that the formation of Ca2Fe2O5 directly from Fe2O3 and CaO (see reaction(4)) is thermodynamically prior to the CaFe2O4 (see reaction(5)). As both the formation of CF and C2F are exothermic reactions, the released heat from these reactions would compensate the increase of heat capacity of the samples with the increasing temperature.
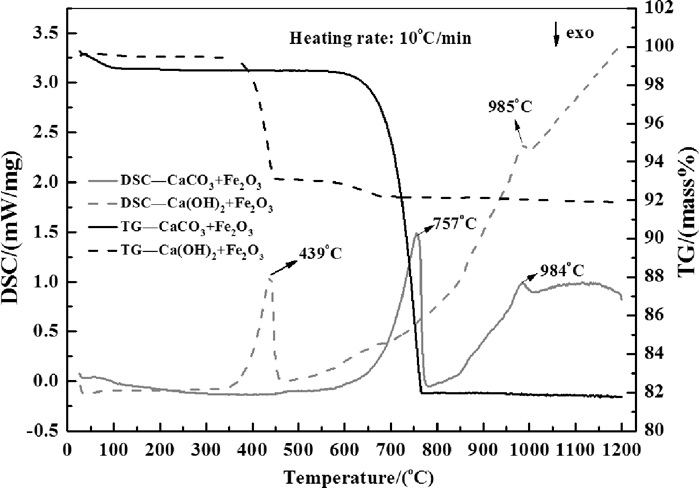
Comparison for the TG-DSC curves of mixed powders with Ca(OH)2 or CaCO3.
In order to explain the different behaviors observed with two CaO sources in linear shrinkage test and TG-DSC analysis, same starting materials were used in isothermal roasting experiments. Apparent density change of samples with starting materials of Fe2O3 and Ca(OH)2 were illustrated in Fig. 9, in which ρ and ρ0 denotes the apparent density of roasted pellets and green pellets, respectively. It can be seen that at lower temperatures (≤1000°C), the relative density would firstly drop and then increase, which were resulted from dehydration and calcium ferrite formation processes, respectively. With the increase of roasting temperature, the influence of dehydration process on the relative density becomes weaker. On the other hand, influence of calcium ferrite formation was in dominate since the start of timekeeping when the roasting temperature increased to 1100°C. When the roasting temperature is above 1150°C, a sharp increase of relative density was observed for the samples after more than 20 minutes roasting. However, the relative density dropped if continue to extend the roasting time more than 45 minutes. Figure 10 shows the XRD of sample roasted at 900°C for 90 minutes and the phase recognition. It illustrates that the final phases were composed of CF, C2F and Fe2O3. The phases observed in this study were referred to Database of the International Centre for Diffraction Data (ICDD). Figure 11 compares the final phase composition of samples after 90 minutes roasting at different roasting temperature. It could be seen that with increasing roasting temperature, the increase of intensity for peaks of CF coincided with the decrease of intensity of peaks for C2F and Fe2O3. Combining the results of Figs. 9 and 11, the dramatic increase of relative density over 1150°C may due to the faster formation rate of CF from Fe2O3 and C2F that favored high temperature. Another factor may also contribute to increase of density is the sintering behavior. Previous study had shown that the shrinkage temperature of CF and C2F in air is at 1180°C and 1270°C, respectively.20) Thus, it is possible that shrinkage of CF may also play a role in the increase of density.
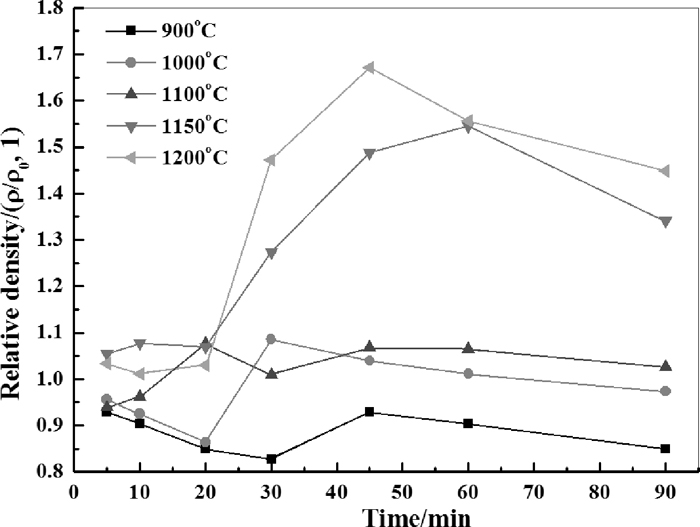
The influence of roasting temperature and time on the relative density.
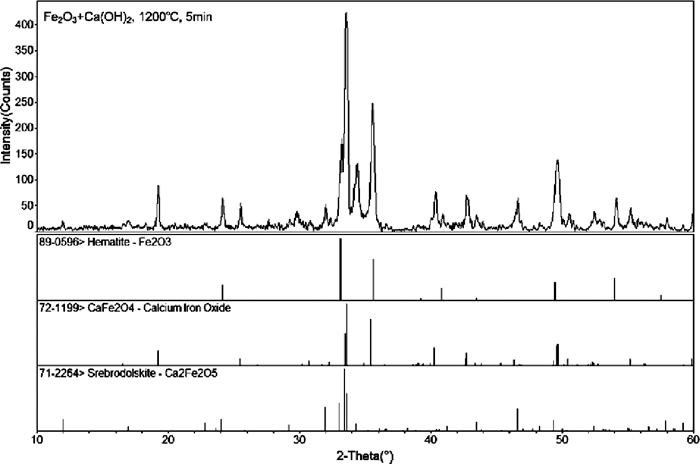
The XRD patterns recognition.
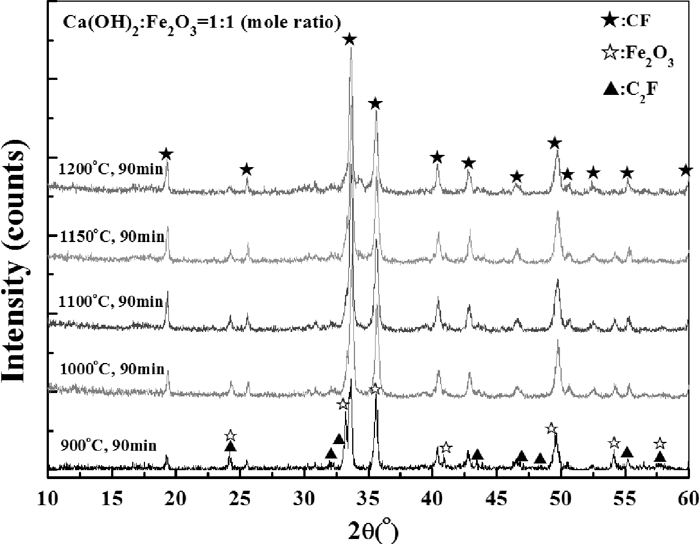
The XRD patterns of samples at different roasting temperatures.
The XRD patterns of samples roasted at 1200°C for different time are shown in Fig. 12. It is clear that the formation of CF from C2F and Fe2O3 mainly happened in the initial 20–30 minutes (see the peak of Fe2O3 at 2θ≈34°). This is in agreement with relative density change shown in Fig. 9 in which the noticeable turning points for the increase of relative density are also between 20–30 minutes. No obvious evidence were found that the change of phase composition is responsible for the decrease of relative density when roasting time exceeded 45 minutes, especially at temperatures higher than 1100°C. One possible reason is that during the density measurement process, some pellets were not measured as a whole pellet but one piece of it in a case of it cracked into pieces easily after the roasting process, just as shown in Fig. 13.

The XRD patterns of samples at different roasting time when Ca(OH)2 was added as the source of CaO.
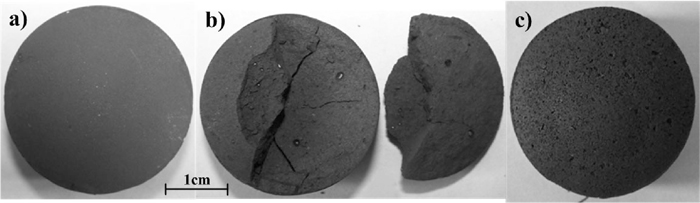
Appearance of pellets before and after roasting process,CaCO3:Fe2O3=1:1 (mole ratio): a) green pellet, b) 1150°C, 30 min, c) 1200°C, 60 min.
Figure 14 shows the change of relative density with the variation of roasting time and temperature. It can be seen that the influence of decomposition on the density change of samples were in dominate at 900°C. When roasting temperature increased to 1000°C, the decomposition process was accelerated and the density began to rebound later than 30 minutes. At higher temperature (≥1100°C), obvious increase of relative density was seen after 20 minutes’ roasting, then the density get stable 10 more minutes later. The XRD patterns of final samples after 90 minutes roasting at various temperatures are shown in Fig. 15. It could be seen that the peaks of C2F and Fe2O3 became nearly unobservable when the roasting temperature were beyond 1100°C (see the peak of Fe2O3 at 2θ≈24°). Figure 16 shows the XRD patterns of samples roasted at 1200°C for different time. The peaks of C2F and Fe2O3 were very weak, which implies that both the decomposition and calcium ferrites formation reactions were almost completed during the initial 5 minutes although it should be noticed that the timekeeping began after the furnace temperature rise back.
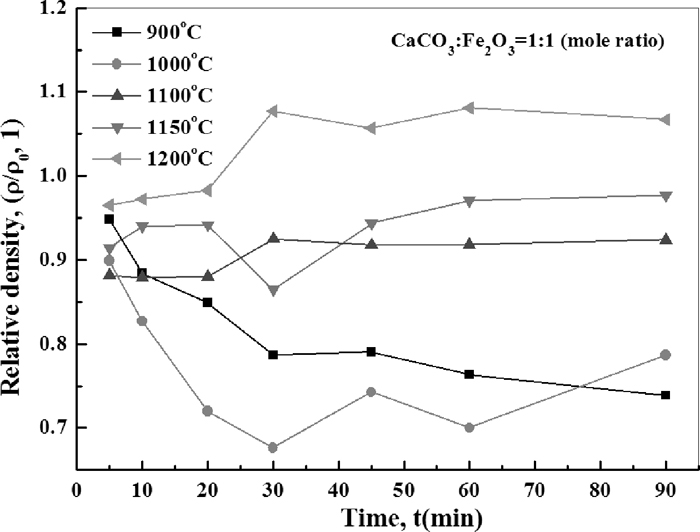
The influence of roasting temperature and time on the relative density.
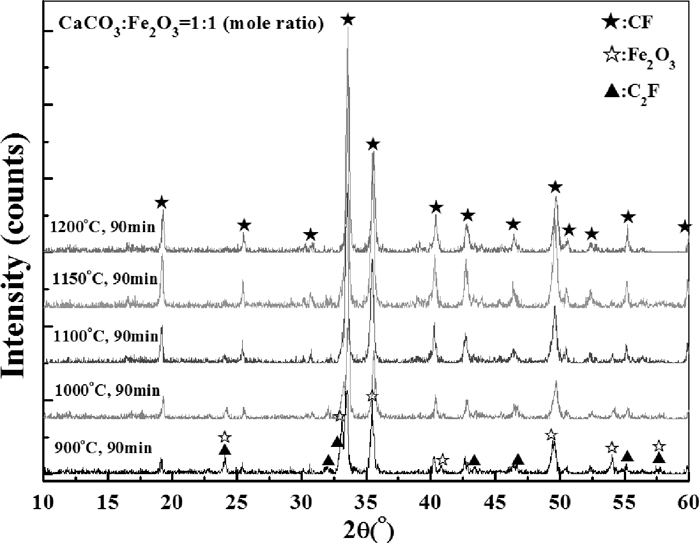
The XRD patterns of samples at different roasting temperatures.
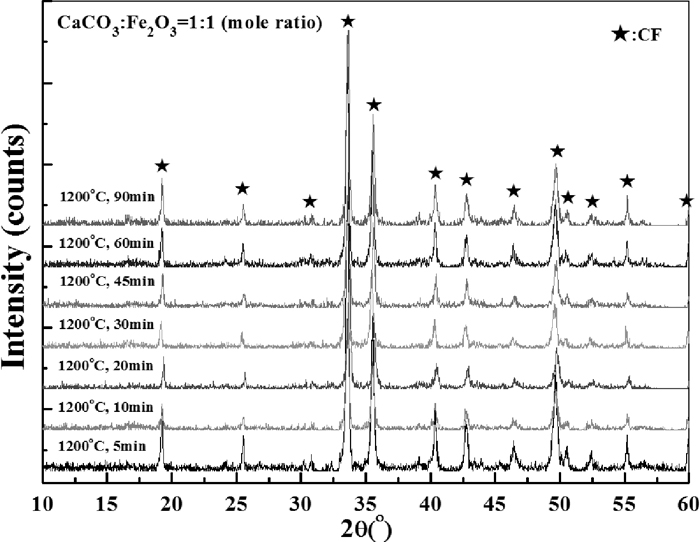
The XRD patterns of samples at different roasting time when CaCO3 was added as the source of CaO.
An interesting thing to discuss about is whether the formation of C2F is prior to that of CF. It was obvious in this study that the increase in intensity of CF coincided with the decrease in intensity for both of Fe2O3 and C2F with the increasing temperature or time. According to the work of Phillips and Muan,21) the stability of CF or C2F is relate to the molar ratio of Fe2O3/CaO and temperature. However, Scarlett and Pownceby et al. found that the formation of C2F is prior to that of CF which is out of the prediction of Fe2O3–CaO binary diagram as they used a Fe2O3:CaO ratios of greater than 5:1 in their research.3) They attributed the fact that C2F forms first between 750°C and 780°C to that the dominant reaction mechanism favored at low temperatures is the solid state reaction between individual CaO and hematite particles. Their recent research confirmed the first formation of C2F and it is independent of addition of Al2O3.1) On the other hand, Jeon et al. reported that the CF firstly formed instead of C2F. They pointed out the inconsistent result with that Pownceby et al.3) may due to the influence of existence of gangue materials (Al and Si) or oxygen potentials on the formation and/or stability of calcium ferrite phases.16) As the influence of gangue materials has been proved to have little effect on the formation priority of CF and C2F by Pownceby et al.’s recent work.1) It seems that the reductive atmosphere (CO+CO2) that Jeon et al. used in their study may have influence on the formation of calcium ferrites.
3.5. Comparison for the Two Different CaO SourcesIn order to compare the difference of CF formation behavior for the two different CaO sources, quantitative analysis is necessary. In this study, the “Insulation Method” based on the RIR (Reference Intensity Ratio) value from the International Centre for Diffraction Data (ICDD) was used for the calculation. Suppose there were N phases in one system, the weight percentage of phase X could be calculated with the following formulas:22)
| (8) |
| (9) |
In which,
| (10) |
The ignorance of C2F would influence the accuracy of the outcome of quantitative analysis; however, it is still meaningful to be seen as a reference of formation rate of CF. Figure 17 compares the two different CaO sources in terms of conversion rate of CF varied with isothermal roasting temperature. It could be seen that when the roasting temperature was above 1100°C, conversion rate of CF is much bigger when CaCO3 was used as the starting material, which implying a faster formation rate of CF. The same conclusion could be drawn from Fig. 18 which indicates that the formation of CF at 1200°C was faster when CaCO3 was used as CaO source in comparison with that Ca(OH)2 was used.
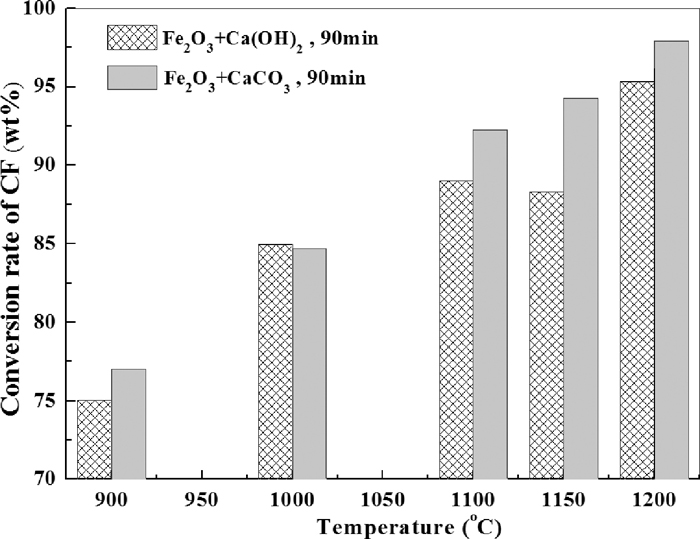
Comparison of CaCO3 and Ca(OH)2 as CaO source on the conversion rate of CF varied with temperature.
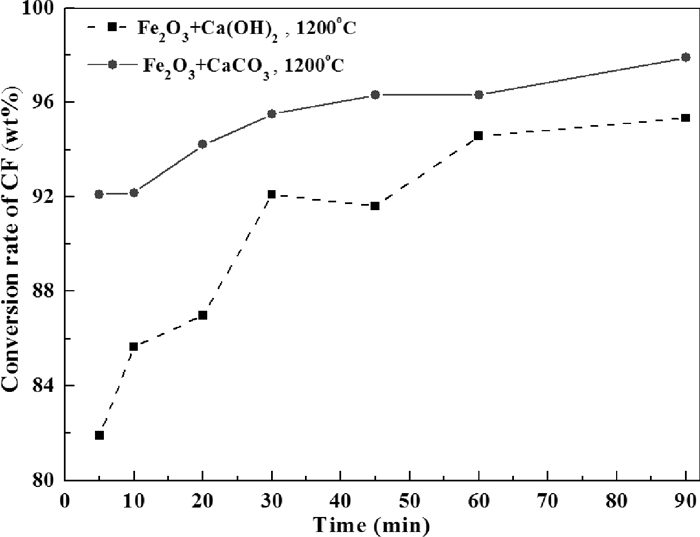
Comparison of CaCO3 and Ca(OH)2 as CaO source on the conversion rate of CF varied with time.
Generally, the relative density of samples with a starting material of Ca(OH)2 is higher than that of CaCO3 under same roasting conditions. This result agree well with the linear shrinkage rate test which also shows the density change of samples with a CaO source of Ca(OH)2 is higher above 830°C. The formation of CF from C2F and Fe2O3 tend to be more fast when the CaCO3 was used as the starting material. One consideration for the reason is the influence from size distribution of raw materials, it has been reported that the activation energy of thermal decomposition of CaCO3 smoothly increases as the particle size increases.23) This conclusion could also be extended to dehydration process of calcium hydroxide. However, the mean particle size of starting Ca(OH)2 is smaller than that of CaCO3 used in this research (see Table 1), thus the particle size should not be seen as the main reason. Another important factor is the reactivity of calcium oxide produced from the two CaO sources. Previous research by D. R. Glasson indicated that the specific surface area increases several-fold during the formation of calcium oxide from CaCO3 or Ca(OH)2.24) The increase is ascribed to the newly-formed calcium oxide being activated when it recrystallizes from a pseudo-lattice either CaCO3 or Ca(OH)2 to very a more stable lattice structure. What’s more, the specific surface area of CaO produced from Ca(OH)2 at 400°C was observed to be larger than that from CaCO3 at 750°C, which implies a better reactivity. Nevertheless, it was also pointed out that the recrystallization process of newly formed CaO happened at a limited rate which lag behind the decomposition. As for this study, the newly formed calcium oxide would react with the surrounding Fe2O3 and therefore recrystallizaiton would be restrained. It is also believed that the calcium hydroxide decomposes more rapidly than the calcium carbonate.24) As discussed in section 3.2, the mass curve of mixed sample with Ca(OH)2 and Fe2O3 drops dramatically in about half an hour while it last for approximately 60 minutes when the CaCO3 was used (see Fig. 7). Previous studies have showed that the decomposition of calcium hydroxide and calcium carbonate is different in term of kinetic control factor. During most of the CaCO3–CaO transformation there is no significant resistance against CO2 diffusion and thus chemical reaction controls the kinetics.25) In contrast, it is thought that the diffusive loss of water from within the Ca(OH)2 crystal is an important reaction control.26) Also, it has been reported that 5% addition of Fe2O3 at 800°C has little effect during the decomposition of the calcium carbonate, but subsequently enhances lime sintering because of its low Tammann temperature which allow rapidly permitting diffusion into the lime cracks and fissures.27) Nevertheless, no direct evidence were found in this study to reveal the mechanism that Fe2O3 involvement influence the decomposition process and the following sinter behavior.
In conclusion, the different calcium formation behavior using CaCO3 or Ca(OH)2 as the CaO source is most possible due to the solid reaction mechanism between CaO and Fe2O3 is kinetic control and thus is temperature dependent. As shown in Fig. 4, the formation of C2F and CF are both possible in thermodynamics at the experimental temperature range. Therefore, when Ca(OH)2 decomposes at relatively lower temperature (<900°C), it is the formation of C2F favored by the solid reaction. At higher temperature (>900°C), the formation of C2F would no longer dominate that of CF and the C2F would react with the residual Fe2O3. Nevertheless, the explanation for the faster formation of CF with a starting CaO source of calcium carbonate than calcium hydroxide require further investigation.
Two kinds of CaO source were compared for the formation of calcium ferrites in solid state. The relative density of samples were determined in two ways: in-situ measured with linear shrinkage rate test at fixed heating rate and off-line test with Archimedes method for the samples isothermal roasted at various temperatures and time. Phase composition of roasted samples after density measurement was determined with X-ray powder diffraction method. In addition, TG-DSC analysis was also used in this research to understand the decomposition behavior and formation of calcium ferrites in different heating rates during the temperature range investigated in this study (≤1200°C).
The following conclusions could be drawn from this work:
(1) Both Ca2Fe2O5 and CaFe2O4 formed when Fe2O3 and either CaCO3 or Ca(OH)2 are used as the starting materials. In addition, the formation of Ca2Fe2O5 tend to be prior to CaFe2O4 at lower temperatures (<900°C).
(2) The result of linear shrinkage test shows that apparent density change of samples with a starting material of Ca(OH)2 is more dramatic than that of CaCO3 during the decomposition process. This is also obvious during the calcium ferrite formation process (after 20 min roasting) for the roasting test when the experimental temperature is higher than 1150°C.
(3) Calcium ferrite formation is related to the starting CaO source, it was found that the formation rates of CaFe2O4 was higher when CaCO3 was used. As an explanation, it is supposed that the formation of Ca2Fe2O5 is favored by the Fe2O3–CaO solid reaction at relatively lower temperature at which Ca(OH)2 decomposes, while the formation of CaFe2O4 directly from Fe2O3 and CaO, which is accompanied with Fe2O3–Ca2Fe2O5 reaction, gradually becomes in dominate with increasing temperature above which CaCO3 decomposes (>900°C).
The authors are especially grateful to National Natural Science Foundation of China (Grant No. 51104192).