Abstract
Temperature distribution in layer of the iron ore sintering process is one of the most important factors to decide the sinter quality. To estimate the temperature distribution in sinter layer needs knowledge of coke combustion rate. The purpose of this study is to clarify that coke combustion rate in the fine layer of the quasi-particle with considerations about void ratio and liquid formation. The following results were obtained. Interface chemical reaction rate constant, kc, was independent on the mixing ratio of coke. The higher mixing ratio of coke made the larger effective diffusion coefficient of oxygen, because the higher mixing ratio of coke made the higher void ratio in the sample after coke combustion. The coke combustion rate became small with increasing of liquid formation amount, because liquid phase in quasi-particle prevented oxygen diffusion in there.
1. Introduction
Iron sinter ore occupy almost 80% of iron burden for blast furnace in ironmaking process. In other words, quality of the iron ore sinter has a direct and great effect on operation result of blast furnace. Temperature distribution in layer of the iron ore sintering process is one of the most important factors to decide the sinter quality. Information of this temperature distribution is necessary to improve the quality of iron ore sinter.
To estimate the temperature distribution in sinter layer needs knowledge of coke combustion rate. 3 patterns of coke existence state in the layer were reported by Hida et al.1) as shown in Fig. 1. The combustion rate should depend on the coke existence state. However many reports1,2,3) used only the state of S’ type for estimation about the temperature distribution in the sinter process. S’ type coke combustion rate is normally too faster than the real sinter process because it ignored oxygen diffusion in fine layer of quasi-particle. The purpose of this study is to clarify that coke combustion rate in the fine layer of the quasi-particle with considerations about void ratio and liquid formation.
2. Derivation of Coke Combustion Rate Equation with Considerations about Void Ratio in the Fine Layer
2.1. Experimental Sample and Procedure
The quasi-particle in iron ore sintering process mainly consists of Hematite powder and pulverized coke. In iron ore sintering process, reduction, oxidation and melting reaction of Hematite simultaneously take place during coke combustion reaction. They have complex effects on coke combustion behavior. To avoid these effects in this study, Al2O3 powder was used as alternative material of Hematite. Tablet samples were prepared as quasi-particle by mixture of Al2O3 powder and pulverized coke.
Pulverized coke, particle diameter is –125 μm, and Al2O3 powder, particle diameter is –250 μm, were well mixed as given mass ratios shown in Table 1. In order to give enough strength of the composite for handling, 5 mass% of wheat flour was added to the mixture of Al2O3 and coke. It was thought this wheat flour could not affect the result of this experiment because it decomposed at 600 K. After the powder samples were well mixed, the mixture was pressed into tablet shape of 10 mm in the diameter by stainless dies with a little amount of water. The height of tablet was 10 mm and void ratio was 35% by adjusting of sample amount and load of compression.
Table 1. Mixing ratio of experimental samples for 2.1. (mass%).
| Coke | Alumina | [Coke mixing ratio based on Hematite weight] |
|---|
| Type 1 | 12.2 | 87.8 | [10] |
| Type 2 | 18.1 | 81.9 | [15] |
| Type 3 | 24.9 | 75.1 | [20] |
| Type 4 | 30.6 | 69.4 | [25] |
| Type 5 | 36.2 | 63.8 | [30] |
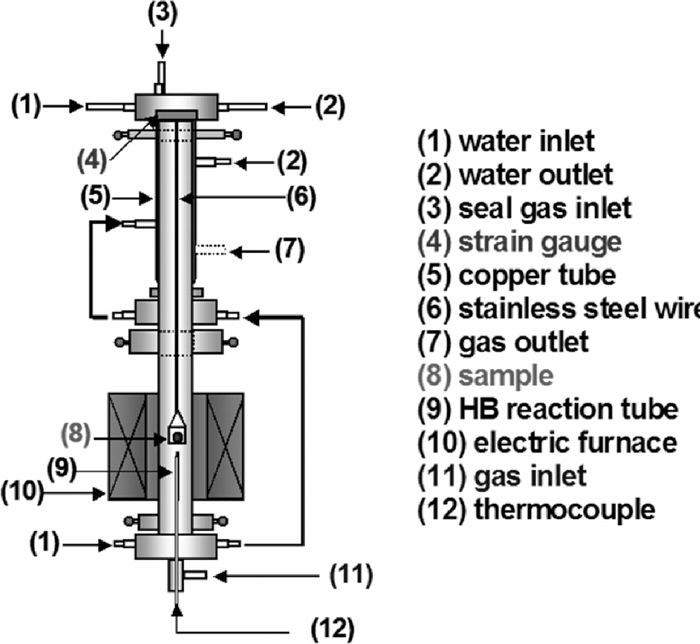
Measurement of sample weight loss during coke combustion was carried out by thermobalance in this study as shown in Fig. 2. The sample was put into platinum basket with ceramic fiber. The ceramic fiber prevented to direct contact of the tablet with the basket. A vertical electric resistance furnace was used in order to make isothermal heating condition. The isothermal zone was heated up to 1073 K, 1223 K, 1373 K and 1523 K. Before combustion experiment, heat treatment was carried out at each given temperature under N2 atmosphere in order to remove binder, water, and volatile matter from sample. After that, an inside of a reaction tube was changed to air atmosphere by air flow of 4 Nl/min during this experiment. It was time to end of experiment when the sample weight became unchanging.
2.2. Results and Discussions
2.2.1. Measurement of Combustion Rate of Samples
Definition of reaction ratio in this study is removal ratio of fixed carbon from the sample. Carbon combustion reaction can be described as following chemical reaction, if CO gas formation would be ignored.
|
C(s)+
O
2
(g)=C
O
2
(g)
| (1) |
Sample weight change was considered as decrease amount of fixed carbon in this combustion experiment. The reaction ratio, F, at elapsed time, t, could describe as Eq. (2).
Reaction curves of Type 3 sample at each temperature are shown in Fig. 3. From this figure, it was found that the higher temperature of reaction condition made the combustion reaction rate the larger. The other type of samples also showed same tendency.
Figure 4 shows reaction curves of each type samples at 1373 K. This figure indicated sample with the smaller coke amount made the combustion reaction rate the larger. The other reaction temperatures also showed same tendency.
These results were used for kinetic analysis of coke combustion rate.
2.2.2. Kinetic Analysis of Coke Combustion Rate
In this study, the unreacted-core model was applied to derive reaction rate constant. It was thought combustion reaction in the sample progressed through the following 5 steps.
1. O2 transport from bulk gas to the particle surface through the gas film
|
-
n
˙
g⋅
O
2
=4π
r
0
2
k
f
(
C
O
2
-
C
O
2
⋅S
)
| (3) |
2. O2 diffusion from the particle surface to reaction interface through Al2O3 layer after coke combustion
|
-
n
˙
p⋅
O
2
=
(
D
O
2
)
eff
4π
r
0
r
i
r
0
-
r
i
(
C
O
2
⋅S
-
C
O
2
⋅i
)
| (4) |
3. Combustion reaction at reaction interface
|
-
R
˙
=4π
r
i
2
k
c
(
C
O
2
⋅i
-
C
C
O
2
⋅i
K
)
| (5) |
4. CO2 diffusion from the reaction interface to the particle surface through Al2O3 layer after coke combustion
|
n
˙
p⋅C
O
2
=
(
D
C
O
2
)
eff
4π
r
0
r
i
r
0
-
r
i
(
C
C
O
2
⋅i
-
C
C
O
2
⋅S
)
| (6) |
5. CO2 transport from the particle surface to the bulk gas through the gas film
|
n
˙
g⋅C
O
2
=4π
r
0
2
k
f
(
C
C
O
2
⋅S
-
C
C
O
2
)
| (7) |
Overall rate equation could be described by quasi-steady state analysis method as follow.
|
-
n
˙
=
4π
r
0
2
(
K
1+K
)
(
C
O
2
-
C
C
O
2
)
1
k
f
+
1
D
e
⋅
r
0
(
r
0
-
r
i
)
r
i
+
1
k
c
⋅
K
1+K
(
r
0
r
i
)
2
| (8) |
|
1
D
e
=
K
1+K
(
1
(
D
O
2
)
eff
+
1
K
(
D
C
O
2
)
eff
)
| (9) |
It could be assumed that equilibrium constant, K, of coke combustion reaction would be infinity because the combustion reaction is irreversible reaction. This assumption could rewrite Eq. (8) as the following equation.
|
-
R
˙
=
4π
r
0
2
C
O
2
1
k
f
+
1
D
e
⋅
r
0
(
r
0
-
r
i
)
r
i
+
1
k
c
⋅
(
r
0
r
i
)
2
| (10) |
could be describe as
Eq. (11), too.
|
-
R
˙
=-
d
dt
(
4
3
π
r
i
3
ρ
Cm
)
=-4π
r
i
2
ρ
Cm
⋅
d
r
i
dt
| (11) |
The reaction ratio,
F, is expressed as
Eq. (12).
Combination among above Eqs. of (10), (11), and (12), derived to Eq. (13) when boundary conditions are r = r0 at t = 0 and r = ri at t = t.
|
(
C
O
2
ρ
Cm
r
0
t-
F
3
k
f
)
1
[1-
(
1-F
)
1
/
3
]
=
r
0
6
D
e
⋅
[1-3
(
1-F
)
2
/
3
+2(
1-F
)
]
[1-
(
1-F
)
1
/
3
]
+
1
k
c
| (13) |
Gas film mass transfer coefficient, kf, can be calculated from Ranz-Marshall’s equation.
Effective diffusion coefficient, Eeff, and interface chemical reaction rate constant, kc, were derived from mixed-control plot of Eq. (13) with experimental results.
2.2.3. Interface Chemical Reaction Rate Constant
Figure 5 shows relationship between mixing ratio of coke in the sample and interface chemical reaction rate constant, kc, at each experimental temperature. kc values are independent on the mixing ratio of coke, and the higher experimental temperature make the larger values of kc. The temperature dependence equation of kc was derived from average value of every type’s kc each temperature using Arrhenius plot. Figure 6 shows Arrhenius plot of kc in this study, and the temperature dependence equation was expressed by Eq. (14).
|
k
c
=5.36×
10
-2
exp(-10.58×
10
3
/RT)
| (14) |
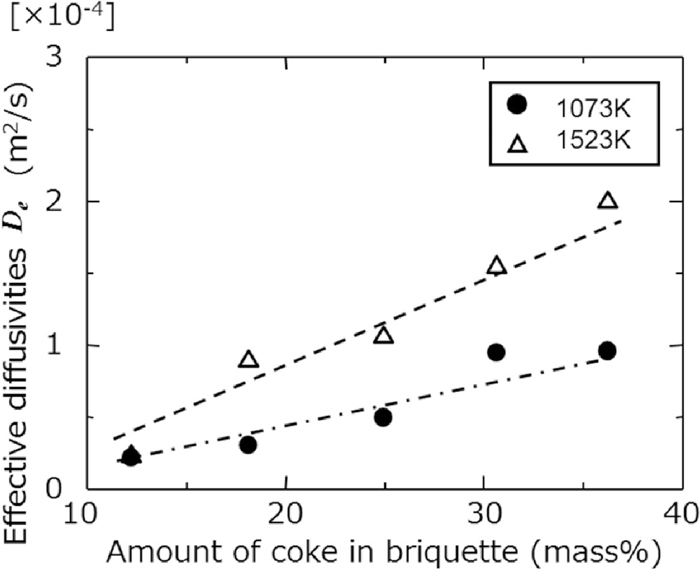
Relationships between mixing ratio of coke in the sample and effective diffusion coefficient, De, at each experimental temperature are shown in Fig. 7. At every temperature, it was shown that the higher mixing ratio of coke make the larger De. It was thought that the higher mixing ratio of coke made the higher void ratio in the sample after coke combustion. Therefore, O2 diffusivity in that sample could be improved. Effective diffusion coefficient in the sample with consideration about void ratio and temperature dependence could be expressed as Eq. (15).
DO2 was referred from literature
5) as follows.
|
D
O
2
=1.78×
10
-5
(
T
273.15
)
1.75
| (16) |
can convert to
Eq. (17) using double logarithm.
|
ln
D
e
=ln(
D
O
2
ε
τ
)
+nlnT
| (17) |
Value of n can be derived from slope of relationship ln De and lnT as shown in Fig. 8. The n value of this study was 2.09. In general, the n value was reported around 1.75–2.0. It was thought the value had not so big deviation from reported values. It was thought that tortuosity factor, τ, would be influenced by void ratio, ε, in the sample. ε was calculated from void ratio in the sample after coke combustion. Using the Eq. (15) and the above-mentioned n values, τ values were calculated at each void ratios and temperatures. Relationship between average τ values and void ratios at each temperature are shown in Fig. 9. Equation (18) was derived from approximate expression of this relationship.
|
τ=
2.40×
10
3
exp(12.5ε)
+1
| (18) |
From these discussions, the effective diffusion coefficient of oxygen can be expressed as
Eq. (19).
|
D
e
=1.78×
10
-5
(
T
273.15
)
2.09
ε
τ
| (19) |
3. Derivation of Coke Combustion Rate Equation with Considerations about Liquid Formation
3.1. Experimental Sample and Procedure
In practical iron ore sintering process, it can be thought that formation of molten calcium ferrite during coke combustion has strong effect on oxygen diffusivity. It is thought that reduction reaction of the calcium ferrite simultaneously occurs during coke combustion. This situation is too complex to focus on coke combustion reaction. To study the effect of liquid formation on coke combustion behavior under simple condition, CaO–SiO2–Al2O3 slag, without FeO, was prepared as substitution of calcium ferrite.
Pulverized coke, particle diameter is –125 μm, Al2O3 powder, particle diameter is –250 μm, and 23.1CaO-14.7Al2O3-62.2SiO2 slag, particle diameter is –250 μm, were well mixed as given mass ratios shown in Table 2. Mixing ratios of slag were decided as 0, 10, 30, and 50 volume% against Al2O3 powder. These mixtures were also pressed into tablet shape and used for the combustion experiment in a similar way as above paragraph of 2.1. In this experiment, only 1523 K was used as the combustion temperature.
Table 2. Mixing ratio of experimental samples for 3.1. (vol%).
| | Coke | Alumina | Slag |
|---|
Type 1
12.1 mass%Coke | Slag 0% | 21.9 | 78.1 | 0 |
| Slag 10% | 21.9 | 70.3 | 7.8 |
| Slag 30% | 21.9 | 54.7 | 23.4 |
| Slag 50% | 21.9 | 39.05 | 39.05 |
Type 2
18.1 mass%Coke | Slag 0% | 30.8 | 69.2 | 0 |
| Slag 10% | 30.8 | 62.3 | 6.9 |
| Slag 30% | 30.8 | 48.4 | 20.8 |
| Slag 50% | 30.8 | 34.6 | 34.6 |
Type 3
24.9 mass%Coke | Slag 0% | 38.6 | 61.4 | 0 |
| Slag 10% | 38.6 | 55.3 | 6.1 |
| Slag 30% | 38.6 | 43.0 | 23.4 |
| Slag 50% | 38.6 | 30.7 | 30.7 |
Reaction curves of Type 3 are shown in Fig. 10. From this figure, it was found that the higher of slag mixing ratio made the smaller combustion reaction rate. The other Types, 1 and 2, also showed same tendency. The cross-section micrographs of Type 3 after combustion experiment, with and without slag, are shown in Fig. 11. From this observation, slag film formation in the sample with synthesis slag was confirmed. In other words, the coke combustion rate became small with increasing of slag mixing ratio because liquid slag prevented oxygen diffusion.
3.3. Derivation of Coke Combustion Rate Equation
The mixed-control plot using the unreacted-core model was applied to derive reaction rate constant. Figure 12 shows relationship between mixing ratio of slag in the sample and interface chemical reaction rate constant, kc. It could be thought that liquid formation in the sample didn't effect on kc values, because kc didn’t depend on the slag mixing ratio in this figure.
Relationship between the mixing ratio of slag and effective diffusion coefficient, De, is shown in Fig. 13. From this figure, it was found that De became small with increasing of the slag mixing ratio. Main reason of this result was thought prevention of oxygen diffusion due to liquid formation in the sample. Relation between slag mixing ratio and De at each type of samples were calculated by curve fitting method in Fig. 13 as follows.
Type 1
|
D
e
=f(
V
CF
)=
0.54×
10
-4
exp(0.044×
V
CF
)
+0.11×
10
-5
(
m
2
/s)
| (20) |
Type 2
|
D
e
=f(
V
CF
)=
0.81×
10
-4
exp(0.036×
V
CF
)
+0.24×
10
-5
(
m
2
/s)
| (21) |
Type 3
|
D
e
=f(
V
CF
)=
1.0×
10
-4
exp(0.080×
V
CF
)
+1.8×
10
-5
(
m
2
/s)
| (22) |
It was assumed that change of De due to liquid formation was caused from change of the tortuosity factor. Therefore, f(0)/f(VCF) was applied as compensation coefficient for correction of coke combustion rate equation. f(0) is effective diffusion coefficient of oxygen without liquid formation. Relation between ratio of liquid formation and the tortuosity factor could be described as Eq. (23).
|
τ
′
=τ⋅
f(0)
f(
V
CF
)
(-)
| (23) |
Values of physical properties to need for calculations in this study were referred from literature.
5)
4. Conclusions
In order to understand the coke combustion behavior of quasi-particle in iron ore sintering process, effect of void ratio and liquid formation on coke combustion in fine layer was investigated and following results were obtained.
(1) Interface chemical reaction rate constant, kc, was independent on the mixing ratio of coke.
(2) The higher mixing ratio of coke made the larger effective diffusion coefficient of oxygen, because the higher mixing ratio of coke made the higher void ratio in the sample after coke combustion.
(3) The coke combustion rate became small with increasing of liquid formation amount, because liquid phase in quasi-particle prevented oxygen diffusion in there.
(4) In fine layer of the quasi-particle, interfacial chemical reaction rate coefficient of coke combustion and effective diffusion coefficient of O2 were expressed as follows.
|
k
c
=5.36×
10
-2
exp(-10.58×
10
3
/RT)
|
|
D
e
=1.78×
10
-5
(
T
273.15
)
2.09
ε
τ
′
|
|
τ=
2.40×
10
3
exp(12.5ε)
+1
|
Type 1:
f(
V
CF
)=
0.54×
10
-4
exp(0.044×
V
CF
)
+0.11×
10
-5
Type 2:
f(
V
CF
)=
0.81×
10
-4
exp(0.036×
V
CF
)
+0.24×
10
-5
Type 3:
f(
V
CF
)=
1.0×
10
-4
exp(0.080×
V
CF
)
+1.8×
10
-5
Symbols
A : Frequency factor (m/s)
C
(
O
2
,C
O
2
)
: O2 or CO2 concentration in gas phase (mol/m3)
C
(
O
2
,C
O
2
)⋅i
: O2 or CO2 concentration at reaction interface (mol/m3)
C
(
O
2
,C
O
2
)⋅S
: O2 or CO2 concentration at particle surface (mol/m3)
De : Effective diffusion coefficient in Al2O3 powder layer (m2/s)
D
O
2
: Molecular diffusion coefficient of O2 in air at 0 K (m2/s)
(
D
(
O
2
,C
O
2
)
)
eff
: Effective diffusion coefficient of O2 or CO2 in Al2O3 powder layer (m2/s)
E : Activation energy (J/mol)
F : Reaction ratio (–)
K : Equilibrium constant (–)
kc : Interfacial chemical reaction rate coefficient (m/s)
kf : Mass transfer coefficient in gas film (m/s)
n : Temperature-dependent factor of diffusion coefficient (–)
n
˙
: Overall reaction rate (mol/s)
n
˙
g⋅(
O
2
,C
O
2
)
: Mass transfer rate of O2 or CO2 in gas film (mol/s)
n
˙
p⋅(
O
2
,C
O
2
)
: Mass transfer rate of O2 or CO2 in Al2O3 powder layer (mol/s)
R : Gas constant (J/mol/K)
R
˙
: Interfacial chemical reaction rate (mol/s)
r0 : Initial radius after sphere approximation of sample (m)
ri : Radius of unreacted core after sphere approximation of sample (m)
T : Temperature (K)
t : Time (s)
U : Superficial velocity (m/s)
u : Gas flow rate (m/s)
VCF: Volume fraction of liquid phase in fine layer (–)
wt : Sample weight change from ignition to t (g)
W : Sample weight change from ignition to end of the experiment (g)
τ : Tortuosity factor (–)
τ' : Tortuosity factor with consideration of liquid formation (–)
ρcm: Carbon concentration in sample (mol/m3)
ε : Void fraction in fine layer after coke combustion (–)
References
- 1) Y. Hida, M. Sasaki, T. Enokido, Y. Umezu, T. Iida and S. Uno: Tetsu-to-Hagané, 68 (1982), 400.
- 2) E. kasai, Y. Omori and T. Iida: Tetsu-to-Hagané, 72 (1986), 1537.
- 3) E. kasai, S. Wu, T. Sugiyama, S. Inaba and Y. Omori: Tetsu-to-Hagané, 78 (1992), 1005.
- 4) W. E. Ranz and W. R. Marshall: Chem. Eng. Prog., 48 (1952), 173.
- 5) K. Sato: Bussei Teisu Suisan Hou, Maruzen Co., Ltd., Tokyo, (1975), 129.