Abstract
It is thought that numerical simulation model for estimation of temperature distribution in the iron ore sintering process is useful tool for stable operation of this process. The purpose of this study is to develop new numerical simulation model based on a combination of Hottel’s equation and coke combustion rate equation in quasi-particle derived from previous study. The following results were obtained. More practical temperature distribution could be calculated using coke combustion rate from previous work than in case of using only Hottel’s equation. Decrease of temperature distribution in the sintering layer was found with consideration of the liquid phase formation effect on coke combustion rate. This effect will increase with increasing of fine coke amount in the process.
1. Introduction
Temperature distribution in iron ore sintering process is one of the most important control items for stable operation. Therefore, it is thought that numerical simulation model for estimation of temperature distribution in the process is useful tool for improvement of iron sinter ore’s quality, decision of operating condition, new technology development, etc.
In the traditional numerical simulation model of the iron ore sintering process, Hottel’s equation1) was used as coke combustion rate equation. The Hottel’s equation could express combustion behavior of single carbon particle. However, practical existence situation of coke in the process is not only single particle but also one of the fine components of the quasi-particle. In the case of quasi-particle’s inside, Hottel’s equation can’t properly express coke combustion behavior because oxygen diffusion in fine layer of the quasi-particle additionally should be considered when the combustion rate is calculated. Therefore, the numerical simulation based on Hottel’s equation needs parameter correction for expression about the practical sintering process.2)
The purpose of this study is to develop new numerical simulation model based on a combination of Hottel’s equation and coke combustion rate equation in quasi-particle derived from previous study.3)
2. Principal
2.1. Basic Idea of Numerical Simulation Model
This study works on calculation of temperature distribution in the sintering layer using numerical simulation. In this numerical simulation model, simulation region is from an ignition point to obtainable point of sinter cake in Dwight Lloyd type sintering machine. Governance equation was discretized by dividing of the sintering layer to tiny control volume. The temperature distribution in the sintering layer was estimated by computing of difference approximation equation. To simplify the estimation of the temperature distribution, the following assumptions were applied in this study.
1. Radiation heat transfer is disregarded.
2. All heat of reaction contributes to change temperature of solid phase.
3. Temperature of the quasi-particle’s inside is isothermal condition.
4. Coke combustion, decomposition of limestone, drying/condensation of water, melting/solidification of calcium ferrite are considered as possible reactions in the sintering layer.
5. Change of structure inside of the layer during combustion reaction is disregarded.
2.2. Governance Equation
Energy conservation equation based on first law of thermodynamics was derived with considerations of the following factors about heat balance: heat transfer by convection, heat transfer by conduction, energy import by convection, and reaction heat in the control volume.
Energy conservation equations in the control volume are expressed as follows.
At solid phase
|
ρ
s
C
P⋅s
∂
T
s
∂t
-
6(1-
ε
a
)
d
h(
T
g
-
T
s
)
+
H
Coke
(
r
Coke
*
n
Coke
+
r
Quasi-paritcle
*
n
Quasi-particle
)
+
H
Lime
r
Lime
*
n
Lime
+
H
H
2
O⋅V
r
H
2
O⋅V
*
+
H
H
2
O⋅C
r
H
2
O⋅C
*
+
H
CF⋅G
r
CF⋅G
*
+
H
CF⋅S
r
CF⋅S
*
=
k
s
∂
2
T
s
∂
Z
2
| (1) |
At gas phase
|
ρ
g
C
P⋅g
∂
T
g
∂t
-
6(1-
ε
a
)
d
h(
T
s
-
T
g
)+
C
P⋅g
∂
ρ
g
uT
∂Z
=
k
g
∂
2
T
g
∂
Z
2
| (2) |
The equation of continuity in control volume is expressed by the following equation.
|
∂(
ρ
i
u
)
∂Z
=-
∂
ρ
i
∂t
+
r
i
*
| (3) |
Pressure drop of fluid flow in the control volume should be considered because the control volume is filled with fine particles. In this study, Ergun’s equation4) was applied for calculation of the pressure drop in particle packed layer.
|
ΔP
ΔZ
=
150
(1-
ε
a
)
2
(ϕd)
2
ε
a
3
⋅
μ
g
U+1.75
1-
ε
a
ϕd
ε
a
3
ρ
g
U
2
| (4) |
To simplify of this simulation, the representative particle diameter in control volume, d, was considered as constant value calculated from initial situation.
2.3. Reaction Formulas
2.3.1. Combustion Reaction of Single Particle Coke
In this work, Muchi’s report5) was used for calculation of combustion reaction rate of single particle coke. The combustion reaction is expressed by the following formulas.
|
C(s)+
O
2
(g)=C
O
2
(g)
| (5) |
|
C(s)+
1
2
O
2
(g)=CO(g)
| (6) |
To simplify of this simulation, a reaction of the formula (6) was ignored because only CO2 was detected in our previous work.3)
Mass balance of single coke particle is expressed by Eq. (7).
|
∂
r
Coke
∂t
=-(
M
Coke
ρ
Coke
)
⋅(
r
Coke
*
4π
r
Coke
2
)
| (7) |
The reaction rate of
Eq. (5) is expressed by the following equation.
|
r
Coke
*
=4π
r
Coke
2
k
′
C
O
2
| (8) |
Diffusion resistance in ash layer is ignored because the ash layer was porous. Therefore, diffusion resistance in gas film and chemical reaction resistance were only considered in this discussion. Mass transfer coefficient in gas film was calculated from Ranz-Marshall’s equation.6) Chemical reaction rate constant was estimated by Hottel’s equation1) as shown in Eq. (9).
|
k
r
=
6.53×
10
5
T
⋅exp(-184.3×
10
3
/RT)
| (9) |
Overall reaction rate constant of single particle coke combustion is expressed by
Eq. (10).
|
k
′
=1/
(
1
k
f
+
1
k
r
)
| (10) |
Mass balance of one quasi-particle, composed of fine coke, is expressed by the following equation.
|
∂
r
Quasi-particle
∂t
=-(
M
Coke
ρ
Coke
)
⋅(
r
Quasi-particle
*
4π
r
Quasi-particle
2
)
⋅
1
X
c
| (11) |
Combustion reaction rate is expressed by Eq. (12).
|
r
Quasi-particle
*
=4π
r
Quasi-particle
2
k
′
C
O
2
| (12) |
From previous work,3) overall reaction rate constant is shown as follows.
|
k
′
=1/
(
1
k
f
+
r
0
(
r
0
-
r
i
)
D
e
r
i
+
r
0
2
k
c
r
i
2
)
| (13) |
|
k
c
=5.36×
10
-2
exp(-10.58×
10
3
/RT)
| (14) |
|
D
e
=1.78×
10
-5
(
T
273.15
)
2.09
ε
τ
′
| (15) |
|
τ
′
=τ⋅
f(0)
f(
V
CF
)
| (16) |
|
τ=
2.40×
10
3
exp(12.5ε)
+1
| (17) |
Compensation formula of the tortuosity factor, with consideration about effect of liquid formation, was classified according to mixing ratio of coke in fine particle layer as follows.
(Cadd <12.5 mass%)
|
f(
V
CF
)=
0.54×
10
-4
exp(0.044×
V
CF
)
+0.11×
10
-5
| (18) |
(12.5 mass%≦Cadd <17.5 mass%)
|
f(
V
CF
)=
0.81×
10
-4
exp(0.036×
V
CF
)
+0.24×
10
-5
| (19) |
(17.5 mass%≦Cadd)
|
f(
V
CF
)=
1.0×
10
-4
exp(0.080×
V
CF
)
+1.8×
10
-5
| (20) |
In this work, Tsukamoto’s report7) was used for calculation of limestone decomposition rate. The decomposition reaction is expressed by the following formula.
|
CaC
O
3
(s)=CaO(s)+C
O
2
(g)
| (21) |
Mass balance of single limestone particle is expressed by
Eq. (22).
|
∂
r
Lime
∂t
=-(
M
L
ρ
L
)
⋅(
r
Lime
*
4π
r
Lime
2
)
| (22) |
The decomposition reaction rate is expressed by
Eq. (23).
|
r
Lime
*
=4π
r
Lime
2
k
′
(
C
C
O
2
*
-
C
C
O
2
)
| (23) |
Yagi
et al.8) reported about decomposition reaction of limestone as follows.
Decomposition reaction occurs at contact interface between unreacted phase, CaCO3, and reaction product phase, CaO. CO2 gas generated at the interface diffused to bulk flow through porous CaO phase, gas film around outside surface of the particle.
Mass transfer coefficient in gas film was calculated from Ranz-Marshall’s equation. Chemical reaction rate constant was reported by Yagi et al.8) as shown in Eq. (24).
|
k
r
=1.52exp(
-
40.0×
10
3
RT
)
| (24) |
Gas diffusion coefficient in reaction product phase
8,9) was reported as
Eq. (25).
|
D
Lime
=1.38×
10
-5
(
T
273.15
)
2
0.44
0.44
-0.41
| (25) |
Idea of water drying period separation, based on Muchi’s report,5) to constant-rate drying period and decreasing drying period was applied in this study. Constant-rate drying period means water content in solid phase is higher than water content limitation in it. In this period, water transfer can occur easily. Drying rate in this period is expressed by Eq. (26).
|
(w>
w
C
)
r
H
2
O⋅V
*
=-
6⋅h⋅(1-
ε
a
)⋅(
T
g
-
T
s
)
d⋅
H
H
2
O⋅V
| (26) |
Decreasing drying period means water content in solid phase is lower than water content limitation in it. In that case, water transfer in solid phase is rate determining step of water drying behavior. Drying rate in this period is expressed by Eq. (27).
|
(w<
w
C
)
r
H
2
O⋅V
*
=-
6⋅h⋅(1-
ε
a
)⋅(
T
g
-
T
s
)
d⋅
H
H
2
O⋅V
×(
w
-
w
e
w
C
-
w
e
)
| (27) |
Regarding water condensation, Wajima’s model10) was used in this study. With decreasing temperature, the water condensation starts when moisture content of gas reaches to saturated humidity. Saturated humidity curve is expressed by the following equation.
|
H
g⋅S
=0.005exp(0.057T)
| (28) |
An equation of water condensation rate could describe as the following equation when water condensation behavior obeyed relationship between water content and gas temperature in Eq. (28).
|
r
H
2
O⋅C
*
=G
∂
H
g⋅S
∂Z
⋅
1
M
H
2
O
=G
∂
H
g⋅S
∂T
⋅
∂T
∂Z
⋅
1
M
H
2
O
| (29) |
It was assumed that the concentrated liquid water existed as water content of solid phase. Therefore, fluidity of it was ignored in this study.
2.3.5. Melting/solidification of Calcium Ferrite
Liquid phase of binary-component calcium ferrite is formed by reaction between hematite and CaO, formed from decomposition of limestone, as shown in Eq. (30).
|
nCaO(s)+mF
e
2
O
3
(s)=nCaO⋅mF
e
2
O
3
(l)
| (30) |
Reaction rate equation of this reaction is shown as
Eq. (31).
|
r
CF,G
*
=4π
r
Ore
2
k
CF
n
Ore
⋅
1
M
Ore
| (31) |
Temperature function of the reaction rate constant, kCF, is expressed by the following equation from our previous work.11)
|
k
CF
=4.86×
10
-1
exp(
-21.26×
10
3
T
)
| (32) |
It was considered that solidification behavior of calcium ferrite liquid phase was obeyed binary phase diagram of CaO and hematite. Solid phase ratio was calculated using lever rule in the phase diagram at the time of solidification. Release amount of Latent heat can be expressed as Eq. (33) when the solid phase ratio per unit volume increases by Δgs.
Amount of temperature decrease from liquidus-line temperature, ΔT=TL–T, during micro time, Δt, can be derived by thermal analysis without considering for latent heat release.
From
Eqs. (33) and
(34), the following equation can be derived.
In this calculation, it was assumed the solidification was finished when solid phase ratio became 1, with considering for increase of solid phase ratio instead of the latent heat release.
3. Calculation
3.1. Calculation Conditions
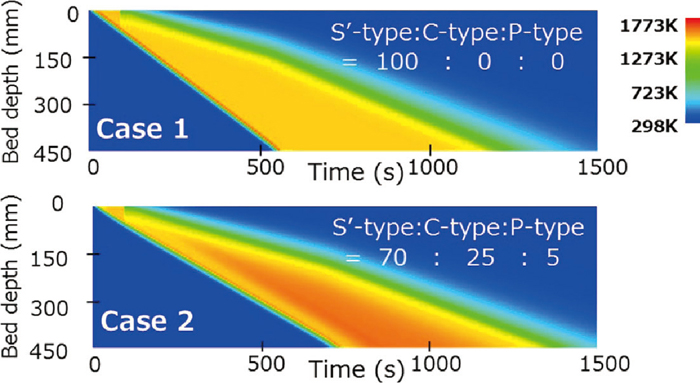
It is thought that existence situation of coke in the practical sintering layer is diverse. 3 kinds of case studies, existence situations of coke are different, were carried out in order to improve accuracy of the numerical simulation. Hida et al.12) categorized the coke existence situations into 3 types as shown in Fig. 1. Only single particle of coke, adhesion fine mixture of coke and hematite on hematite core, and fine mixture of coke and hematite are called S’ type, C type, and P type, respectively.
In the Case 1, only Hottel’s equation was used for calculation of coke combustion rate in the sintering layer under the assumption of existing of all cokes as S’ type.
In the Case 2, all situations of the coke existence, not only type S’ but also type C and P, was considered for the calculation. For calculation of the coke combustion rate, Hottel’s equation was used for type S’ coke, and experimental equation derived from previous work was used for type C and P. Ratio of each coke type was decided from practical process data.
In the Case 3, it was assumed that extremely huge amount of fine coke existed in the layer. From this assumption, coke existence situation was decided 40 mass% as type S’ and 60 mass% as type P. In that case, lack of heat could be expected because coke existence situation of type P was more difficult to combust than that of type S’. From this reason, coke amount in sinter bed in case 3 was increased to 4.5 mass%.
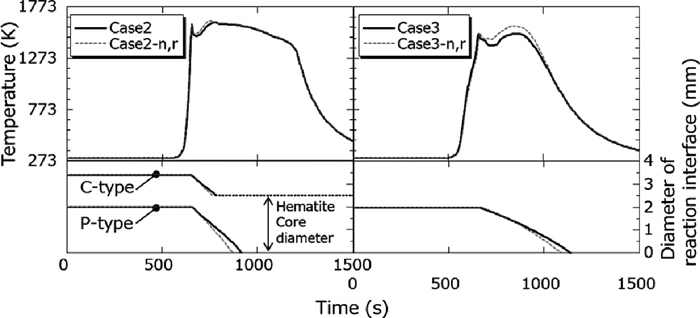
Additionally in the Case 2 and the Case 3, in order to investigate effect of liquid formation on heat distribution in the layer, the calculation was also carried out without the tortuosity factor correction due to liquid formation. Table 1 shows calculation condition for all cases based on the practical sintering process. Table 2 shows coke distribution patterns in quasi-particle for calculation. Values of physical properties to need for calculations in this study were referred from literature.9)
Table 1. Calculation conditions for simulation of temperature distribution in sinter bed.
| Condition of Sinter Bed |
Depth |
450 mm |
| Porosity |
40 vol% |
| Mixing condition of Materials | Hematite | 84 mass% | 2.5 mm:0.25 mm = 50:50 |
| Lime Stone (CaO) | 10 mass% | 2.0 mm |
| Moisture | 6 mass% |
| Coke | 4.0 mass%, 4.5 mass% | Excluded from the total |
| Operating condition | Initial temperature | 298 K |
| Ignition condition | 1573 K | 90 s |
| Gas flow rate (outlet) | 0.6 m/s |
| Calculation condition | Calculation cell | 5 mm |
| Time step | 0.001 s |
| Courant number | 0.2 |
Table 2. Coke distribution patterns in quasi-particle for calculation.
| Distribution Pattern Coke | Coke amount in Sinter Bed | Note |
|---|
| S’type | C-type | P-type | [Excluded from the total (mass%)] | |
|---|
| Quasi- particle’s diameter (mm) | 1.5
1.25
0.75
0.375
[in the same mass ratio] | 3.4 | 2.0 | |
|---|
| Case 1 | 100 | 0 | 0 | [4.0] | Hottel’s equation |
| Case 2 | 70 | 25 | 5 | [4.0] | – |
| Case 2-n,r | 70 | 25 | 5 | [4.0] | Disregard Slag (l) |
| Case 3 | 40 | 0 | 60 | [4.5] | – |
| Case 3-n,r | 40 | 0 | 60 | [4.5] | Disregard Slag (l) |
Visualized calculation results of heat distribution in the Case 1 and the Case 2 are shown in Fig. 2. It was confirmed that movement of combustion zone with time could be expressed by calculation result of this numerical simulation model.
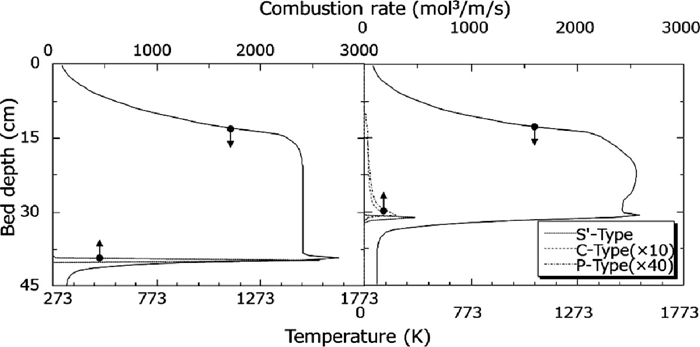
In the Case 1 and the Case 2, calculation results of temperature distribution and coke combustion amount after 500 s from ignition are shown in Fig. 3. Although high temperature layer width at over 1273 K was shown as about 250 mm in the Case 1 using only Hottel’s equation, narrower width of it as more practical temperature distribution could be calculated using coke combustion rate from previous work.3) From comparison of coke combustion amount, it was found coke burned out in a moment in the Case 1. In other words, combustion zone movement is faster than practical process because coke excessively burned in case of using only Hottel’s equation for calculation of coke combustion. As a result, it was thought that high temperature layer width was overestimated than practical process.
In order to investigate the effect of liquid formation on temperature distribution, comparison between calculation with consideration of liquid formation and without it was carried out in the Case 2 and Case 3 as shown in Fig. 4. This figure shows temperature history and reaction interface diameter change in quasi-particles of type C and P at 400 mm depth from upper surface of the sintering layer. From this figure, it was confirmed that decrease rate of reaction interface diameter became slow in case of considering for liquid formation. It was indicated that effect of liquid formation on coke combustion rate could be expressed by this numerical simulation model. The comparison of temperature histories in the Case 2 didn’t show significant difference because sum amount of type C coke and type P coke, they have strong effect of liquid formation, were small. On the other hands, about 100 K decrease of temperature distribution in the layer was found with consideration of the liquid phase formation effect in the Case 3. In other words, the effect of liquid phase formation should be considered when huge amount fine coke is included in the sintering layer.
4. Conclusions
In order to improve the numerical simulation model of temperature distribution in the sintering layer, new numerical simulation model based on a combination of Hottel’s equation and coke combustion rate equation in quasi-particle from previous study was developed. The following results were obtained.
(1) More practical temperature distribution could be calculated using coke combustion rate from previous work than in case of using only Hottel’s equation.
(2) Decrease of temperature distribution in the sintering layer was found with consideration of the liquid phase formation effect on coke combustion rate. This effect will increase with increasing of fine coke amount in the process.
Symbols
Cadd: Weight fraction of coke in fine of quasi-particle (mass%)
CO2,CO2 : O2 or CO2 concentration in gas phase (mol/m3)
C
C
O
2
*
: CO2 equilibrium concentration of limestone decomposition reaction (mol/m3)
CP·(s, g): Specific heat of solid or gas phase (J/kg/K)
De: Effective diffusion coefficient of O2 in Al2O3 powder layer (m2/s)
DLime: Diffusion coefficient of CO2 in CaO layer (m2/s)
d: Representative particle diameter in control volume (m)
dCoke: Coke diameter (m)
G: Mass velocity of air (kg(dry)/m2/s)
gS: Solid phase fraction (–)
Hg.s: Temperature function of saturated humidity curve (kg(H2O)/kg(dry))
HCoke: Combustion heat of coke (J/mol)
HLime: Decomposition heat of limestone (J/mol)
HH2O·V : Vaporization heat of water (J/mol)
HH2O·C : Condensation heat of water (J/mol)
HCF·G: Dissolution heat of calcium ferrite (J/mol)
HCF·S: Solidification latent heat of calcium ferrite (J/mol)
h: convection heat transfer coefficient (J/m2/s/K)
k(s, g): Thermal conductivity of solid phase or gas phase (J/m/s/K)
k’: Overall reaction rate coefficient (m/s)
kc: Interfacial chemical reaction rate coefficient (m/s)
kCF: Liquid formation rate coefficient of calcium ferrite (kg/m2/s)
kf: Mass transfer coefficient in gas film (m/s)
kr: Chemical reaction rate coefficient of single particle coke (m/s)
L: Release amount of latent heat per unit volume until complete solidification (J/m3)
MCoke,Lime,Ore,H2O : Molecular weight of coke, limestone, hematite, or water (kg/mol)
n(Coke,Quasi–particle,Lime,Ore) : Number per unit volume of coke, quasi-particle, limestone, or hematite (/m3)
Δ P: Pressure drop in packed bed (atm)
Q: Release amount of solidification latent heat per unit volume (J/m3)
R: Gas constant (J/mol/K)
r
x
*
: Formation rate of x (kg/s/m3)
r(Coke,Quasi–particle,Lime,Ore) : Distance from center of particle to reaction interface of coke, quasi-particle, limestone, or hematite (m)
r
(Coke,Quasi-particle,Lime)
*
: Reaction rate per one particle of coke, quasi-particle, or hematite (mol/s)
r
(
H
2
O⋅V,
H
2
O⋅C)
*
: Rate per unit volume of water vaporization or condensation (mol/s/m3)
r
(CF⋅G,CF⋅S)
*
: Rate per unit volume of calcium ferrite melting or solidification (mol/s/m3)
T: Temperature (K)
Ts,g: Temperature of solid or liquid phase in control volume (K)
TL: Liquidus line temperature (K)
t: Time (s)
U: Superficial velocity (m/s)
u: Gas flow rate (m/s)
VCF: Volume fraction of liquid phase in fine layer (–)
w: Water content in solid phase (–)
wc: Water content limitation (–)
we: Equilibrium water content (–)
Xc: Volume fraction of coke in fine layer of quasi-particle (–)
Z: One dimensional coordinate (m)
ΔZ: Length of control volume (m)
τ: Tortuosity factor (–)
τ′ : Tortuosity factor with consideration of liquid formation (–)
ρCoke,Lime: Density of coke or limestone (kg/m3)
ρx: Density of x (kg/m3)
ρs,g: Density of solid phase or liquid phase (kg/m3)
ε: Void fraction in fine layer after coke combustion (–)
εa: Void fraction in control volume (–)
ϕ: (Surface area of a sphere, it has same volume of the particle)/(Surface area of the particle) (–)
μg: Viscosity of air (kg/m/s)
References
- 1) A. S. Parker and H. C. Hottel: Ind. Eng. Chem., 28 (1936), 1334.
- 2) T. Hamada, T. Koitabashi and K. Okabe: Tetsu-to-Hagané, 58 (1972), 1567.
- 3) K. Ohno, K. Noda, K. Nishioka, T. Maeda and M. Shimizu: ISIJ Int., submitted.
- 4) S. Ergun: Chem. Eng. Prog., 48 (1952), 89.
- 5) I. Muchi and J. Higuchi: Tetsu-to-Hagané, 56 (1970), 371.
- 6) W. E. Ranz and W. R. Marshall: Chem. Eng. Prog., 48 (1952), 173.
- 7) T. Tukamoto, S. Simada, T. Taguchi and J. Higuchi: Tetsu-to-Hagané, 56 (1970), 661.
- 8) J. Yagi, K. Tamura and I. Muchi: J. Jpn. Inst. Met., 31 (1967), 103.
- 9) K. Sato: Bussei Teisu Suisan Hou, Maruzen Co., Ltd., Tokyo, (1975), 129.
- 10) M. Wajima, Y. Hosotani, J. Shibata, H. Soma and K. Tashiro: Tetsu-to-Hagané, 68 (1982), 1719.
- 11) T. Maeda, K. Nishioka and M. Shimizu: Proc. of 3rd Int. Conf. on Process Development in Iron and Steelmaking, MEFOS, Luleå, (2008), 99.
- 12) Y. Hida, M. Sasaki, T. Enokido, Y. Umezu, T. Iida and S. Uno: Tetsu-to-Hagané, 68 (1982), 400.
