Abstract
The particle and the air motions in the nearly full scale sintering bed have been simulated to elucidate the void (crack) formation mechanism and the crack growth mechanism. The simulation results showed that the contraction force produced the large scale cracks in the wide area in the fixation zone above the melting zone. Since the contraction force acts toward the particle center from each contact point, the resultant force in the inhomogeneous configuration of contact point moves the particles in the melted liquid. This migration produced the agglomerate which grew continuously. The bed weight in the sintering particle bed disrupted the large agglomerate. Through the process the cracks (voids) further grew and merged to a large scale crack. Large scale cracks developed taking account of the contraction force well represented the measured large scale cracks in the full scale sintering bed obtained using CT scan. In the case that the liquid volume produced by melting was large such as 88% of particle volume, the distance between the neighboring particles in the melted liquid became large and the liquid film between particles became thick. Thus it became hard for particle to move by the resistance force in the liquid. Therefore the agglomerate and the void did not grow to the large scale crack. The agglomeration of particles for 88% of particle volume melted was not so fast that the sintering bed in which the agglomerate particles uniformly distributed was formed.
1. Introduction
Simulation of particle bed in sintering process is one of the most interesting research topics. Ramos et al.1) presented the numerical simulation model to describe the structural change in the iron ore sintering bed. The results show that the carbon content and the melting temperature affect the final structure of the bed. Yamaoka and Kawaguchi2) proposed 3-dimensional mathematical model for the sintering process to make an optimized design of sintering system. The pot test shows that the model could calculate the transitions of gas temperature and compositions, and the distributions of pore ratio and mineral compositions inside the sintering cake. Aizawa and Suwa3) developed the artificial unit-cell model based on Phase Field Model and Finite Element Method. The results show that the model would be a reliable tool to control the size, shape and distribution of meso-scale pores. Umekage and Yuu4) have presented the mechanism of the bed structure changes, the bed shrink and the local void formations. The simulation has been performed in the nearly full scale bed of which height was about 600 mm to predict the large scale structure change. The mechanism of the sintering bed placing the large particles (MEBIOS particles) has been simulated. Yuu and Umekage5) have shown the effects of air flow, liquid film cohesion force and fixation process on the large scale crack in the sintering process. They have presented the mechanism of large scale crack using the simulation results. The decrease of freedom of particle motion by the fixation process in the fixation zone generated the locally large contact force which was about 250 times larger than the usual cohesion force between particles in the agglomerate and the large velocity difference between agglomerates. Those broke down the agglomerate particles. Through the fixation zone the cracks (voids) further grew and merged to a large scale crack. The large cohesion force produces the large agglomerate. The destruction of large agglomerate generates and enlarges the crack.
The particle shrinkage by melting causes the contraction force which acts toward the center of particle. In this study we considered the contraction force acted toward the particle center at each contact point. The effect of contraction force on the formation of the large scale crack in the sintering process has been simulated. The mechanism of the crack origination and the growth by the contraction force has been presented. The sintering process for 88% of particle volume melted in the melting zone has been simulated. The effect of the melted particle volume on the growth of void has also been shown using the simulation results in this paper.
2. Computational Procedure
2.1. Gas Phase Calculation
The governing equations for the gas phase are the three-dimensional Navier-Stokes equations with interaction terms between the gas and particles, and the fluid continuity equation. In the present simulation the air was used for the gas. The non-dimensional forms are as follows:
|
ε
∂u
∂t
+(
εu⋅∇u
)
=-ε∇p+
ε
Re
[
∇
2
u+
1
3
∇(
∇⋅u
)
]-St-S
t
L
| (1) |
St and StL in the above equations are the interaction terms of the drag and the lift forces between the gas and particles. Motions of the gas and particles linked through these interaction terms. Substitution of the drag coefficient into the equation of the drag force gives the equation for St. We used Schiller and Naumanns6) experimental drag coefficient, which is applicable to flows for the particle Reynolds number Rep ≤ 1000.
|
St=
3πμ
D
p
ND(
1+0.15R
e
p
0.687
)
U
0
ρ
(
u-
u
p
)
ξ(
ε
)
(
0≤R
e
p
≤1 000
)
.
| (3) |
When
Rep is larger than 1000, Newton’s drag coefficient gives the following equation.
|
St=0.055π
D
p
2
ND
(
u-
u
p
)
2
ξ(
ε
)
(
1 000<R
e
p
)
.
| (4) |
The correction factor ξ(ε) in the above equations describe the effect of neighboring particles on the drag force. We used the experimental equation presented by Umekage and Yuu.7)
|
ξ(
ε
)
=3.8-
5.4
ε
+
2.6
ε
2
.
| (5) |
For the lift force term StL, we used the same equations presented by Yuu et al. in their paper.8)
The Poisson equation derived by taking the divergence of Eq. (1) was solved by the relaxation method.9)
|
ε
∇
2
p=-∇⋅(
ε
∂u
∂t
)
-ε∇⋅(
u⋅∇u
)
+
ε
Re
∇⋅[
∇
2
u+
1
3
∇(
∇⋅u
)
]-∇⋅St-∇⋅S
t
L
.
| (6) |
The fourth and the second order central difference schemes were used for the convection terms and other spatial derivative terms, respectively. The second order Runge-Kutta method was used for the time derivative terms.
2.2. Particle Calculation
The particle motions were calculated using DEM.10,11) The equations for the particle motion are as follows,
|
m
p
d(
U
pi
)
dT
=
∑
j
(
F
ij
+
D
ij
+
F
Cij
+
F
Nij
)
+
F
Di
+
F
Li
+
F
Ri
+
F
Gi
| (7) |
|
I
p
d(
Ω
pi
)
dT
=
∑
j
(
M
ij
+
M
Dij
)
+
M
Fi
.
| (8) |
The first terms of the right hand side in Eqs. (7) and (8) are the resultant contact force and the resultant contact moment among the reference particle i and the contact particles j. FDi and FLi in Eq. (7) are the drag force and the lift force between the reference particle i and the gas. FDi and FLi for the reference particle i are obtained using the non-dimensional drag and lift forces, St and StL, in Eq. (1). For example Eq. (9) shows FDi obtained using St of Eq. (3).
|
F
Di
=3πμ
D
p
(
1+0.15R
e
p
0.687
)
(
U
i
-
U
pi
)
ξ(
ε
)
| (9) |
FDi and FLi are obtained using the dimensional forms of Eqs. (3) and (6) for the particle i. FCi and FRi in Eq. (7) are the cohesion force by the liquid bridge and the drag force which acts on approaching particles with the liquid film. FNi in Eq. (7) is the contraction force. When a particle has been melted, the particle shrinkage by melting causes the contraction force FN i which acts toward the center of particle at the each contact point. FGi in Eq. (7) is the gravitational force of the particle i. For the fluid friction torque MFi in Eq. (8) we used the same equations presented by Yuu et al. in their paper.8) Others are shown in Nomenclature. Yuu et al.4,5) present the detail of the similar computational procedure in the journal. See the reference 5 for the detail.
2.3. Computational Domain and Conditions
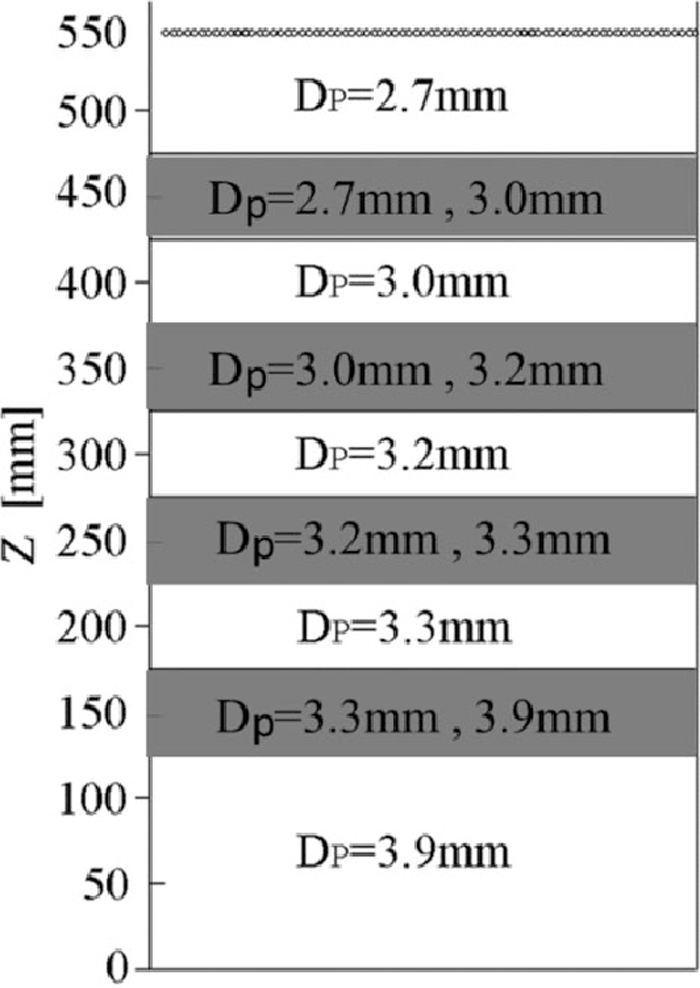
Figure 1 and Table 1 show the computational domain and computational conditions. 550 mm of the particle bed height is equal to the bed height in the nearly full scale sintering furnace. The number based contents of the iron ore particles, the limestone particles and the coke particles were 85%, 10% and 5% respectively and the motions of 78000 particles were calculated. Figure 2 shows the particle size segregations which are nearly equal to the measured values in the actual furnace. The particle size at the arbitrary location in the gray colored columns in Fig. 2 was calculated by the linear proportion method.
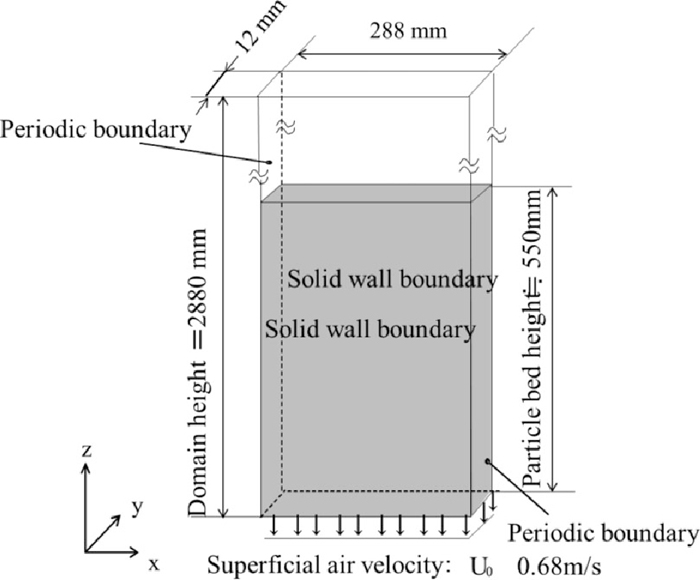
Table 1. Computational conditions.
| Particle diameters, Dp | 2.7 mm–3.9 mm |
| Number of particles | 7.8 × 10⁴ |
| Particle densities, ρp | Iron ore | 3.15 × 10³ kg/m3 |
| Coke | 1.05 × 10³ kg/m3 |
| Limestone | 2.57 × 10³ kg/m3 |
| Modules of elasticity, E | 1.0 × 10⁷ N/m2 |
| Poisson ratio, ν | 0.25 |
| Friction coefficient | Particle-Particle, μp | 0.45 (before sintering)
1.0 (after sintering) |
| Particle-Bottom wall, μw | 0.45 |
| Computational cell sizes | ΔX | 12 mm |
| | ΔY | 2 mm |
| | ΔZ | 12 mm |
| Superficial suction gas velocity, U0 | 0.68 m/s |
| Time step, ΔT | 5.0 × 10⁻⁶s |
| Ratio of particle volume melted | 50% and 88% |
| Constant in cohesion force by Eq. (9) | A=1 and 2 |
| Contraction force | 0, 10 and 50 times of particle weight |
Same values of μp, μw, ν and E were used for all kinds of particles.
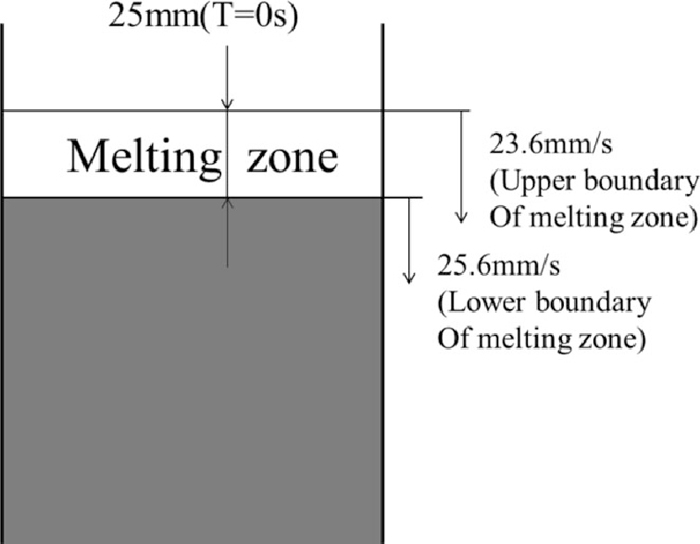
In the actual sintering bed the vertical width of the melting zone changes from about 25 mm at the top of the particle bed to about 75 mm at the bottom. It represents the growth of the melting zone with approaching to the bottom of the particle bed according to the combustion. It means that the descending velocity of the melting zone at the top of the bed was set to be smaller than that at the bottom of the bed. In the model we decide the descending velocities of the upper and the lower boundaries of melting zone which linearly changes the width based on above data as shown in Fig. 3. The descending velocity of the melting zone in the present simulation was set to be about 100 times larger than that of the actual sintering process in order to represent the sintering process by the simulation in which the calculation for the long time as the actual sintering process takes place is extremely difficult.
2.4.2. Model of Particle Phase Change in Melting Zone
[Iron ore particles of which content is 85% number based of whole particles]
When the bottom of the melting zone reached an iron ore particle center, 50% (or 88%) of the particle volume was melted and the diameter Dp of the ore particle reduced to 0.794 Dp (or 0.493 Dp) by melting the particle surface. The cohesion force by Eq. (10) acted between the particles contacted by the melting liquid and the drag force by Eq. (11) acted on the particle by the melting liquid around the particle surface. In this model 0.794 Dp (or 0.493 Dp) was used for the particle diameter in DEM calculation after the particle has been melted. It means that the particle is able to move in the melted liquid. 1.0 Dp was used in the calculation of the interaction force between gas and particle, and the packing fraction, whichever the particle surface was the solid of the ore or the melted liquid. When the top of the melting zone reached the particle center, the angular velocity set to be zero, the cohesive force between contact particles was taken to become 10 times larger than the cohesion force in the melting zone and the friction coefficient was also taken to become larger to be 1.0 from 0.45. These represented the soft fixation of the particles in the sintering bed above the melting zone.
When a particle has been melted, the particle shrinkage by melting causes the contraction force which acts toward the center of particle. The contraction force on the particle is locally different due to contact particles. Then we considered when the top of the melting zone reached the particle center, the contraction force acted toward the particle center at each contact point as shown in Fig. 4. It represents the in-homogeneous and anisotropic distribution of contraction force on a particle. The resultant force of the in-homogeneous and anisotropic forces on a particle affects the particle motion. We simulated the cases of which contraction forces were equal to 0, 10 and 50 times of the particle weight which is the averaged weight of the reference particle i and each contact particle j. In the case that the contraction force is 50 times of the particle weight, the contraction rate of particle obtained by DEM calculation is about 2.0% which is reasonable value in the actual sintering process.

[Limestone particles of which content is 10% number based of whole particles]
When the bottom of the melting zone reached a limestone particle center, 45% of the particle volume was gasified. 55% of the volume melted and the melting liquid was distributed equally to the iron ore particles contacted to this limestone particle which was removed instantaneously from the computational domain.
[Coke particles of which content is 5% number based of whole particles]
When the bottom of the melting zone reached a coke particle center, the particle burned out and it was removed instantaneously from the computational domain.
The cohesion force FC which acted on the particles with the melting liquid film was calculated using Eq. (10) of the liquid bridge force which was the normal cohesion force.12)
|
F
C
=πAγdsinα[
sin(
α+θ
)
+
d
4
(
1
R
1
-
1
R
2
)
sinα
],
| (10) |
where
d is the solid particle diameter, that is 0.794 D
p (or 0.493 D
p) for the equal particles. The averaged particle diameter was used for d for the unequal particles and
θ which is the contact angle between the liquid and the solid particle surface was assumed to be equal to zero in the present calculation. Others are shown in
Nomenclature.
The Eq. (11) of Happel and Brenner13) gives the drag force FR which acts on approaching particles with the liquid film as shown in Fig. 5.
|
F
R
=3π
μ
l
d
u
pn
β
| (11) |
β=
4
3
sinhϕ
∑
n=1
∞
n(
n+1
)
(
2n-1
)
(
2n+3
)
[
2sinh(
2n+1
)
ϕ+(
2n+1
)
sinh2ϕ
4
sinh
2
(
n+1/2
)
ϕ-
(
2n+1
)
2
sinh
2
ϕ
-1
]
,
ϕ=
cosh
-1
2L
d
,
The thin liquid film between particles dominates FR. The 5th terms in the series of β in Eq. (11) were used, namely the terms for n=1 to 5. The increment of β by the term for n=5 was less than 0.5%. γ =0.63 N/m and the liquid viscosity μl=0.06 Pa s were used in Eqs. (10) and (11) respectively. The drag force acting on the reference particle i through the liquid film considering each particle j contacted with particle i by the liquid film was calculated using Eq. (11). The resultant drag force acting on the reference particle i obtained by considering the whole particles j contacted by the liquid films is FRi in Eq. (7). Similarly the resultant force of FC acting particle i are FCi in Eq. (7).
In order to find contact particles efficiently, the partition with 4 mm edge, which was nearly equal to maximum particle diameter, for the contact point between small particles was used.
2.5. Initial Packing
The cubic packing based on the maximum particle diameter (Dp =3.9 mm) of the particles which were arranged to take account of the segregation in the vertical direction was made in the computational domain. According to the number ratios that the iron ore particle was 85%, the limestone particle was 10% and the coke particle was 5%, the cubic packing of particles was arranged using the random number. 10% of the particles in the cubic arrangement were erased to form naturally uniform packing using random number. Then the sedimentation started. The initial particle arrangement which indicates the distribution of three kinds of particles before the sedimentation started is the same as that in Fig. 5 in our paper.5)
3. Results and Discussion
3.1. Sintering Simulation Taking Account of Contraction Force
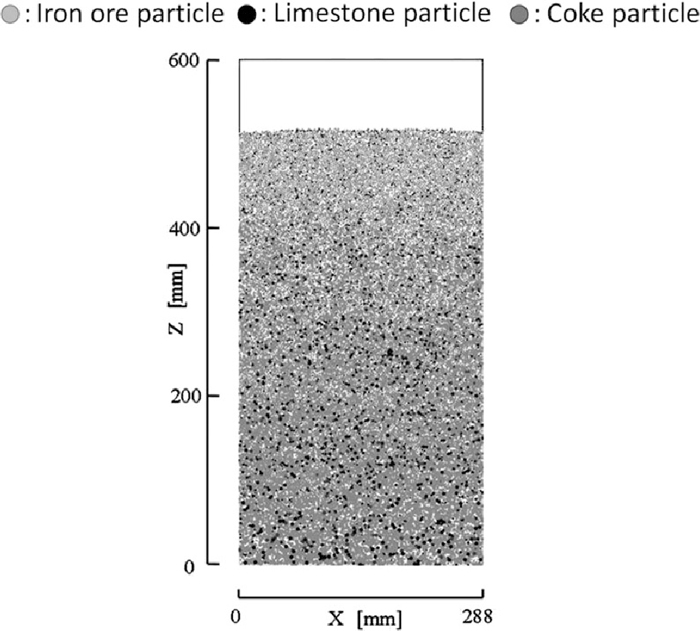
When the particle velocities of whole particles in the bed became less than 1.0 mm/s through the sedimentation, it was presumed that the initial quiescent particle packing state was made in the sintering bed. It took about 3.6 s. Figure 5 shows the initial particle packing state after the 3.6 second sedimentation from the initial particle arrangement. The particle location in Fig. 5 was the initial state for DEM calculation for the sintering processes. The cut surfaces of particles which exist in the central cross sectional area (y = 6 mm) are plotted in the figures of calculated particle location in this paper.
Figure 6 shows the calculated time evolution of particle locations with the different contraction forces in the sintering processes for A = 1 where A is constant in the cohesion force Eq. (10). A = 1 indicates usual cohesion force. In this simulation 50% of particle volume melted in the melting zone. Two lines in this figure indicate the bottom and the top of the melting zone. In this study we considered when the top of the melting zone reached the particle center, the contraction force acted toward the particle center at each contact point. Figure 6 shows the comparison of the time evolution of sintering process with the different contact forces. The initial particle locations with different contraction force are the same. Figures 6(a)1, 6(b)1 and 6(c)1 show the calculated particle locations with the contraction forces which are equal to 0, 10 and 50 times of the particle weight, respectively, at T = 8 s after the sintering started. Comparison of the figures with each other shows that the contraction force slightly accelerates the void growth in the area above the top of the melting zone. Figures 6(a)2, 6(b)2 and 6(c)2 which show the calculated particle locations at T = 16 s after the sintering started indicate that the contraction force produces the large voids in the upper part of the area above the melting zone. Figures 6(a)3, 6(b)3 and 6(c)3 which show the calculated particle locations at T = 20 s after the sintering started indicate that the contraction force produces the large scale voids (cracks) in the sintering bed above the melting zone. The comparison of Fig. 6(c)3 of the contraction force of 50 times of the particle weight with Fig. 6(b)3 of the contraction force of 10 times of the particle weight shows that larger contraction force produces larger scale cracks in the center region of sintering bed. Figures 6(a)4, 6(b)4 and 6(c)4 which show the calculated particle locations at T = 28 s after the sintering started indicate that the contraction force produces the large scale cracks in the wide area above the melting zone. Particularly the large contraction force which is 50 times of the particle weight produces the large scale voids which spread over the whole region of the sintering bed as shown in Fig. 6(c)4. The large scale cracks shown in Fig. 6(c)4 fairly well represent the large scale cracks in the actual sintering bed obtained using CT scan.14)
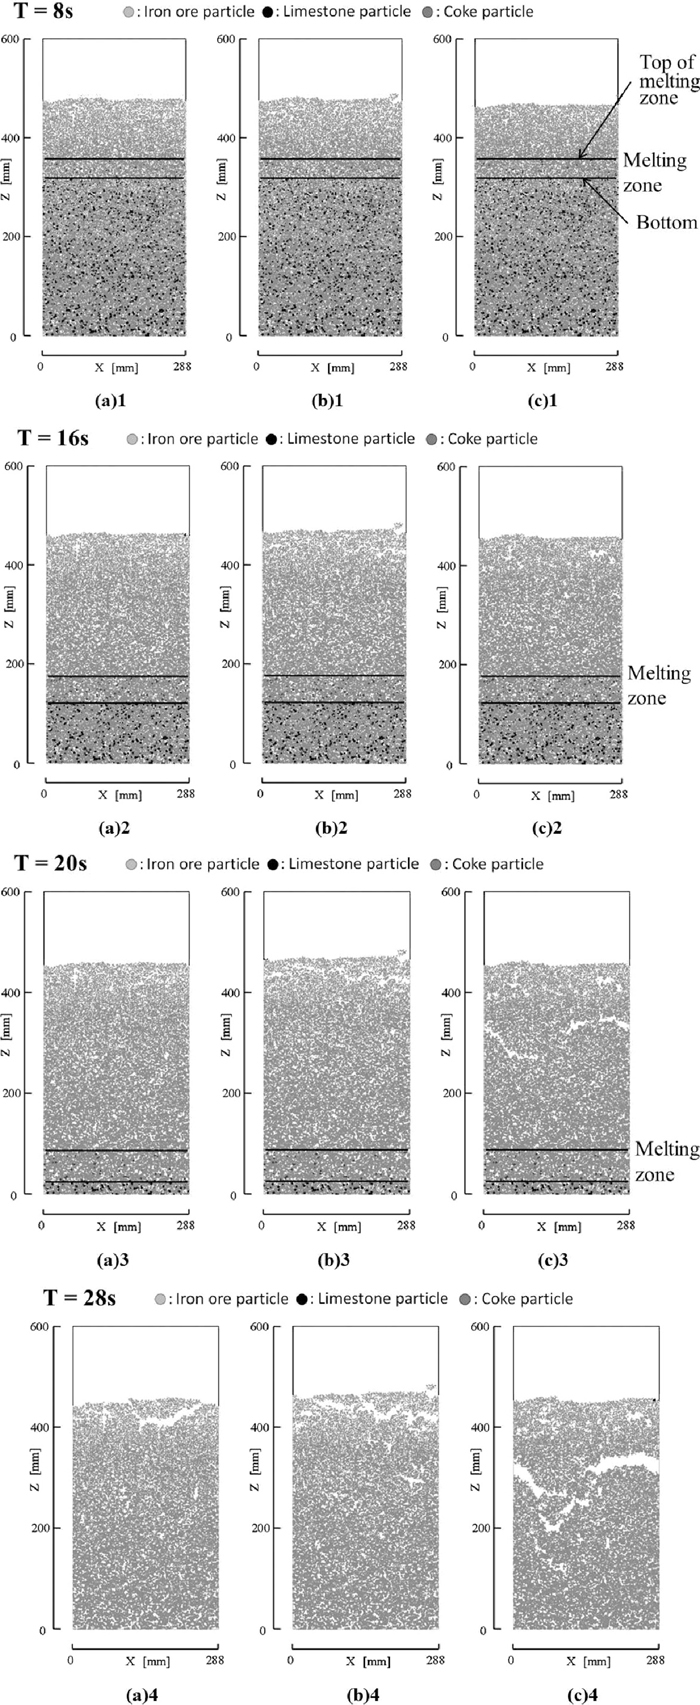
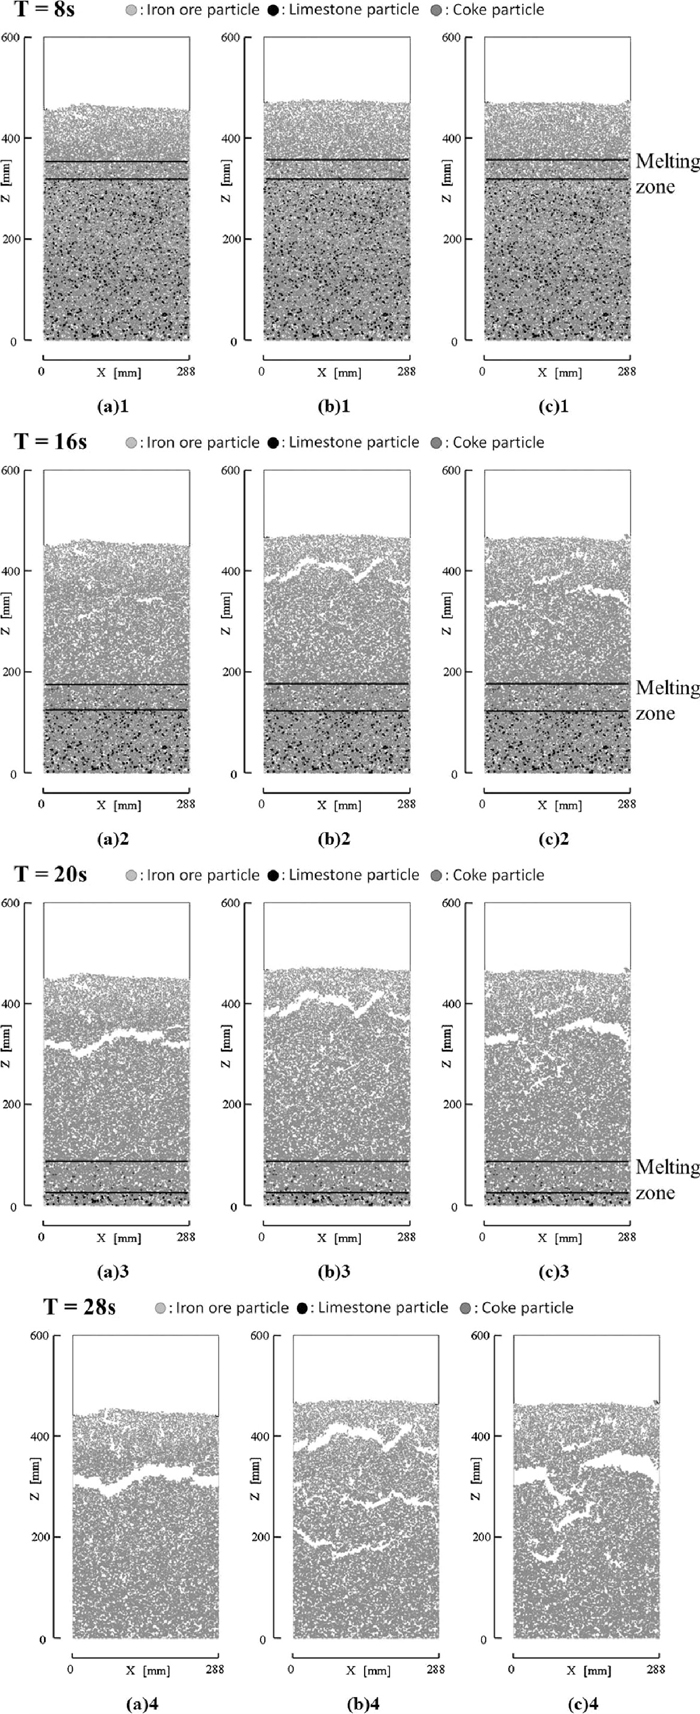
Figure 7 shows the calculated time evolution of particle locations with the different contraction forces in the sintering processes for A = 2 in the cohesion force Eq. (10). A = 2 indicates two times of the usual cohesion force. In this simulation 50% of particle volume melted in the melting zone. Figures 7(a)1, 7(b)1 and 7(c)1 show the calculated particle locations with the contraction forces which are equal to 0, 10 and 50 times of the particle weight, respectively, at T = 8 s after the sintering started. Comparison of the figures with each other shows that the contraction force slightly accelerates the void growth in the area above the top of the melting zone. The effect of A = 2 which means the large cohesion force does not appear in these figures in this stage. Figures 7(a)2, 7(b)2 and 7(c)2 which show the calculated particle locations at T = 16 s after the sintering started indicate that the contraction force produces the large voids (cracks) in the wide area above the melting zone. The effect of A = 2 appears clearly in this stage. Figures 7(a)3, 7(b)3 and 7(c)3 which show the calculated particle locations at T = 20 s after the sintering started indicate the large scale cracks in the bed in the fixation zone. The locations where the large scale cracks appear in the sintering bed with contraction forces are different with that of the large scale cracks without the contraction force. This means that the contraction force largely affects the formation mechanism of the large scale crack. The comparison of Fig. 7(c)3 of the contraction force of 50 times of the particle weight with Fig. 7(b)3 of the contraction force of 10 times of the particle weight shows that larger contraction force produces larger scale cracks in the center region of sintering bed. Figures 7(a)4, 7(b)4 and 7(c)4 which show the calculated particle locations at T = 28 s after the sintering started indicate that the contraction force produces the large scale cracks in the wide area above the melting zone. Particularly the large contraction force which is 50 times of the particle weight produces the large scale cracks which spreads over the whole region of the sintering bed as shown in Fig. 7(c)4. The effect of A = 2 appears remarkably in this stage. The large cohesion and contraction forces produce the large agglomerates. The breakage of large agglomerates yields large scale cracks. The large scale cracks shown in Fig. 7(c)4 well represent the large scale cracks in the actual sintering bed obtained using CT scan.14)
The liquid which is the melting of 50% volume of iron ore particle and 55% volume of limestone particle produces the liquid film around particles and the burning of 45% of limestone and 100% of coke particles creates the void among particles in the melting zone. We considered that the contraction force acts toward the particle center at each contact point. The resultant contraction force in the inhomogeneous configuration of contact point moves the agglomerate and produces larger agglomerate. Then the cohesion force by the liquid film and the contraction force by the particle shrinkage by melting cause the agglomeration of particles and grows the void. The mobility of particle motion is sharply decreased by fixing angular velocity to be zero and the large friction coefficient, 1.0 in the fixation zone. Through the fixation zone the cracks (voids) further grow and merge to a large scale crack.
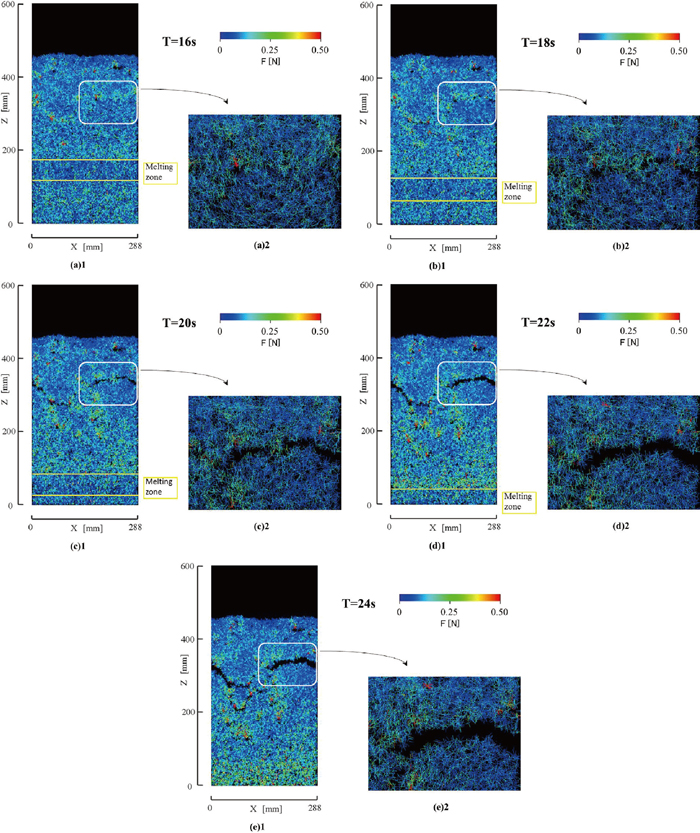
Figure 8 shows the calculated color iso-contour of contact force at contact points of particles. Figure 8(a) shows the color iso-contour at T = 16 s after the sintering process started. Figure 8(a)1 indicates that the large contact force appears in the fixation zone and Fig. 8(a)2 indicates that the crack is originated by the large contact forces and the large crack would be generated by the large contact forces. Figures 8(b), 8(c), and 8(d) at 18 s, 20 s and 22 s, respectively, show the time evolution of the growth of crack. The figures indicate that the cracks grow by means of the largely inhomogeneous contact forces which are distributed in the fixation zone. As shown in these figures the large contact force mainly appears in the fixation zone. The fixation process produced the large agglomerates and the largely inhomogeneous contact forces between them. The large contact force, for example 0.5 N shown in Fig. 8, is about 250 times larger than usual cohesion force by the liquid film. The large force for example the bed weight in the sintering particle bed disrupts the large agglomerate and enlarges the crack. Through the fixation zone the cracks further grow and merge to a large scale crack. Figure 8(e) at T = 24 shows the final form of the color iso-contour of contact force at contact points of particles in the sintering bed.
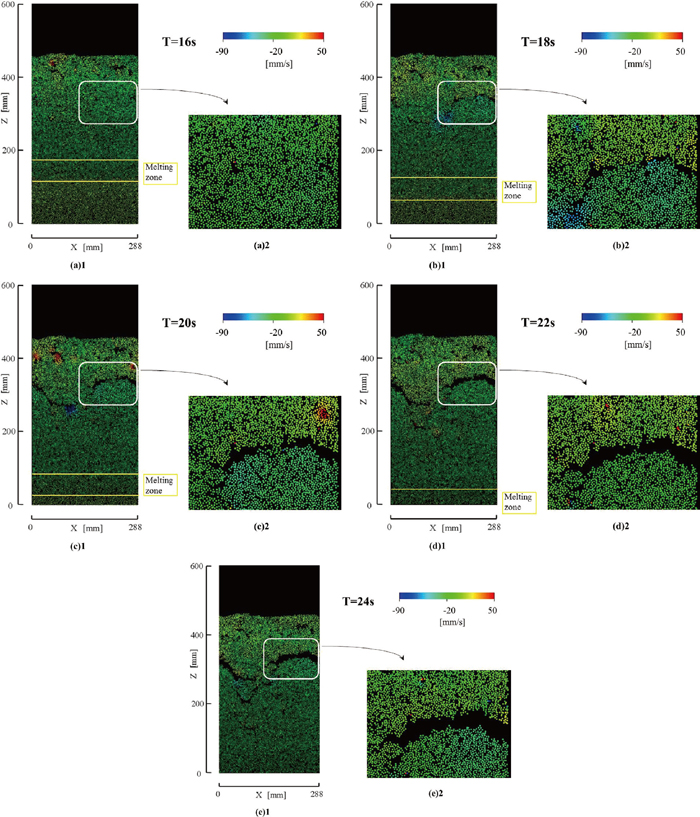
Figures 9(a), 9(b), 9(c), and 9(d) show the calculated particle locations and color iso-contours of particle vertical velocity at various times after the sintering process started. Particles of which diameter reduced to 0.794 times of the initial diameter by melting the particle surface existing in the central cross sectional area (y = 6 mm) are plotted in these figures. The particle configurations in these figures indicate agglomerates in which the particles directly contact and also indicate particles which are not agglomerated. There are many agglomerates in the fixation zone. These figures indicate that the agglomerates further grew and broke to a large scale crack through the fixation zone. Figures 9(a), 9(b), 9(c), and 9(d) show the time evolution of the growth of crack and the particle vertical velocity in the sintering bed at T = 16 s, 18 s, 20 s and 22 s, respectively, after the sintering process started. The figures indicate that the remarkable velocity differences among agglomerates are induced in the fixation zone. On the other hand the velocity difference slightly appears in the melting zone and does not exist below the melting zone. The process of the soft fixation of the particles and the contraction force in the fixation zone produced the large velocity difference which expanded the crack. The figures indicate that the crack grow by the large velocity difference. The inhomogeneous large contact force produces the large velocity difference which induces to grow the crack to the large scale crack. Figure 9(e) at T = 24 shows the final form of the color iso-contour of vertical particle velocity in the sintering bed.
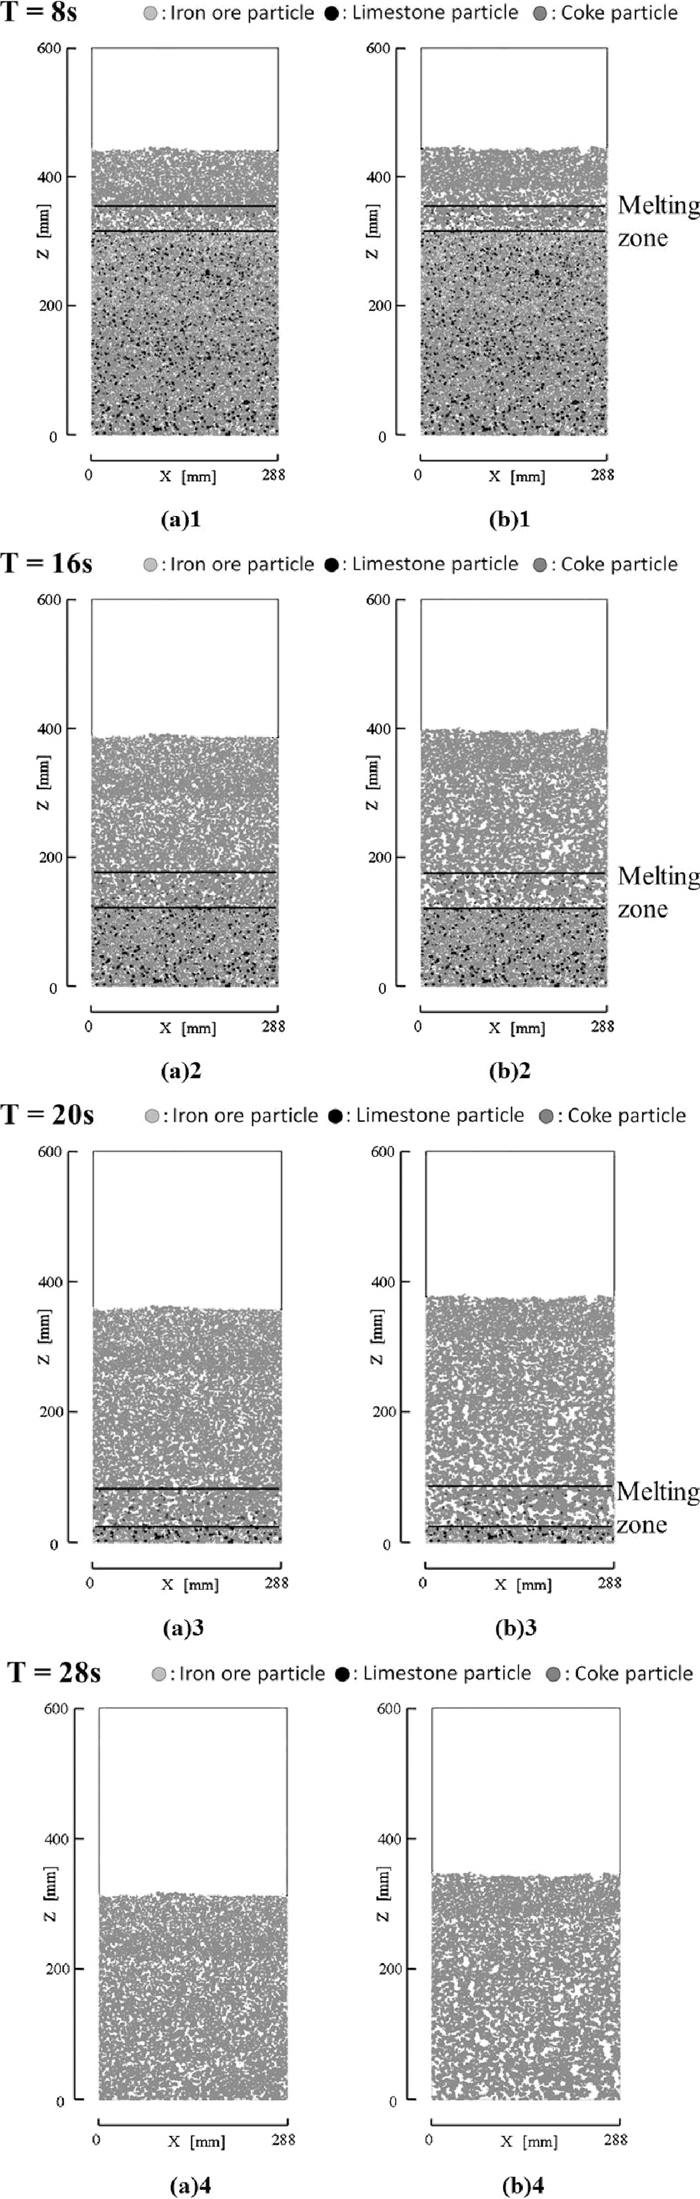
When the bottom of the melting zone reached an iron ore particle center, some portion of the particle volume was assumed to be melted. The sintering process for 88% of particle volume melted in the melting zone has been simulated. In this simulation the contraction force was not considered. The initial particle packing state for this case is the same state shown in Fig. 5. The simulation results of sintering processes of A = 1 and 2 in the cohesion force Eq. (10) for 88% of particle volume melted at t = 8 s, 16 s, 20 s and 28 s after the sintering started have been presented in Fig. 10. The comparison of Figs. 10(a)1–10(b)4 with Figs. 6(a)1–6(a)4 and 7(a)1–7(a)4 indicates that the void size produced in the melting zone in which 88% of particle volume was melted is larger than that of 50% of particle volume melted. Since the particle moves in the large liquid volume melted, the large void is produced. Figure 10 shows that the voids slowly grow and do not produce the large scale crack in the fixation zone for 88% of particle volume melted. In the case that the liquid volume produced by melting is large such as 88% of particle volume, the liquid film between particles becomes thick. Therefore the agglomeration does not occur frequently. Then the void does not grow so fast and the large scale crack is not produced. Particles moved in the large liquid area which was produced by melting and the distance between particle centers became gradually small. Thus the height of the sintering particle bed for 88% of particle volume melted became lower than that for 50% of particle volume melted as shown by the comparison of Figs. 10(a)1–10(b)4 with Figs. 6(a)1–6(a)4 and 7(a)1–7(a)4. The voids of the sintering process of A = 2 in the cohesion force Eq. (10) for 88% of particle volume melted are larger than those of A = 1 as shown in Fig. 10. This is because that the the cohesion force for A = 2 is 2 times larger than that for A = 1. The large cohesion force produces the large agglomerate and the large void. However these voids do not grow to the large scale void (crack) because the distance among particles is long in the large liquid area which was produced by melting of 88% of particle volume. The agglomeration of particles for 88% of particle volume melted is not so fast that the sintering bed in which the particles uniformly distributed is formed as shown in Fig. 10. The ore particle in which the large volume is melted such as 88% of ore volume might be used to produce the homogeneous sintering bed in which the particle uniformly distributed.
The contraction force acts toward the particle center at each contact point. Then one may imagine that the resultant contraction force in the inhomogeneous configuration of contact point moves the agglomerate and produces larger agglomerate even if there is the thick liquid film among particles in the large liquid area. In this paper the simulation result of the sintering process in which the liquid volume produced by melting is large such as 88% of particle volume with the contraction force has not been presented. The sintering simulation in the particle bed of the large particle volume melted with the contraction force is our future work.
3.4. Description of Void and Crack Formation in Sintering Bed for 88% of Particle Volume Melted
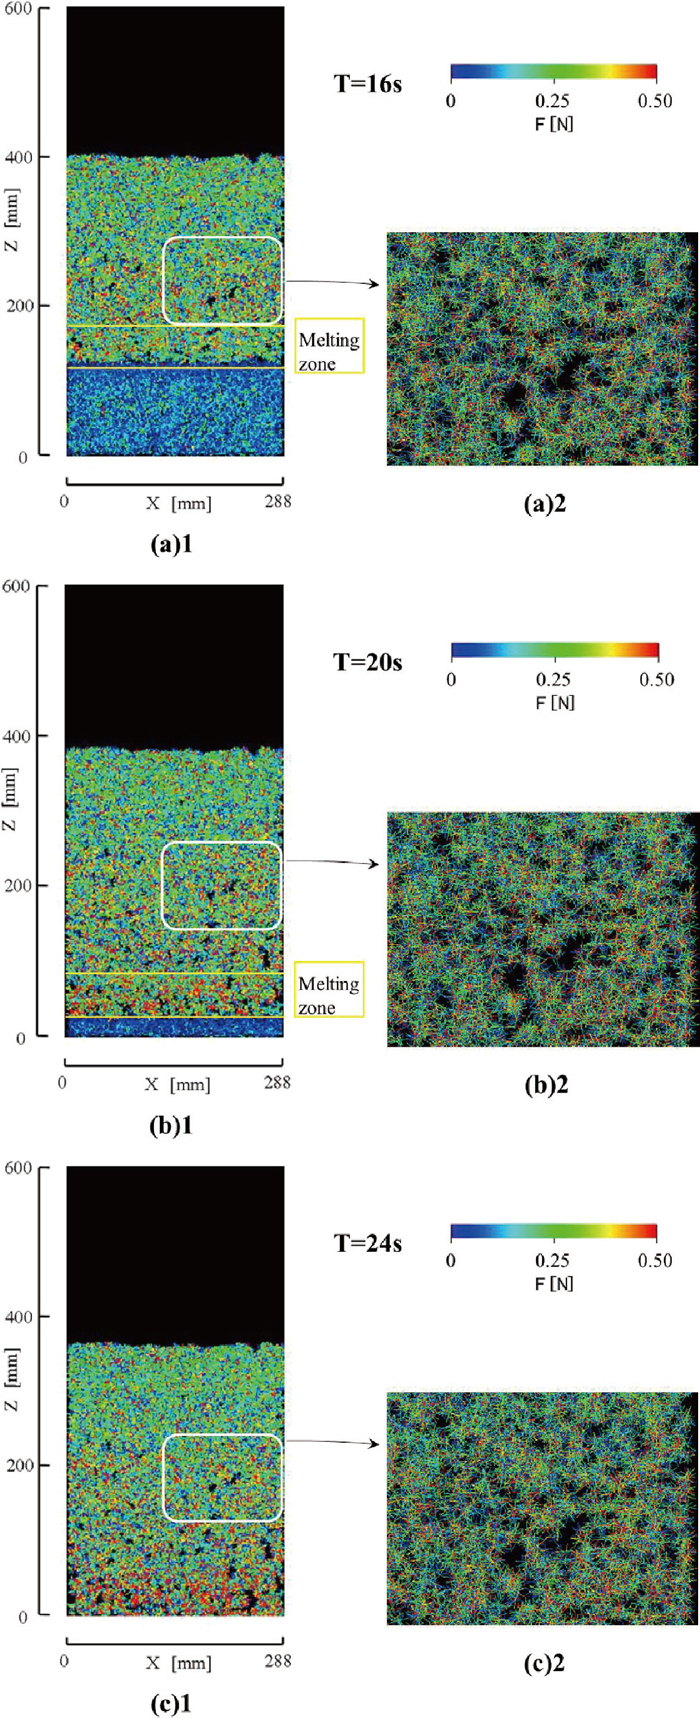
Figure 11 shows the calculated color iso-contour of contact force at contact point of particle in the sintering bed for 88% of particle volume melted in the melting zone. Figure 11(a) shows the color iso-contour at T = 16 s after the sintering process started. Figure 11(a)1 indicates that the large contact force appears in the melting and the fixation zones. However the distributions of the contact forces including the large contact force are homogeneous. Figure 11(a)2 indicates that the voids appear in the whole area and the void would be generated by the large contact force. Figures 11(b), and 11(c) at T = 20 s and 24 s, respectively, show the time evolution of iso-contour of contact force. The figures indicate that the contact force becomes large, but the void does not grow. The large melted liquid among particles for 88% of particle volume melted hinders to agglomerate particles. Figure 11(c) at T = 24 shows the final form of the color iso-contour of contact force at contact points of particles in the sintering bed. The distribution of void is nearly homogeneous.
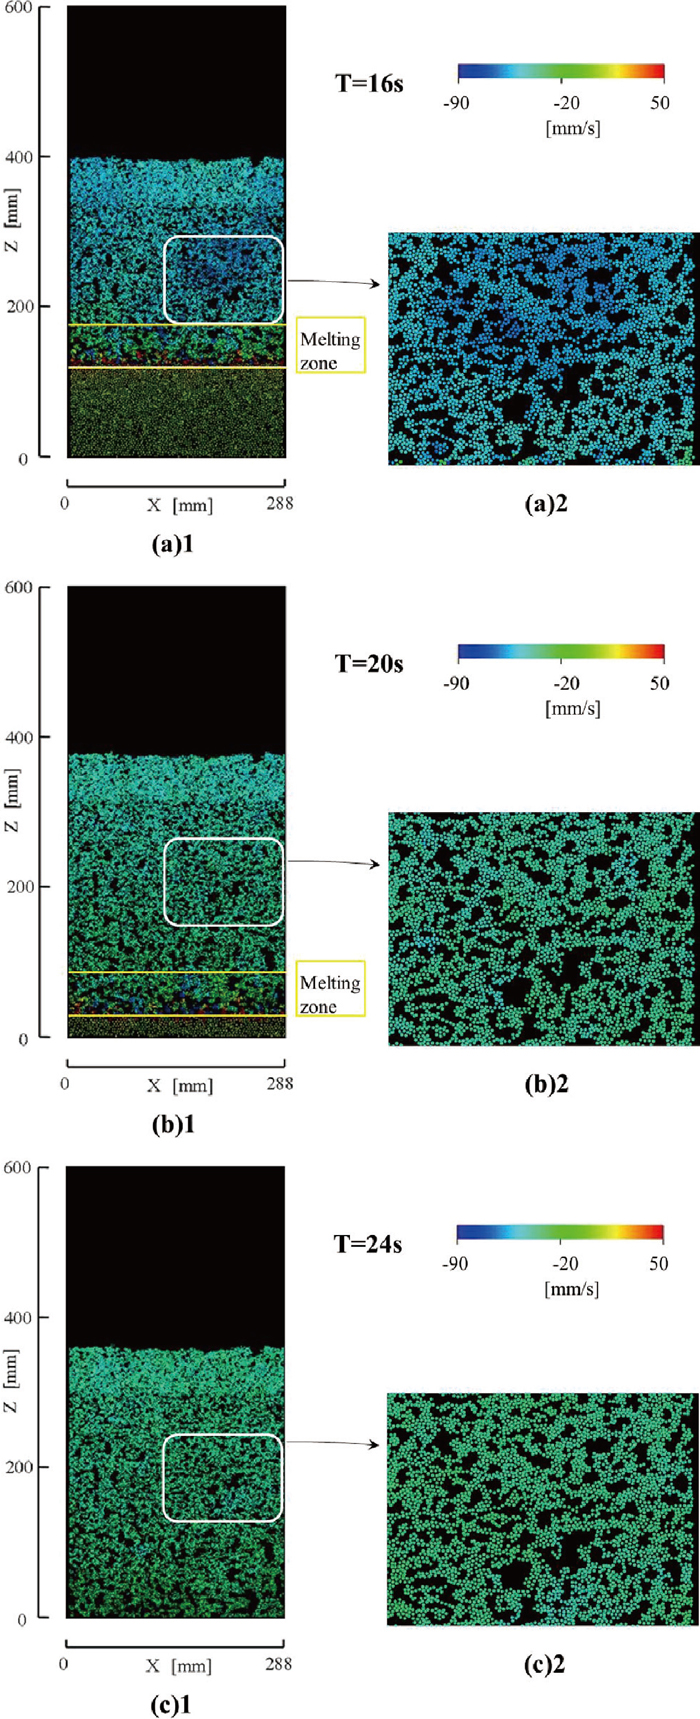
Figures 12(a), 12(b), and 12(c) show the calculated particle locations and color iso-contours of particle vertical velocity in the sintering bed for 88% of particle volume melted in the melting zone at various times after the sintering process started. Particles of which diameter reduced to 0.493 times of the initial diameter by melting the particle surface existing in the central cross sectional area (y = 6 mm) are plotted in these figures. The particle configurations in these figures indicate agglomerates in which the particles directly contact and also indicate particles which are not agglomerated. There are many agglomerates in the fixation zone. These figures indicate that the agglomerates do not grow and the distribution of agglomerate is nearly homogeneous. The agglomerates do not break to a large scale crack in the whole fixation zone. Figures 12(a), 12(b), and 12(c) show the time evolution of the void and the particle vertical velocity in the sintering bed at T = 16 s, 20 s and 24 s, respectively, after the sintering process started. The figures indicate that the remarkable velocity difference among agglomerates does not exist in the fixation zone. The velocity difference slightly appears in the melting zone and does not exist below the melting zone. The large melted liquid among particles for 88% of particle volume melted produces the homogeneous particle distribution and obstructs to grow the particle velocity difference. Thus the large scale crack is not generated. Figure 12(c) at T = 24 shows the final form of the color iso-contour of vertical velocity in the sintering bed. This figure indicates the nearly homogeneous sintering bed in which particles distribute uniformly.
4. Conclusion
The motions of the particles and the air in the nearly full scale sintering bed were simulated by the simultaneous calculation of the Lagrangian DEM equations and Navier-Stokes equations for the air based on the simple sintering model in which the phase change of particles, the cohesion forces due to the liquid film among particles, the contraction force acted on each contact point and the soft fixation process were considered. The sintering process for 88% of particle volume melted in the melting zone was also simulated. As the result the following concluding remarks were obtained.
(1) The contraction force by the shrinkage of particle and the cohesion force by the liquid film produced the agglomerate of particles and grew the voids. Through the fixation zone the cracks (voids) further grow and merge to a large scale crack.
(2) The locations where the large scale cracks appeared in the sintering bed with contraction forces were different with that of the large scale cracks without the contraction force. This indicates that the contraction force is one of the main formation mechanisms of the large scale crack.
(3) The decrease of mobility of particle motion by the fixation process in the fixation zone generated the locally large contact force which was about 250 times larger than the usual cohesion force between particles in the agglomerate and the large velocity difference between agglomerates. Those broke down the agglomerate particle.
(4) The large cohesion force produces the large agglomerate. The destruction of large agglomerate generates and enlarges the crack. Therefore the cohesion force between particles is also one of the main formation mechanisms of the large scale crack.
(5) In the case that the liquid volume produced by melting was large such as 88% of particle volume, the particle moves in the large liquid volume melted and the void is produced. However these voids do not grow to the large scale void (crack) because the distance among particles is long in the large liquid area which was produced by melting of 88% of particle volume. The agglomeration of particles for 88% of particle volume melted is not so fast that the sintering bed in which the particles uniformly distributed is formed. The ore particle in which the large volume is melted such as 88% of ore volume would be used to produce the homogeneous sintering bed in which the particle uniformly distributed. Since the large agglomerate and the large void (crack) were not formed in the large liquid area of the bed, the homogeneous configuration of particles was produced and the height of the sintering particle bed became lower than that for 50% of particles volume melted.
Nomenclature
A: constant in the cohesion force by Eq. (10) (–)
Dij, Fij, FCij and FNij: damping, contact, cohesion and contraction force vectors at contact point of particle i and j (N)
D: width of computational domain (m)
Dp: particle diameter (m)
d: solid particle diameter of iron ore in melting zone (m)
FC: cohesion force due to liquid bridge between two particles in melting zone (N)
FR: drag force acting on approaching particles with liquid film in melting zone (N)
FDi, Fgi, FLi, FNi and FRi: drag force vector, gravitational force vector, lift force vector, resultant contraction force vector and resultant force vector of FR acting on particle i, respectively (N)
Ip and mp: particle inertia moment (kgm2) and mass (kg)
L: distance between two particle surfaces (m)
Mij and MDij: moment vectors due to contact and damping forces, respectively, at contact point of particle i and j (Nm)
MFi: fluid friction torque vector acting on particle i (Nm)
N: number of particles per unit volume (m–3)
n: term number of series solution of β (–)
P and p: static pressure and its nondimensional form (Pa) (=P/(ρU02)) (–)
R1: dimension of liquid bridge (=[d(1–cosα)+L]/[2cos(α+θ)]) (m)
R2: dimension of liquid bridge (=(d/2)sinα+R1[sin (α+θ)–1]) (m)
Re and Rep: Reynolds number (=DU0ρ/μ) (–) and particle Reynolds number (=Dp|U–Up|ρ/μ) (–)
St: nondimensional interaction term vector due to fluid drag force defined by Eqs. (3) and (4) (–)
StL: nondimensional interaction term vector due to fluid lift force (–)
T and t: time (s) and its nondimensional form (=TU0/D) (–)
U and u: gas velocity vector (ms–1) and its nondimensional form (=(1/U0)U) (–)
Up and up: particle velocity vector (ms–1) and its nondimensional form (=(1/U0)Up) (–)
U0: superficial suction gas velocity (ms–1)
upn: normal relative velocity between particles (ms–1)
X, Y, Z: Cartesian coordinates (m)
Greek letters
α, θ: contact angles of liquid bridge between particles (rad)
β: correction factor of drag force acting on approaching particles with liquid film (–)
ε: void fraction (–)
ϕ: parameter of correction function β (–)
γ: surface tension of liquid film (N/m)
μ and μl: gas (air) and liquid viscosity (Pa s)
ξ(ε): correction factors of drag and lift forces in multi-particle system (–)
ρ: gas density (kgm–3)
Ωp: particle angular velocity vector (rads–1)
∇: nabla operator (–)
•: scalar product (–)
Subscript
i, j: particle number
p: particle
References
- 1) M. V. Ramos, E. Kasai, J. Kano and T. Nakamura: ISIJ Int., 40 (2000), 448.
- 2) H. Yamaoka and T. Kawaguchi: ISIJ Int., 45 (2005), 522.
- 3) T. Aizawa and Y. Suwa: ISIJ Int., 45 (2005), 587.
- 4) T. Umekage and S. Yuu: ISIJ Int., 49 (2009), 693.
- 5) S. Yuu and T. Umekage: ISIJ Int., 52 (2012), 1785.
- 6) L. Schiller and A. Naumann: Z. Ver. Dtsch. Ing., 77 (1933), 318.
- 7) T. Umekage and S. Yuu: Trans. Jpn. Soc. Mech. Eng. Ser. B, 65 (1999), 1392.
- 8) S. Yuu, T. Umekage and T. Miyahara: ISIJ Int., 45 (2005), 1406.
- 9) F. H. Harlow and J. E. Welch: Phys. Fluids, 8 (1965), 2182.
- 10) P. A. Cundall and O. D. L. Strack: Geotechnique, 29 (1979), 47.
- 11) T. Umekage, S. Yuu, T. Shinkai and T. Abe: Adv. Powder Technol., 9 (1998), 331.
- 12) Soc. Powder Technol. Jpn., Ed.: Powder Technology Handbook, 2nd ed., Nikkan Kogyo Shimbun, Tokyo, (1998), 174.
- 13) J. Happel and H. Brenner: Low Reynolds Number Hydrodynamics, Noordhoff International Publishing, Leyden, Netherland, (1973), 235.
- 14) S. Kasama: Private Communication, (2005).