Regular Article
Microstructure of Martensite in Fe–C–Cr and its Implications for Modelling of Carbide Precipitation during Tempering
2014 年 54 巻 11 号 p. 2649-2656
詳細
2014 年 54 巻 11 号 p. 2649-2656
The microstructure of as-quenched martensite in four Fe–C–Cr alloys (0.15C-1Cr, 0.15C-4Cr, 1C-1Cr, 1C-4Cr, mass%) has been investigated. Moreover, the microstructures served as input for setting up modeling of carbide precipitation during tempering of martensite. The modelling was conducted using the Langer-Schwartz approach and the software TC-PRISMA, which retrieves thermodynamic data from the Thermo-Calc databank. It was found that the martensite in the low carbon steels is predominantly lath martensite with units arranged parallel to each other. On the other hand, the plate martensite dominates the microstructure in the high carbon steels. The ratio of high-angle to low-angle grain boundaries was found to increase with increasing Cr in the low carbon steels, which indicates that Cr has a similar effect as C on the lath martensite microstructure, however, the micro-hardness remained unaffected by the addition of Cr. Finally, the precipitation modeling clearly demonstrates the importance of proper definition of the initial microstructure for predictive modelling. Parameters such as dislocation density and frequency of high-angle grain boundaries have a drastic effect on e.g. the mean size of carbides.
Martensite and tempered martensite are important constituents in modern high-performance steels used in applications such as e.g. tooling, wear-parts and structural components. The martensite can have different morphologies, i.e. lath, butterfly, lenticular and thin-plate;1,2,3) and there are several underlying factors that govern the structure of the martensite.1,2,3,4,5,6) Clearly, these factors are associated with the chemical composition of the alloys and a vast amount of literature is available on the relation between alloy composition and martensite microstructure.7,8,9,10,11,12,13,14,15,16,17,18)
Since Fe–C is the basis for the carbon steels, the effect of carbon has been studied frequently.1,2,3,5,7,8,9,10,13,14,15,16,17) For instance, Kelly and Nutting found that the martensite morphology changes from needle-like lath martensite to plate martensite when the carbon content is increased from 0.1 to 1.4 mass%.5) A similar result was obtained by Umemoto et al. who studied Fe–C with carbon contents from 0.60 to 2.07 mass%.8) Both of them also reported that the fine structure of lath and plate martensite vary with carbon content. Furuhara et al. showed that, as the carbon content increase from 0.0026 to 0.61 mass%, a block containing two groups of laths which are of two Kurdjumov-Sachs (K-S) orientation variants would change to a block consisting of laths of a single K-S variant.15) The packet and block size was also refined and the dislocation density increased with increasing carbon content. To study the above characteristics for a larger range of carbon contents in Fe–C alloys, Stormvinter et al. systematically investigated the effect of carbon content on the microstructure of martensite. They covered almost the full range of carbon contents in carbon steels and the investigations were performed on both carbon gradient samples16) and alloys with distinct chemical compositions.9,10)
Thus, the role of carbon on the microstructure of martensite in Fe–C alloys is well investigated. However, to the present authors’ knowledge, the martensite microstructure in the Fe–C–Cr system, which is the basis for hot-work tool steels, has only been studied once previously.8) That study was conducted using mainly light optical microscopy (OM) and thus no detailed study of martensite in the Fe–C–Cr system is available. In addition to the strong relation between martensite microstructure and mechanical properties such as strength and fatigue life,3,18,19) the structure is also important for the precipitation kinetics during tempering or service at elevated temperatures. The defect type and densities, domain size (e.g. packets, blocks, plates) etc. are key factors for predictive modelling of precipitation during tempering.20,21,22) The preferred nucleation at sites such as dislocations, twins, low and high angle grain boundaries, coincidence site lattice (CSL) boundaries, etc. must be understood for specific alloy systems in order to setup accurate modelling schemes.
The present work is part of a larger effort to enable predictive quantitative modelling of carbide precipitation during tempering of martensite, and in this first report we aim at presenting the as-quenched martensitic microstructures in four Fe–C–Cr model alloys, which is vital input for the further precipitation modelling. Moreover, the microstructures found are related to thermodynamics-based modelling of carbide precipitation during tempering of martensite to demonstrate the importance of profound understanding of the initial microstructure for predictive modelling.
The alloys used in the present study were prepared by vacuum induction melting, hot rolling and homogenization and their chemical compositions are listed in Table 1. The Ms temperature was calculated using the model proposed by Stormvinter et al.,23) and the Ms temperatures of the alloys are included in Table 1. 10 × 10 × 1 mm3 specimens were cut using a precision cutting machine Struers Accutom-5. The specimens were subsequently austenitized for 10 min at 1100°C in argon atmosphere, before quenching in brine.
| Alloys | C | Cr | Si | Mn | S | Al | Cu | Ni | Fe | Ms [°C] |
|---|---|---|---|---|---|---|---|---|---|---|
| A | 0.14 | 0.98 | 0.02 | 0.07 | 0.06 | 0.01 | 0.011 | 0.017 | Bal. | 465 |
| B | 0.16 | 4.05 | 0.02 | 0.08 | 0.05 | 0.02 | 0.009 | 0.015 | Bal. | 408 |
| C | 0.95 | 1.06 | 0.02 | 0.07 | 0.09 | 0.03 | 0.011 | 0.017 | Bal. | 190 |
| D | 0.88 | 4.12 | 0.02 | 0.08 | 0.05 | 0.02 | 0.005 | 0.012 | Bal. | 136 |
Prior to OM, the specimens were cold mounted, ground, polished and etched by either 2 or 4 vol.-% Nital due to the alloys different resistance towards etching. The OM was conducted using an LEICA DMRM microscope.
The microstructures were further analyzed using a scanning electron microscope (SEM) LEO 1530 equipped with electron backscatter diffraction (EBSD). The final preparation of EBSD samples were performed by oxide polishing for 10 min to remove the damaged layer caused by the prior mechanical polishing and thus to get higher indexing during EBSD. The EBSD analysis was performed using the Oxford AZtech system and using an acceleration voltage and step size of 20 kV and 0.2 μm, respectively.
Samples to be used in the transmission electron microscope (TEM) were polished to about 40 to 50 μm thickness and then 3 mm diameter discs were punched. The discs were subsequently electro-polished using a twin-jet electropolishing equipment (Struers TenuPol-5). For the low carbon alloys, the electropolishing was performed at –15 to –25°C, using a voltage of 20 to 30 V, and an electrolyte consisting of 9 vol.-% perchloric acid and 91 vol.-% ethanol. For the high carbon alloys, the corresponding parameters were 10 to 20°C, 30 V and the electrolyte was 5 vol.-% perchloric acid, 15 vol.-% glycerol, and 80 vol.-% methanol. The TEM was performed at 200 kV in a JEOL JEM-2100F.
Micro-hardness measurements were performed on mirror finish surfaces before etching of the samples. A Leitz miniload hardness indentor and a load of 100 g were used. Six indents per sample were taken.
The modelling was conducted using the software TC-PRISMA24) which is a general computational tool for simulating diffusion-controlled multi-particle precipitation processes in multi-component and multi-phase systems. The software is based on the theory by Langer and Schwartz20) and it uses the Kampmann Wagner numerical (KWN) method.25) In order to simulate concurrent nucleation, growth and coarsening the software includes an extension to the classical nucleation theory for multi-component systems. For particle growth, the model by Chen, Jeppsson and Ågren (CJA)26) is implemented.
In the CJA model the velocity of a moving phase interface in multicomponent systems is calculated by identifying the operating tie line from the solution of flux balance equations. The velocity of the interface υ can be obtained together with the interface concentrations by numerically solving 2n-1 equation, comprising the flux balance equations for n-1 independent component and the local equilibrium conditions for all n components:
| (1) |
| (2) |
Where
Combining Eqs. (1) and (2), the velocity is given by:
| (3) |
To simulate the growth process in the present work, the simplified model in TC-PRISMA was used. The simplified model avoids the difficulty of finding the operating tie-line at each moment and instead uses the initially calculated tie-line. The nucleation process involves the effect of interfacial energy and, in the case of heterogeneous nucleation, the effect of microstructural features such as boundaries (including grain, packet and block boundaries), triple junctions, etc. as well as dislocation density. Furthermore, growth and coarsening is highly influenced by the interfacial energy. In order to isolate the effect of microstructure and to keep thermodynamic properties constant it was decided to perform all the modeling for alloy D. The microstructural data needed as input for the simulations in TC-PRISMA were taken from the characterization of alloy D and from the literature, and moreover, input data were varied in these corresponding ranges. The modelling results are discussed in relation to the microstructural observations for all alloys.
The stable carbide at the temperature of investigation, i.e. 700°C, is M7C3. It was however found that also the metastable M23C6 will precipitate and thus both types of particles were included in the simulations of tempering at 700°C for 1000 h. The matrix phase is treated as a supersaturated ferrite (BCC).
The interfacial energy was estimated by an extension to Becker’s model27,28) as implemented in the TC-PRISMA software.
| (4) |
The dislocation densities were chosen to be in the range of 1.0 × 10¹⁴ to 1.8 × 10¹⁵ m–2, which has been determined for martensite with similar microstructures and chemical compositions.1) Heterogeneous nucleation at dislocations or at grain boundaries was simulated and the effective grain size, which could include parent grains, packets and blocks, was varied in the range from 5 to 200 μm.
The as-quenched microstructures of the four alloys are shown in Figs. 1(a)–1(d). The parent austenite grain size was estimated to 40, 65, 62 and 54 μm for alloys A, B, C and D, respectively. It can be seen that in the low-carbon alloys A and B, the main structure is lath martensite, see Figs. 1(a) and 1(b). On the other hand, in both the high-carbon alloys C and D, plate martensite is dominating the structure, see Figs. 1(c) and 1(d). The high-carbon alloys display micro-cracking and there are irregularities of the plates. In these two high-carbon alloys it is difficult to identify the characteristics of the martensite in the dark areas around the plates, and hence this is further characterized using TEM and EBSD.
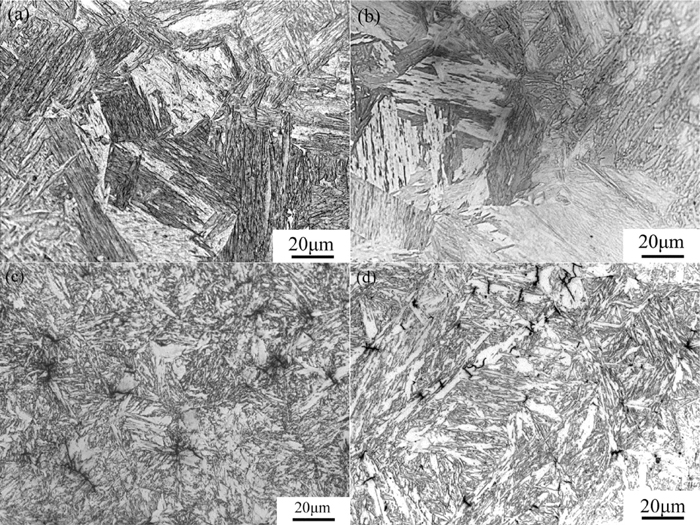
Optical micrographs of the as-quenched alloys (a) alloy A, (b) alloy B, (c) alloy C and (d) alloy D.
Figure 2 shows the hardness of the four alloys, and data of Fe–C–X alloys from previous works is incorporated in the same figure for comparison. The hardness increases with increasing carbon content. In the low-carbon steels, the change of micro-hardness is not significant when Cr increases from 1 to 4 mass%, though there is a clear change of microstructure which will be further discussed. For the high-carbon steels the highest hardness is found in alloy C. The reason is most probably the slightly higher carbon content as compared to alloy D.

Hardness of the investigated alloys in comparison with literature data for Fe–C and Fe–C–X alloys. (Online version in color.)
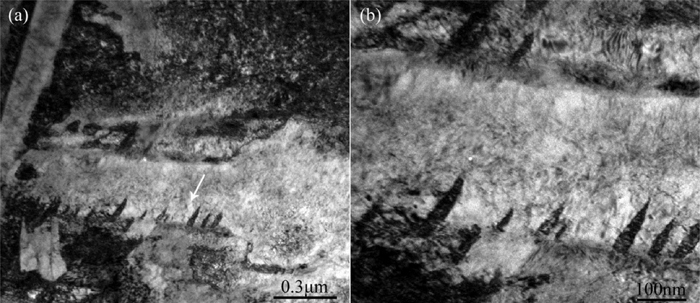
Figures 3 and 4 show the TEM micrographs from alloys A and B, respectively. It is evident that the lath martensite, as shown in Figs. 3(a) and 4(a), are dominant in both alloys, confirming the OM observation. A rather dense dislocation structure is seen in both low-carbon alloys and the laths arrange parallel, or with a small misorientation to each other. Some planar defects, most likely twins, are also observed in both low-carbon alloys, as shown in Figs. 3(b) and 4(b). When increasing the Cr from 1.0 to 4.0 mass%, the planar defect structure becomes coarser. In addition, the defects do not extend across the whole width of the martensite unit, but this could also be due to a rotation of the units making them invisible under the applied diffraction condition.

Transmission electron micrographs of alloy A. (a) Lath-shaped martensite; (b) magnification of the region marked with an arrow in (a). LM = lath-shaped martensite.
Transmission electron micrographs of alloy B. (a) martensite with different direction and width; (b) magnification of the region marked with an arrow in (a).
Figures 5 and 6 show the TEM micrographs of alloy C and alloy D, respectively. It can be seen that the most distinct feature of the high-carbon alloys is the plate martensite with frequent internal planar defects, see Figs. 5(a), 5(b) and 6(a), 6(c) and 6(d). A small fraction of lath martensite is, however, embedded within the characteristic plate structure, see Fig. 5(b). Moreover, when increasing the Cr content from 1.0 to 4.0 mass%, the density of internal-defects becomes lower and they coarsen, see Figs. 5(b) and 6(d).

Transmission electron micrographs of alloy C. (a) martensite with planar defects (b) martensite with and without visible planar defects.
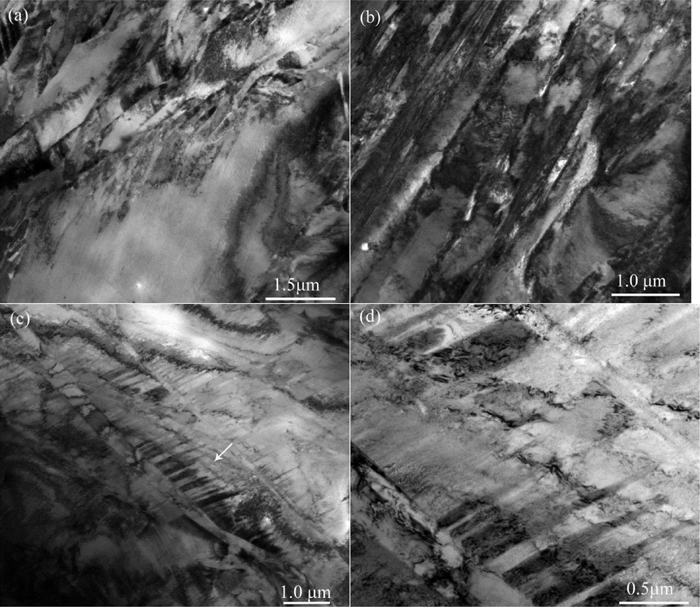
Transmission electron micrographs of alloy D. (a) Coarse martensite units; (b) small martensite; (c) martensite with planar defects; (d) magnification of planar defect in (c).
Figures 7(a)–7(d) shows inverse pole figure (IPF) colored images from EBSD for the four Fe–C–Cr alloys. Figures 7(a) and 7(b) for the low-carbon alloys show a “classical” lath martensite structure where the prior austenite grain is subdivided into packets and blocks. When increasing the Cr from 1.0 to 4.0 mass%, the crystallographic units become refined.

Inverse pole figure colored EBSD maps taken from the four as-quenched alloys. (a) alloy A; (b) alloy B; (c) alloy C; (d) alloy D. (Online version in color.)
Figures 7(c) and 7(d) show the high-carbon alloys and both show plate-like and mixed martensitic microstructures. In alloy C, some parallel units are found and it resembles the packet structure of martensite in the low-carbon alloys.
Figure 8 shows the distribution of boundary misorientations using a logarithmic scale. The most frequent boundary types in the low-carbon alloys are either in the ranges of 0 to 20°, here called low angle grain boundaries (LAGB); or in the range of 50 to 60°, here called high angle grain boundaries (HAGB). When comparing alloy A and B the fraction of HAGB increases from 13.9% to 19.1% while the fraction of LAGB decreases from 85.0% to 80.1%. The fine packet structures in alloy B may be the reason of higher frequency of HAGB. In addition to the boundaries described, a hump in the figure near 17° can also be found, especially when the Cr content is increased to 4 mass%.

Grain boundary misorientation distribution in the as-quenched alloys.
In the two high-carbon alloys, the frequency of HAGB is about 30% higher than in the low carbon alloys. The frequency of LAGB and HAGB grain boundaries when comparing between the high carbon alloys is almost identical. Furthermore, the peak near 17°, which was found for the alloy B, is more pronounced in both the high-carbon alloys.
4.3. Precipitation ModellingFigure 9 shows the evolution of the mean radius of M7C3 and M23C6 carbides during tempering of alloy D for 1000 h at 700°C. The effect of the dislocation densities, assuming nucleation at dislocations, on the mean radius of both M7C3 and M23C6 is presented in Figs. 9(a) and 9(b). The mean radius of both particles decreases as the dislocation density (Dd) increase, i.e. the mean radius of M7C3 decrease from 197 to 103 nm and that of M23C6 decrease from 21 to 15 nm when the Dd increases from 1.0 × 10¹⁴ to 1.8 × 10¹⁵ m–2. Figures 9(c) and 9(d) shows the evolution of M7C3 and M23C6 when the assumed nucleation sites are instead high-angle boundaries and when the size of the units vary from 5 to 200 μm.
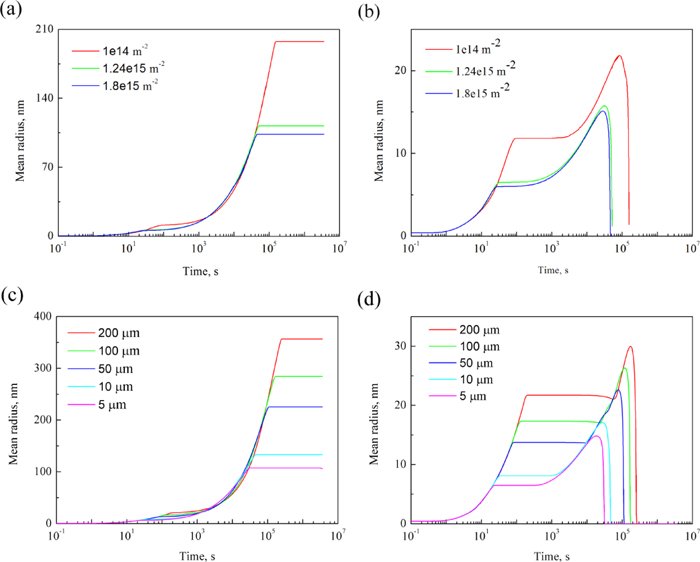
The evolution of the mean radius of M7C3 and M23C6 during simulations of tempering of alloy D at 700°C; assuming preferred nucleation at dislocations and with varying dislocation density for (a) M7C3 and (b) M23C6; assuming high-angle boundaries as preferred nucleation sites and a varying frequency of such boundaries for (c) M7C3 and (d) M23C6. (Online version in color.)
The martensite microstructure observed in the four Fe–C–Cr alloys can clearly be related to the governing factors of the martensitic microstructures mentioned in the introduction. However, let us start with the analogy between Fe–C–Cr and the microstructure of martensite in Fe–C, which has been frequently investigated in the past.1,2,3,5,7,8,9,10,13,14,15,16,17) The microstructure of alloy B, which has a finer structure with regard to HAGB than alloy A, can be compared with an alloy of intermediate carbon content, e.g. 0.345 mass% C in Fe–C alloy.9) Alloy D in the present work has similarities with the microstructure of martensite in an Fe–C alloy with 1.06 mass%C.9) This analogy with Fe–C indicates that Cr has a rather large effect on the microstructure of martensite and it seems like the addition of Cr gives a similar change of microstructure as would an increase of C. Similar results was also found in Ref. 8) for Fe–C–Cr.
To find the governing factor behind this change of microstructure it seems natural to start with looking at the Ms temperature. Calculations of the Ms temperatures using the model proposed by Stormvinter et al., and the literature data on Ms, indicates that the Ms temperature of alloy B and alloy D are very close to that of Fe-0.345C and Fe-1.06C.9) With the Ms temperature decrease the martensite microstructure is changed from lath martensite to plate martensite. This is clear both from the present work and also from the literature. The internal planar defect, presumably the twinned structure, was also found to increase with the lowering of the Ms temperature by the increasing C and Cr alloying. It is well-known that the type of martensite in Fe-based alloys depends on the preferred deformation mode, i.e. slip or twinning, to accommodate the large strains due to the martensitic transformation. Twinning is the preferred deformation mode at low temperatures, and slip dominates at high temperatures,8,13) with a certain cross-over temperature where the lath martensite changes into plate martensite e.g. as assumed in the model by Stormvinter et al. Though, this is clearly a simplification and it is well-known that there is a gradual change from lath to plate martensite. From a fundamental point of view the critical resolved shear stress (CRSS) for slip and twinning at the transformation temperature should determine the preferred type of plastic accommodation. It is known that at low temperatures, the CRSS for slip may be higher than that for twinning, and twinning is thus preferred. It has also previously been reported that Cr, C and Mn strongly increases the twinning tendency.31)
The Ms temperature will also affect the strength of the austenite with higher hardness at lower Ms. This means that self-accommodation should take place more frequently at lower Ms10,31) and this is also what is seen in the present work with more frequent HAGB when the Cr content is increased and thus the Ms temperature is decreased.
5.2. Implications of Martensitic Microstructures on Carbide Precipitation ModellingIt is clear from the present work that the initial martensitic microstructure is very important for the further modelling of precipitation during tempering. As seen in Fig. 9 the dislocation density of the martensite and the number of high-angle boundaries will make a significant difference in the evolution in carbide size. Both these factors are clearly very important in the heterogeneous nucleation step and in order to enable predictive modeling of tempering of martensite it is necessary to have profound understanding of the initial microstructure. One major challenge that needs to be considered carefully in the precipitation modeling is the dislocation density. It is seen in the present work that the change of dislocation density by one order of magnitude, which is a commonly encountered difference in dislocation density for martensite in Fe–C or Fe–C–Cr, changes the precipitation evolution dramatically. The dislocation density is known to increase with carbon content until the twinning is seen more frequently in the structure.1)
Clearly there are also other microstructural factors that must be considered for the modelling and further investigations must be performed in order to reveal the preferred nucleation sites in different alloy systems. In addition, it will be necessary to assess the different types of interfaces between particle and matrix in order to represent the interfacial energies accurately. For example, when estimating the interfacial energy with Eq. (4) its anisotropy and influence of misfit strain is not accounted for. For this purpose, there are in addition to the thermodynamics-based model used in the present work also significant activity to estimate interface energies from first-principles and also detailed investigations of interface structures are being conducted using lattice fringe images in TEM. These aspects will be dealt with more in future reports.
(1) The dominant martensitic microstructure in Fe-0.15C-(1-4)Cr alloys is lath martensite. An increasing Cr content from 1.0 to 4.0 mass%, however, refines the martensitic microstructure with more frequent high-angle boundaries and the frequency of planar defects, presumably twins, increases.
(2) The role of Cr on the martensitic microstructure resembles the effect of C and this is related to the changes of the Ms temperature, which is lowered by both alloying elements. However, the effect of Cr on the hardness of the martensite is not significant and clearly this is very different from the effect of C on hardness.
(3) Assuming heterogeneous nucleation at dislocations or high-angle boundaries, the simulations using TC-PRISMA demonstrate the significant importance of considering the initial martensitic microstructure for predictive modeling of carbide precipitation during tempering.
The work was performed within the VINN Excellence Center Hero-m, financed by VINNOVA, the Swedish Governmental Agency for Innovation Systems, Swedish industry and KTH Royal Institute of Technology. The authors are grateful to Qing Chen at TCSAB for modeling support, and to Fredrik Lindberg and Niklas Pettersson at Swerea Kimab as well as Henrik Jespersson and Maria Kvarnström at Uddeholm Tooling for experimental assistance. Z.H. acknowledges the support from The China Scholarship Council (CSC) and National Natural Science Foundation of China (51174059, U1260204).