Abstract
The ductile fracture toughness of ferritic steel was assessed in terms of crack tip opening displacement (CTOD). The CTOD is composed of two parts: elastic and plastic. In the ductile fracture region, as compared to the elastic part, the fraction of the plastic part is dominant. The CTOD linearly increases with an increase in ferrite grain size, but grain coarsening simultaneously increases the possibility of cleavage fracture. As yield strength increases, the CTOD decreases due to the decreased plastic deformation ability.
1. Introduction
As we know, as temperature decreases from high temperature to cryogenic temperature, the body-centered-cubic (bcc) structure usually fails in three fracture modes in turn―completely ductile, ductile/brittle, and completely brittle. Ferrite grain has a bcc structure, and ferrite matrix steels exhibit the same behavior as a bcc structure.
Most research has focused mainly on the fracture behavior in the completely brittle and brittle/ductile region, and the effect of grain size on toughness has been widely investigated. The brittle fracture of a well-controlled bcc structure is a transgranular cleavage. Cottrell1) analyzed the critical fracture stress for transgranular cleavage using dislocation theory and found that the critical fracture stress is in proportion to d–1/2, where d is the average grain size. His conclusion indicates that the finer the grain, the higher the critical fracture stress, indicating that grain refinement can effectively inhibit cleavage fracture.
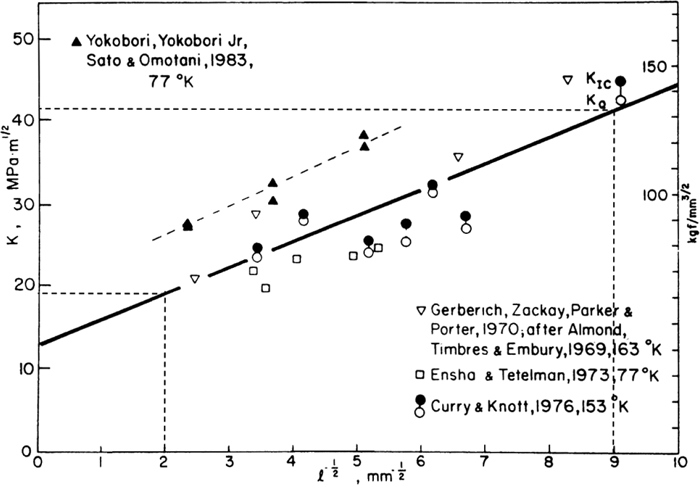
Armstrong2) investigated the correlation of fracture toughness (KQ or KIC) with ferrite grain size in the completely brittle fracture (cleavage) region based on an extensive database. He summarized the previous data on ferrite matrix steels in Fig. 1 (directly taken from Ref. 2)). K and
ℓ
represent fracture toughness and ferrite grain size, respectively. K linearly decreases with
ℓ
-1/2
in the following form:
where
K is in MPa
–1/2, and
ℓ
is in mm. When grain size reduces from
ℓ
-1/2
= 2 mm
–1/2 (250
μm) to
ℓ
-1/2
= 9 mm
–1/2 (12.3
μm), the fracture toughness
K will increase from about 19 MPa
–1/2 to about 41 MPa
–1/2. Although ferrite grain is refined by about 20 times (from 250
μm to 12.3
μm), the fracture toughness is only elevated by about 2 times (from about 19 MPa
–1/2 to about 41 MPa
–1/2). Apparently, the toughness improvement efficiency is not high in the completely brittle fracture region.
In the ductile/brittle fracture region, the ductile-brittle transition temperature (DBTT) is mostly used to reflect the toughness. A law similar to the Hall-Petch relation holds for ferritic steel, in which the DBTT is related to the ferrite grain size (d) as follows:3)
|
DBTT=
C
0
-
C
1
d
-1/2
| (2) |
where
C0 and
C1 are positive material constants. For conventional ferritic steels,
C1 is about 12°C/mm
–1/2. If ferrite grain size reduces from 40
μm to 2
μm, the DBTT decreases from about 0°C to about –220°C. When ferrite grains are further refined down to 1.3
μm, there will be no DBTT at the temperature of absolute zero for 0.10C ferritic steel,
i.e., a brittle fracture never occurs. These experimental results indicate that grain refinement is extremely effective for enhancing toughness in the ductile/brittle fracture region. Since the late 1990s, research on developing ultra-fine grained steels has becoming more active.
4,5,6,7) The ultra-fine grained ferrite (about 1
μm)/cementite steels exhibited low sensitivity to temperature and excellent fracture toughness (crack tip opening displacement).
7)
As compared to the brittle and ductile/brittle fracture modes, less attention was paid to the ductile fracture mode because it is usually regarded as being much safer than the two former fracture modes. With the progress of metallurgical technology, the occurrence of accidents caused by a completely brittle fracture in structural steels has been significantly reduced. Moreover, if an accident was unavoidable, failure is hoped in ductile fracture mode rather than in brittle mode. Therefore, the importance of ductile fractures should be reexamined. However, there is limited literature on the grain-size dependence of fracture toughness for ductile steels.
Klassen et al.8) measured the ductile fracture toughness (the fracture toughness in the ductile fracture regime) of six low alloy steels, in terms of JIC, whose microstructure was ferrite (matrix)/pearlite (second phase). The JIC varied with ferrite grain size as follows:
where
J0 and
D are material constants. The J
IC of Armco iron within the grain size range of 38–1050
μm also obeys
Eq. (3) or a more precise equation that has a parabolic relation with
d–1/2.
9)
The toughness of low-carbon ferrite/cementite steels (d= 0.9–9.6 μm)3) and ferrite/martensite steels (d=1.2–12.4 μm)10) was evaluated by the Charpy impact test. Their toughness in the ductile fracture regime was qualitatively assessed in terms of the upper shelf energy of the Charpy impact curve. It was found that decreasing ferrite grain size increases the upper shelf energy, i.e., enhancing the toughness in the ductile fracture regime, which is consistent with the tendency of toughness against ferrite grain size shown in Eq. (3).
Equations (1), (2), (3) demonstrate that the finer the ferrite grain, the higher the toughness of ferrite matrix steel in the three fracture modes. However, Qiu et al.11) physically analyzed the grain refinement-induced variation in fracture mode with stress-controlled and strain-controlled models. Their results showed that grain refinement elevates the toughness of ferritic steel only in the completely brittle or brittle/ductile fracture region. In the ductile fracture region, grain refinement is deleterious for improving toughness. This conclusion conflicts with Eq. (3).
The toughness improvement due to grain refinement has been confirmed by extensive experimental data on the completely brittle and brittle/ductile fracture. However, there is insufficient literature on the ferrite grain-size dependence of the toughness in the ductile fracture region. For this reason, the relationship between toughness and ferrite grain size in this region, e.g., Eq. (3), is not supported by convincing data and should be carefully reexamined.
Equation (3) was achieved using six ferrite/pearlite steels as follows:8) (1) the JIC of the six steels is plotted against the corresponding ferrite grain size (d), and (2) the data of JIC versus d are fitted to yield Eq. (3). If the six steels have the same volume fraction of pearlite (second phase), JIC is only the function of d, and Eq. (3) is valid in this case. However, the six steels have different volume fractions of pearlite (fp). Therefore, the JIC is the function of both d and fp. It is not rational to relate JIC only to d as in Eq. (3), because fp also affects JIC. If the fp of the six steels is plotted against the corresponding d, it is found that fp increases with an increase in d. In summary of the experimental data on JIC, d, and fp, it indicates that higher JIC corresponds to smaller d and lower fp, while smaller JIC corresponds to larger d and higher fp. As we know, pearlite is a brittle phase, and it can act as a void nucleation site. The increased pearlite volume fraction can enhance void nucleation, growth and coalescence, resulting early ductile fracture with smaller deformation. Therefore, the decreased JIC is more likely to be caused by the higher fp instead of the larger d.
As mentioned above, Refs. 3) and 10) show that ferrite grain coarsening reduces the upper shelf energy. However, Ref. 10) also had the same problem described above, i.e., the samples used have different volume fractions of the second phase (brittle phase: martensite). The decreased toughness in the ductile fracture regime was probably caused by the larger volume fraction of martensite. In Ref. 3), because the volume fraction of the second phase (cementite particles) essentially remained constant for all the samples, the toughness in the ductile fracture regime should only be related to the ferrite grain size; but the Charpy impact specimens, with respect to finer ferrite grains, did not completely break in the upper shelf region of the impact curve, i.e., in the ductile fracture region, while those having coarse ferrite grains completely broke. As a result, the area of the fractured cross section is different for the specimens with different ferrite grain sizes―the finer microstructure has a relatively smaller fractured cross section. In this case, the upper shelf energy cannot precisely reflect the difference in toughness between the finer and coarser microstructures. For this reason, the conclusion for the toughness in the ductile fracture regime in Ref. 3) is doubtable. We can say that the effect of ferrite grain size on the toughness in the ductile fracture region is not yet well understood.
In this study, low-alloy steels composed of ferrite/cementite particles were produced with different ferrite grain sizes but the same volume fraction of cementite particles. Fracture toughness tests were performed on these steels to evaluate the ductile fracture toughness. From the experimental results, the ferrite grain-size dependence of ductile fracture toughness was revealed.
2. Experimental
Three low-alloy steels with a microstructure of ferrite/cementite were produced. The chemical composition is given in Table 1. The average ferrite grain size is 0.9 μm for 0.10C and 0.16C steels and 0.46 μm for 0.45C steel. The rolling processes were described in detail elsewhere.3,12,13) The three as-rolled steels were used as parent steels. The parent steels were heat treated to obtain various samples with different ferrite grain sizes, as illustrated in Table 2.
Table 1. Chemical composition (in wt%).
| No. | C | Si | Mn | P | S | Al | N |
|---|
| 0.10C steel | 0.10 | 0.31 | 1.43 | 0.008 | <0.001 | 0.029 | 0.0008 |
| 0.16C steel | 0.16 | 0.30 | 1.45 | 0.009 | <0.001 | 0.030 | 0.0015 |
| 0.45C steel | 0.45 | 0.31 | 1.51 | 0.002 | 0.002 | 0.01 | |
Table 2. Sample preparation.
| No. | ferrite grain size (μm) | heat treatment |
|---|
| 0.10C steel | 0.9 | as-rolled |
| 4.6 | rapidly heating up to 817°C (at a heating rate of 197°C/s) + rapidly cooling (at a cooling rate of 30°C/s between 800°C and 500°C) |
| 6.2 | rapidly heating up to 910°C (at a heating rate of 197°C/s) + rapidly cooling (at a cooling rate of 30°C/s between 800°C and 500°C) + annealing (690°C, 4 h) |
| 9.6 | rapidly heating up to 1000°C (at a heating rate of 197°C/s) + rapidly cooling (at a cooling rate of 30°C/s between 800°C and 500°C) + annealing (690°C, 8 h) |
| 0.16C steel | 0.9 | as-rolled |
| 2.9 | rapidly heating up to 817°C (at a heating rate of 197°C/s) + rapidly cooling (at a cooling rate of 30°C/s between 800°C and 500°C) |
| 4.5 | rapidly heating up to 910°C (at a heating rate of 197°C/s) + rapidly cooling (at a cooling rate of 30°C/s between 800°C and 500°C) + annealing (690°C, 8 h) |
| 7.1 | rapidly heating up to 1000°C (at a heating rate of 197°C/s) + rapidly cooling (at a cooling rate of 30°C/s between 800°C and 500°C) + annealing (690°C, 8 h) |
| 0.45C steel | 0.46 | as-rolled |
| 0.60 | 750°C, 10 min + air cooling |
| 4.83* | 680°C, 24 h + air cooling |
Note: *, specimen failed in brittle fracture mode in the CTOD test
Specimens with a diameter of 5 mm and gage length of 10 mm were machined from the samples shown in Table 2. Tensile tests were performed on these specimens at room temperature and at a cross-head speed of 0.4 mm/min. The fracture strain of the tensile specimens, εf, is given by the equation
where
A0 and
Af are the areas of the initial and fractured cross sections, respectively.
Fatigue-precracked three-point-bend specimens (a0/W = about 0.5) with a size of 10 mm (B)×10 mm (W)×55 mm (L) were prepared. The fracture toughness is assessed in terms of crack tip opening displacement (CTOD) in this study. CTOD tests with a span-to-width ratio (S/W) of 4 were conducted on these three-point-bend specimens at a cross-head speed of 0.4 mm/min and at room temperature. CTOD was calculated by Eq. (5), proposed by ASTM E1290-99:14)
|
CTOD=
K
2
(1-
ν
2
)
2
σ
ys
E
+
r
p
(W-
a
0
)
r
p
(W-
a
0
)+
a
0
+z
V
p
| (5) |
where
K is the stress intensity factor,
Vp the plastic component of notch opening displacement,
W the effective width of the test specimen, and
a0 the average original crack length. In this paper, Poisson’s ratio
ν is taken as 0.3, Young’s modulus
E = 206000 MPa, plastic rotation factor
rp = 0.44, and distance of knife edge measurement point from front face on specimen
z = 0. Notch opening displacement was measured by a clip gage.
3. Results and Discussion
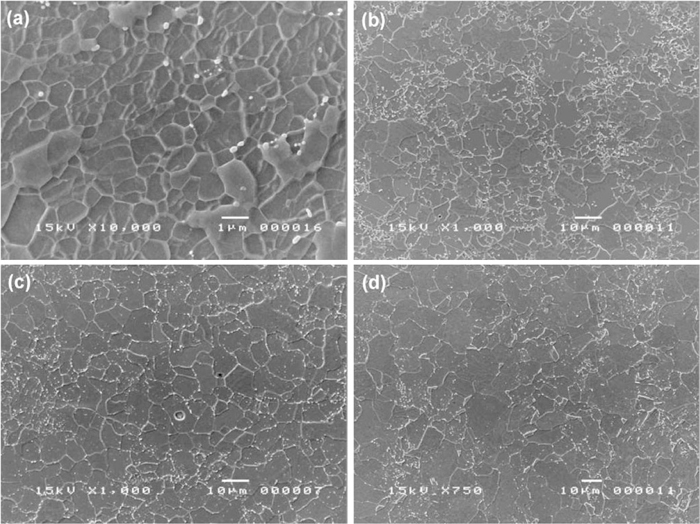
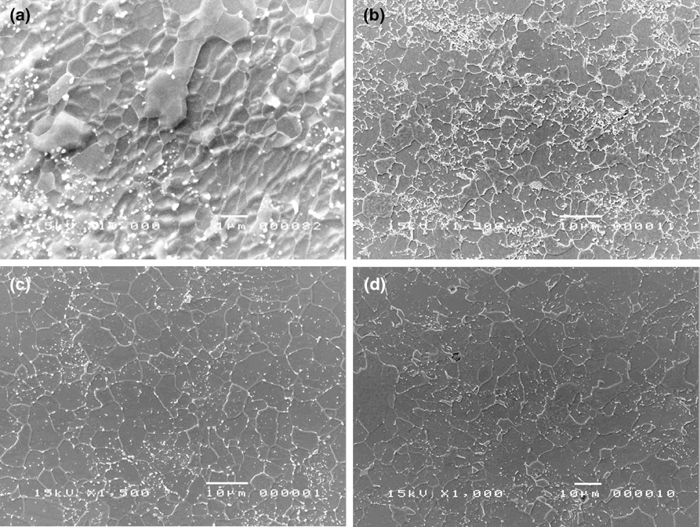
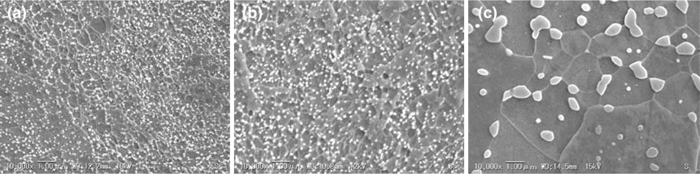
3.1. Microstructure
The 0.10C, 0.16C, and 0.45C steels are composed of ferrite and cementite particles. The microstructure of each steel with various ferrite grain sizes was observed by scanning electron microscopy, and these are shown in Figs. 2, 3, 4, respectively. For the samples with the same carbon content, we assume that they have the same equilibrium content of cementite particles. The volume fraction of cementite particles (fv) is given by:15)
|
f
v
=
1.946C
12.72+0.046C
| (6) |
where carbon content
C is in wt%. The
fv values of 0.10C, 0.16C, and 0.45C steels are 1.53%, 2.45%, and 6.87%, respectively.
3.2. Tensile Properties
The nominal stress versus nominal strain curves of 0.10C, 0.16C, and 0.45C steels are shown in Figs. 5(a)–5(c), respectively. Within the carbon content range of 0.10%–0.16% (cf. Figs. 5(a) and 5(b)), the shape of stress-strain curves of as-rolled steels (i.e., 0.9 μm steel) is quite different from the other steels with larger ferrite grain size. As-rolled steels have almost no work-hardening ability, and thus there is no work-hardening period in the stress-strain curve. The ferrite grain size of 0.45C as-rolled steel is 0.46 μm, much smaller than that of 0.10C and 0.16C steel (0.9 μm), but it has work-hardening ability, as shown in Fig. 5(c). This is attributed to the presence of a large amount of cementite particles because those cementite particles effectively enhance work-hardening ability.16) The relationship between work-hardening ability and ferrite grain size has been discussed in detail elsewhere.16)
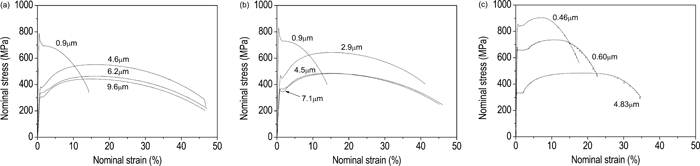
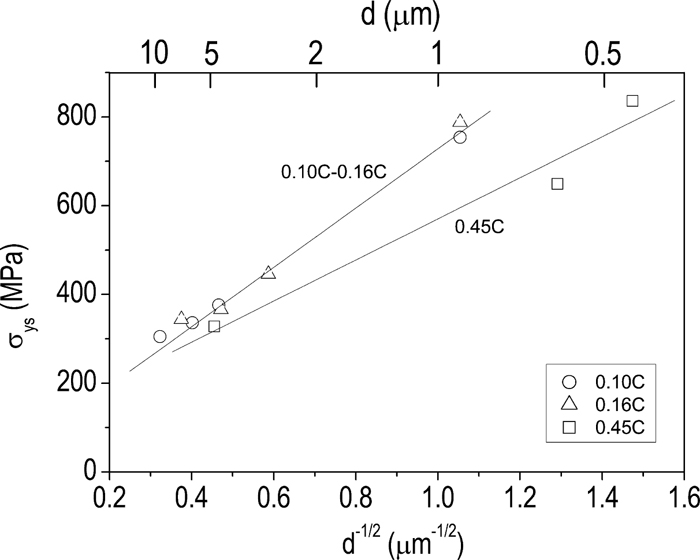
Figure 6 shows the dependence of yield strength on ferrite grain size. The Hall-Petch relation holds for the relationship between σys and d, i.e., the σys linearly varies with d–1/2. The experimental data of 0.10C and 0.16C steels with various ferrite grain sizes follow the same straight line, but 0.45C steel obeys another straight line because of the great difference in the volume fraction of cementite particles between it and the other two steels. Zhao et al. pointed out that cementite particles effectively increase the yield strength―the higher the volume fraction of cementite particles, the larger the yield strength.13) However, as illustrated in Fig. 6, 0.45C steel has a lower σys than the other steels, especially when grain size is small (the smallest grain size corresponds to the as-rolled steels), which conflicts with the general knowledge. The exact reason for it is unclear. The three steels were water quenched after the final rolling. The 0.10C and 0.16C steels were produced at the same time, but the 0.45C steel was produced in a different season. This could cause the cooling rate difference during the water quenching; as a result, the dislocation density was quite different in the as-rolled steels. Perhaps this is the reason for the extraordinary behavior of 0.45C steel.
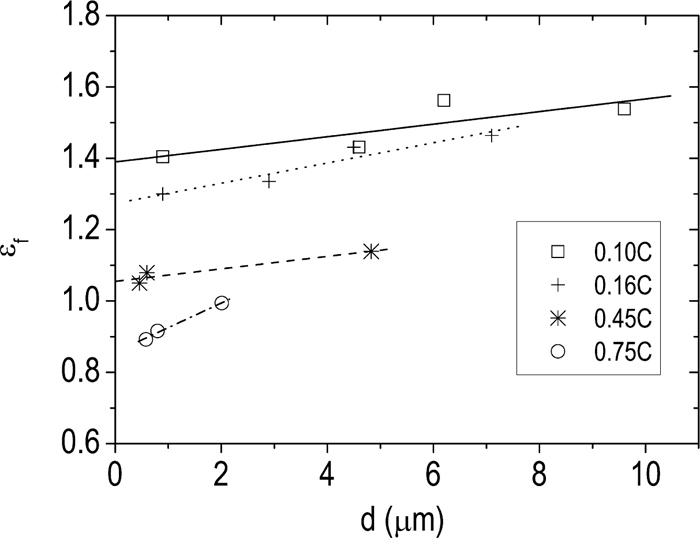
All the tensile specimens fractured in ductile fracture mode. Their ductile fracture strain (εf) is plotted against d in Fig. 7. In addition to the steels used, 0.75C steel with ferrite/cementite particles is also involved. As d increases, εf increases. Torizuka’s research17) supported the result of the present study.
3.3. Dependence of CTOD on Ferrite Grain Size
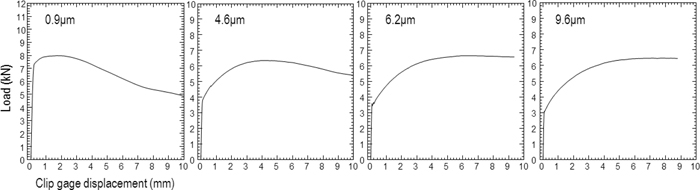
The load against clip gage displacement during CTOD tests was recorded. Figure 8 shows it for the specimens of 0.10C steel with ferrite grain size of 0.9 μm, 4.6 μm, 6.2 μm, and 9.6 μm. Load smoothly increases up to the maximum load level, and then smoothly decreases. This is a typical load-displacement curve for ductile fracture. As grain size increases, the plastic displacement with respect to the maximum load point increases, which demonstrates that grain coarsening enlarges deformation capacity. 0.16C and 0.45C steels also show a similar tendency.
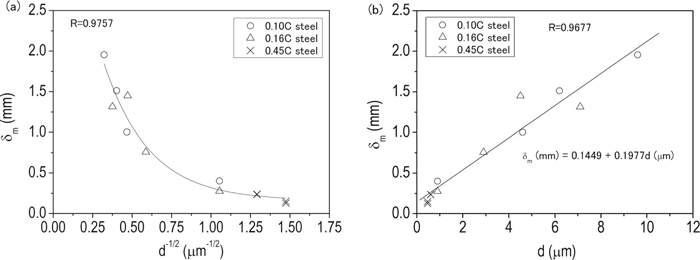
The CTOD with respect to the maximum load point, δ m, was calculated with Eq. (5) for all types of specimens. The δ m was used to access the ductile fracture toughness of the steels used. As reviewed in Sec. 1, the toughness of ferrite matrix steels linearly varies with d–1/2 in the three fracture modes. In Fig. 9(a), the δm is also plotted against d–1/2. However, there is no linear relationship between the δ m and d–1/2. An attempt is made to see the correlation of the δm with d in Fig. 9(b). Apparently, the δ m linearly varies with d (δ m = 0.1449 + 0.1977 d; δ m and d are in mm and μm, respectively). The larger the ferrite grain size, the higher the δ m. Equation (3) demonstrates that coarse ferrite grain decreases the fracture toughness, which is inconsistent with the result shown in Fig. 9.
In this study, the ferrite grain-size dependence of fracture toughness is confined to the ductile fracture region. As we know, the ductile fracture is controlled by the plastic strain:18) when strain ahead of a crack tip within a characteristic distance exceeds a critical value (denoted as critical fracture strain), the crack will propagate. Therefore, the ferrite grain-size dependence of the CTOD can be interpreted through the effect of the ferrite grain size on the plastic zone ahead of a crack tip and on the critical fracture strain. The larger the plastic zone and the critical fracture strain, the higher the CTOD.
In the polycrystal, the shear stress, τ, inducing the beginning of the yielding is estimated by the following equation:19)
|
τ=
[
2
τ
c
μb
(1-ν)π
]
1/2
d
-1/2
| (7) |
where
μ is the shear modulus,
τc is the shear yield stress,
b is the Burgers vector,
ν is the Poisson’s ratio, and
d is the average grain size.
Equation (7) shows that
τ is in proportion to
d–1/2. This indicates that coarse grains require lower shear stress to induce yielding,
i.e., yield occurs more easily in coarse grains than in fine grains. Moreover, the size of the plastic zone ahead of a crack is directly related to the yield strength. For plane stress condition, the radius of the plastic zone (
ry) for mode I-type loading is estimated by the linear elastic fracture mechanics, and is given by:
20)
|
r
y
=
1
2π
(
K
I
σ
ys
)
2
| (8) |
where
KI is the stress intensity factor.
Eq. (8) is only suitable to the linear elastic material. For the elastic-plastic materials, for example, the steels used, the radius of the plastic zone (
rp) is twice as large as the
ry (
rp = 2
ry).
20) In plain strain, yielding is suppressed by the triaxial stress state, and the plastic zone size is reduced by a factor of 1/3.
20) Large grain size lowers the
σys and thereby increases the
ry and
rp according to
Eq. (8).
The critical fracture strain just ahead of a crack cannot be precisely measured, but its correlation with ferrite grain size can be determined by tensile testing. As shown in Fig. 7, grain coarsening increases fracture strain. Although there is a difference in stress status between the tensile test and CTOD test, the trend of critical fracture strain against ferrite gain size should be the same in both tests. In summary, the variations caused by grain coarsening, such as lowering the stress level inducing yielding, enlarging the plastic zone ahead of a crack, and increasing the critical fracture strain, determine that increasing ferrite grain size enhances the fracture toughness.
However, Table 2 shows that for 0.45C steel, 0.46 μm and 0.60 μm samples fractured in ductile fracture mode, while the 4.83 μm sample fractured in brittle (cleavage) fracture mode. This seems to conflict with the above conclusion. Cottrell1) suggested that the critical fracture stress (σf) for a cleavage fracture is in proportion to d–1/2. Armstrong21) gave the σf for steels and irons within the ferrite grain size of 10–10000 μm:
|
σ
f
=351.5+3.30×
10
3
d
-1/2
| (9) |
where
d is in
μm and
σf is in MPa. As
d increases, the work-hardening ability increases;
16) as a result, the local stress ahead of a crack elevates. However, as shown in
Eq. (9), grain coarsening simultaneously lowers the
σf. The increased local stress and the decreased
σf due to grain coarsening increase the possibility of a cleavage fracture occurring. However, within the ductile fracture region, grain coarsening increases the fracture toughness.
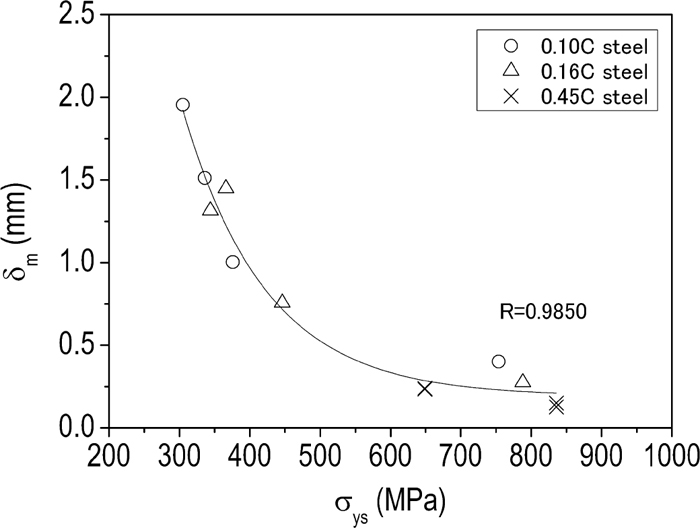
Strength and toughness generally are two conflicting parameters―increasing strength will degenerate toughness. The dependence of the δ m on yield strength is shown in Fig. 10. Irrespective of carbon content, all the data essentially follow a curve, and the δ m decreases with an increase in yield strength. This result agrees with the general knowledge.
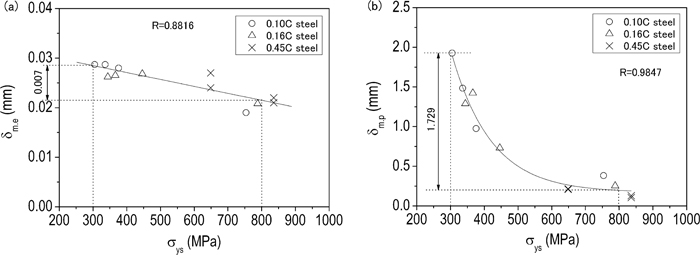
Equation (5) shows that the CTOD is composed of two parts: the first term on the right side is the elastic part (denoted as δm.e); the second term on the right side is controlled by the plastic deformation (denoted as δm.p), i.e., δ m = δ m.e + δm.p. Each part was extracted from the δm and is shown in Figs. 11(a) and 11(b), respectively. The fraction of each part is different at different yield strength levels, e.g., at σys = 300 MPa, δ m.e:δ m.p ≅ 1:67, and at σys = 800 MPa, δ m.e:δ m.p ≅ 1:9. This result demonstrates that the fraction of the elastic part is small, especially when yield strength is low (i.e., ductile fracture toughness is high). The higher the ductile fracture toughness, the higher the fraction of the plastic part. As shown in Fig. 10, when yield strength increases from 300 MPa to 800 MPa, the δm significantly decreases. What causes this decrease? Let us investigate the contribution of elastic and plastic parts to this decrease. As illustrated in Figs. 11(a) and 11(b), both δ m.e and δ m.p decrease, but the decrement is considerably different: Δδ m.e = 0.007 mm, Δδ m.p = 1.729 mm; Δδ m.p is about 245 times that of Δδm.e. This means that the significant decrease in ductile fracture toughness due to the strength increase is attributed to the decreased ability of plastic deformation.
Equation (3) gives us another formula for the relationship between fracture toughness and ferrite grain size. Let us deduce the dependence of fracture toughness (JIC) on yield strength from it. It is well known that σys = k0 + k1 d–1/2, where k0 and k1 are material constants. Substituting this equation into Eq. (3) yields
|
J
IC
=(
J
0
-D
k
0
/
k
1
)
+(
D/
k
1
)
σ
ys
| (10) |
indicates that increasing strength can effectively enhance fracture toughness. This conclusion is inconsistent with the results shown in
Fig. 10 and other extensive experimental data. This called into question the validity of
Eq. (3).
Figure 9 also shows that the δ m is a function of only grain size. The volume fraction of cementite particles has no effect on the δ m. As mentioned in the section of “Introduction”, in the ferrite/pearlite (second phase) steels used in Ref. 8), pearlite is harmful to the toughness in the ductile fracture regime. It is well known that in the hot-rolled steels, pearlite is generally blocky and its distribution is not uniform. Moreover, its volume fraction is large (8.1–16.1%). Because of those characteristics, pearlite provides the sites of void nucleation and produces premature cracking at a smaller deformation level. On the contrary, the cementite particles in the steels used are very fine (generally less than 0.3 μm) and they nearly uniformly distributed. Moreover, their volume fraction is also small (1.53–6.87%). Because of those characteristics, they play a less important role in void nucleation and almost have no effect on the δ m. If the cementite particles are coarse and their volume fraction is high, they should be harmful to the δ m.
4. Conclusions
In the ductile fracture region, the fracture toughness of ferritic steel can be summarized as follows:
(1) As compared to the elastic part, the contribution of the plastic part to the CTOD is dominant.
(2) As ferrite grain size increases, the CTOD linearly increases; simultaneously, the possibility of a cleavage fracture occurring increases.
(3) As yield strength increases, the CTOD decreases. The main reason for this is the decreased ability of plastic deformation.
References
- 1) A. H. Cottrell: Trans. Metall. Soc. AIME, 212 (1958), 192.
- 2) R. W. Armstrong: Eng. Fract. Mech., 28 (1987), 529.
- 3) H. Qiu, R. Ito and K. Hiraoka: Mater. Sci. Eng. A, 435–436 (2006), 648.
- 4) R. Song, D. Ponge, D. Raabe, J. G. Speer and D. K. Matlock: Mater. Sci. Eng. A, 441 (2006), 1.
- 5) H. Qiu and Y. Kawaguchi: J. Mater. Sci., 39 (2004), 3733.
- 6) H. Qiu, Y. Kawaguchi, C. Shiga, M. Enoki and T. Kishi: Mater. Sci. Technol., 20 (2004), 1158.
- 7) H. Qiu, K. Enami, K. Hiraoka, K. Nagai and Y. Hagihara: J. Mater. Sci., 43 (2008), 1910.
- 8) R. J. Klassen, M. N. Bassim and M. R. Bayoumi: Mater. Sci. Eng., 80 (1986), 25.
- 9) M. Srinivas, G. Malakondaiah, R. W. Armstrong and P. Pama Rao: Acta Metall. Mater., 39 (1991), 807.
- 10) M. Calcagnotto, D. Ponge and D. Raabe: Mater. Sci. Eng. A, 527 (2010), 7832.
- 11) H. Qiu, L. N. Wang, T. Hanamura and S. Torizuka: ISIJ Int., 53 (2013), 382.
- 12) M. C. Zhao, T. Hanamura, H. Qiu and K. Yang: Metall. Mater. Trans. A, 37 (2006), 1657.
- 13) M. C. Zhao, T. Hanamura, H. Qiu, K. Nagai and K. Yang: Scr. Mater., 54 (2006), 1385.
- 14) ASTM E1290-99, Standard Test Method for Crack-Tip Opening Displacement (CTOD) Fracture Toughness Measurement, ASTM, West Conshohoken, PA, (1999).
- 15) S. Takaki: 141th and 142th Nishiyama Memorial Seminar, ISIJ, Tokyo, (1992), 1.
- 16) H. Qiu, L. N. Wang, T. Hanamura and S. Torizuka: Mater. Sci. Eng. A, 536 (2012), 269.
- 17) S. Torizuka, E. Muramatsu, S. V. S. N. Murty and K. Nagai: Scr. Mater., 55 (2006), 751.
- 18) R. O. Ritchie and A. W. Thompson: Metall. Trans. A, 16 (1985), 233.
- 19) M. Kato: Introduction to the Theory of Dislocations, Shokabo Press, Tokyo, (2003), 121.
- 20) T. L. Anderson: Fracture Mechanics, 3rd ed., CRC Press, New York, (2005), 62.
- 21) A. W. Armstrong: Fracture 1977, ICF4, ed. by D. M. R. Taplin, Vol. 4, Pergamon Press, Oxford, (1977), 83.